Hi all,
I didn´t use that funcionality for a while, but before I could add several instruments in the ProBacktest window and the results for each of the selected instruments appeared together in a separate window. Now when I try that there is no new window appearing and it doesn´t seem to do anything else than the backtest of the instrument in the main graph, ignoring the rest of instruments I added in the tabs of the ProOrder Backtest window
Is this working different or it just doesn´t work anymore??
Cheers
It seems to be working different as we now have a ‘Multi-Results Table’ showing multi results from selected Timeframes, but not from more than 1 Instrument.
Please post a screenshot of how (using which button etc) you add > 1 Instrument to probacktest and I’ll replicate your method to see what I get.
Hi Grahal,
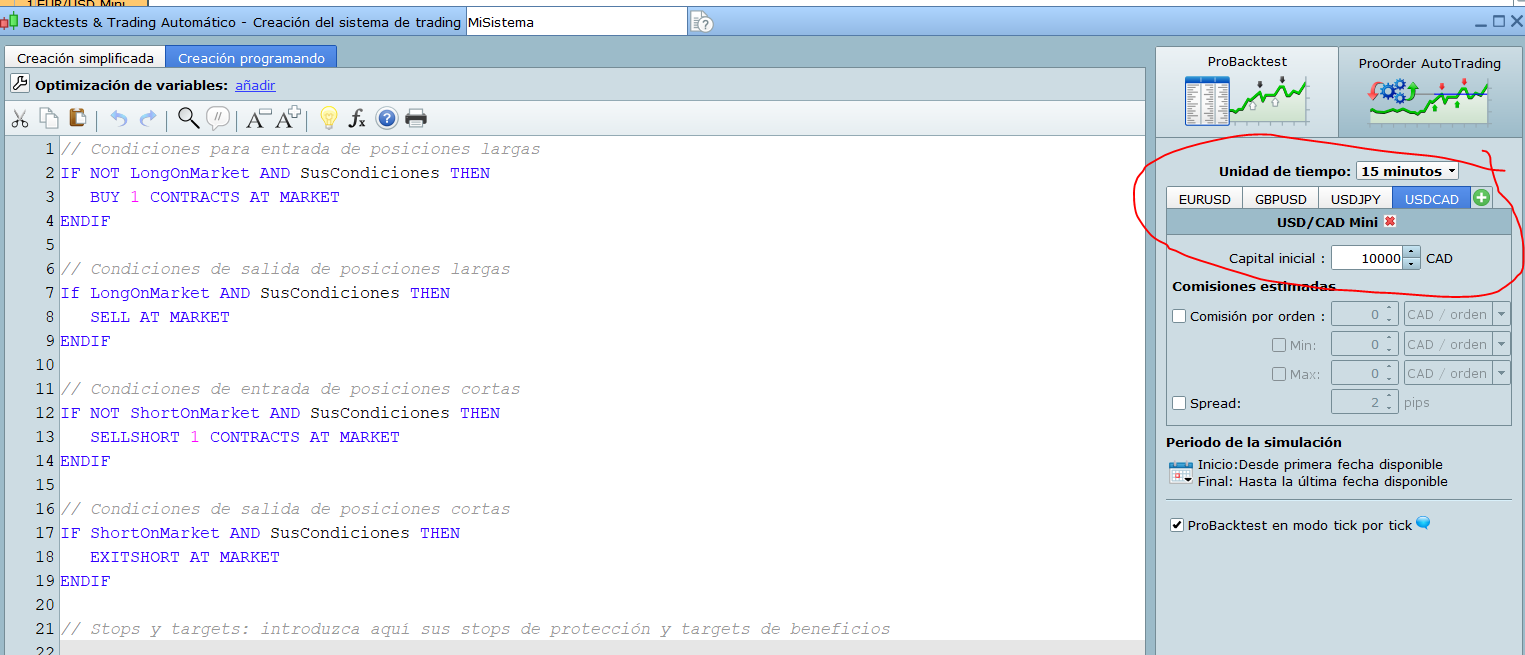
In the picture you can see where we can add several instruments for the same backtest, one tab for instrument. And before when I executed this backtest with several instruments a new window appeared with the resulst for each instrument. Now it doesn´t, doesn´t seem to do anything but the usual instrument-on-graph backtest no matter how many instruments you add in these tabs.
I didn´t know about the “Multi-Results Table” for different TFs you comment.. Where is it or how can I run it?
Thanks
And before when I executed this backtest with several instruments a new window appeared with the resulst for each instrument.
Was it backtests (not optimisation?) you did with several instruments at same time?
Was the new window you speak of a ‘Detailed Report’ and I guess you must have had separate equity curves as well as separate Detailed Reports for each instrument
Where is it or how can I run it?
The Multi-Results Table appears as a default when you run optimisation using different Timeframes.
The multi resuts beng one set of opti-results (variable values) for each Timeframe.
?
but not from more than 1 Instrument.
Correction… the multi-Table does show results from optimisation of more than 1 instrument, but we can optimise only one instrument at a time.
as it backtests (not optimisation?) you did with several instruments at same time? Was the new window you speak of a ‘Detailed Report’ and I guess you must have had separate equity curves as well as separate Detailed Reports for each instrument
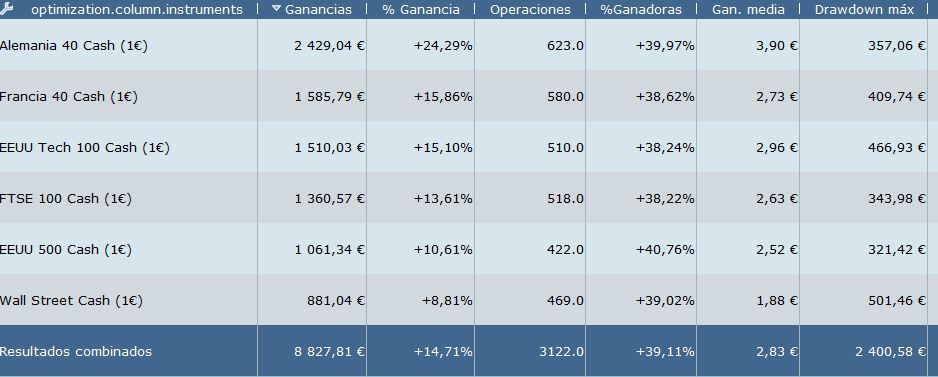
You could do both, just backtest or optimisation, for all the instruments together. About the window that appeared before I realized I have a picture of it from some time ago, it´s the first image attached. It was ONE window for all the instruments with the main data. The image is just a backtest, in case you did a optimisation you could see also the results of the variables for each instrument. Also you could select each of the rows/instruments in the window and the graph/detailed report of that instrument appeared as usual. This function has some issues but was a very useful, I used quite a lot and I hope it hasn´t go missing now.
The Multi-Results Table appears as a default when you run optimisation using different Timeframes. The multi resuts beng one set of opti-results (variable values) for each Timeframe.
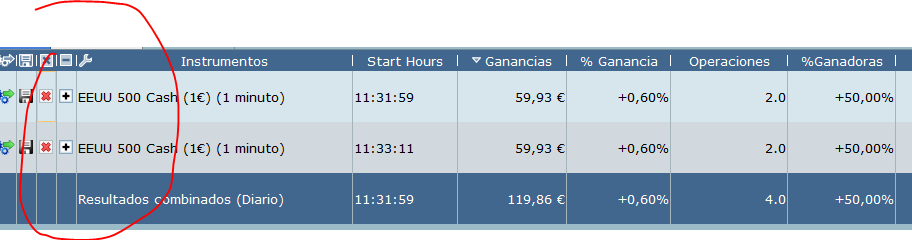
Sorry Grahal, I don´t follow you, can you send me some picture of it?. I tried to do an optimization in a system with different Timeframes in its code and the results where as always. I did notice now something new though: if I do consecutive/different optimisations the results no desappear as before but are kept in the “optimisation window” in a different “set of data” that you can expand/contract as in the second image attached. But they are different/consecutive optimisations I did, not different Timeframes as you mention.
Sorry I was referring to Timeframe of the Chart – named as Timescale Resolution.
The multi-Table is very similar to what you show above except that Instrument No 2 (which then replaces Instrument No 1) is added / selected using the drop-down to the left of Timescale Resolution.
Ok, if I understand you correctly now you are referring to the new feature as in my 2nd attached image, where you can do different/consecutive optimisations and keep all the results in the same table/window so you can compare them. Is that right?
But this is not only MultiTimeFrame related as you mentioned before, it can be used for any kind of diferent optimisations: different variables, different instruments, different timeframes…. you can do all these different optimisations and all them will appear together in that table/window to compare.
It´s an interesting and probably useful new feature, but now I just wanted the old multiinstrument feature because with it I could get similar analysis much easier as I didn´t have to execute one different opitimisation per instrument as here
Yes use of the multi-Table is as you describe above.
I can’t help wondering if the limit of ‘1 opti at a time’ has been introduced to limit opti-load on PRT servers?
I would have tried the multi-instrument opti, but I never noticed that + button! 🙂
- Did, for example, 3 optis run in parallel and 3 sets of results appear simultaneously?
- Or
did No 1 algo run fully, then No 2 algo start and run fully, then no 3 etc??
can’t help wondering if the limit of ‘1 opti at a time’ has been introduced to limit opti-load on PRT servers?
You are probably right, it sounds like the kind of thing they would do. It´s a shame though, for me it was a very useful feature
Did, for example, 3 optis run in parallel and 3 sets of results appear simultaneously? Or did No 1 algo run fully, then No 2 algo start and run fully, then no 3 etc??
I think they runned in parallel, because during the calculations a window appeared with the % progress for each instrument, and they looked like they runned all at the same time.