I was building a simple multi timeframe strategy based on the Absolute Strength indicator:
Absolute Strength
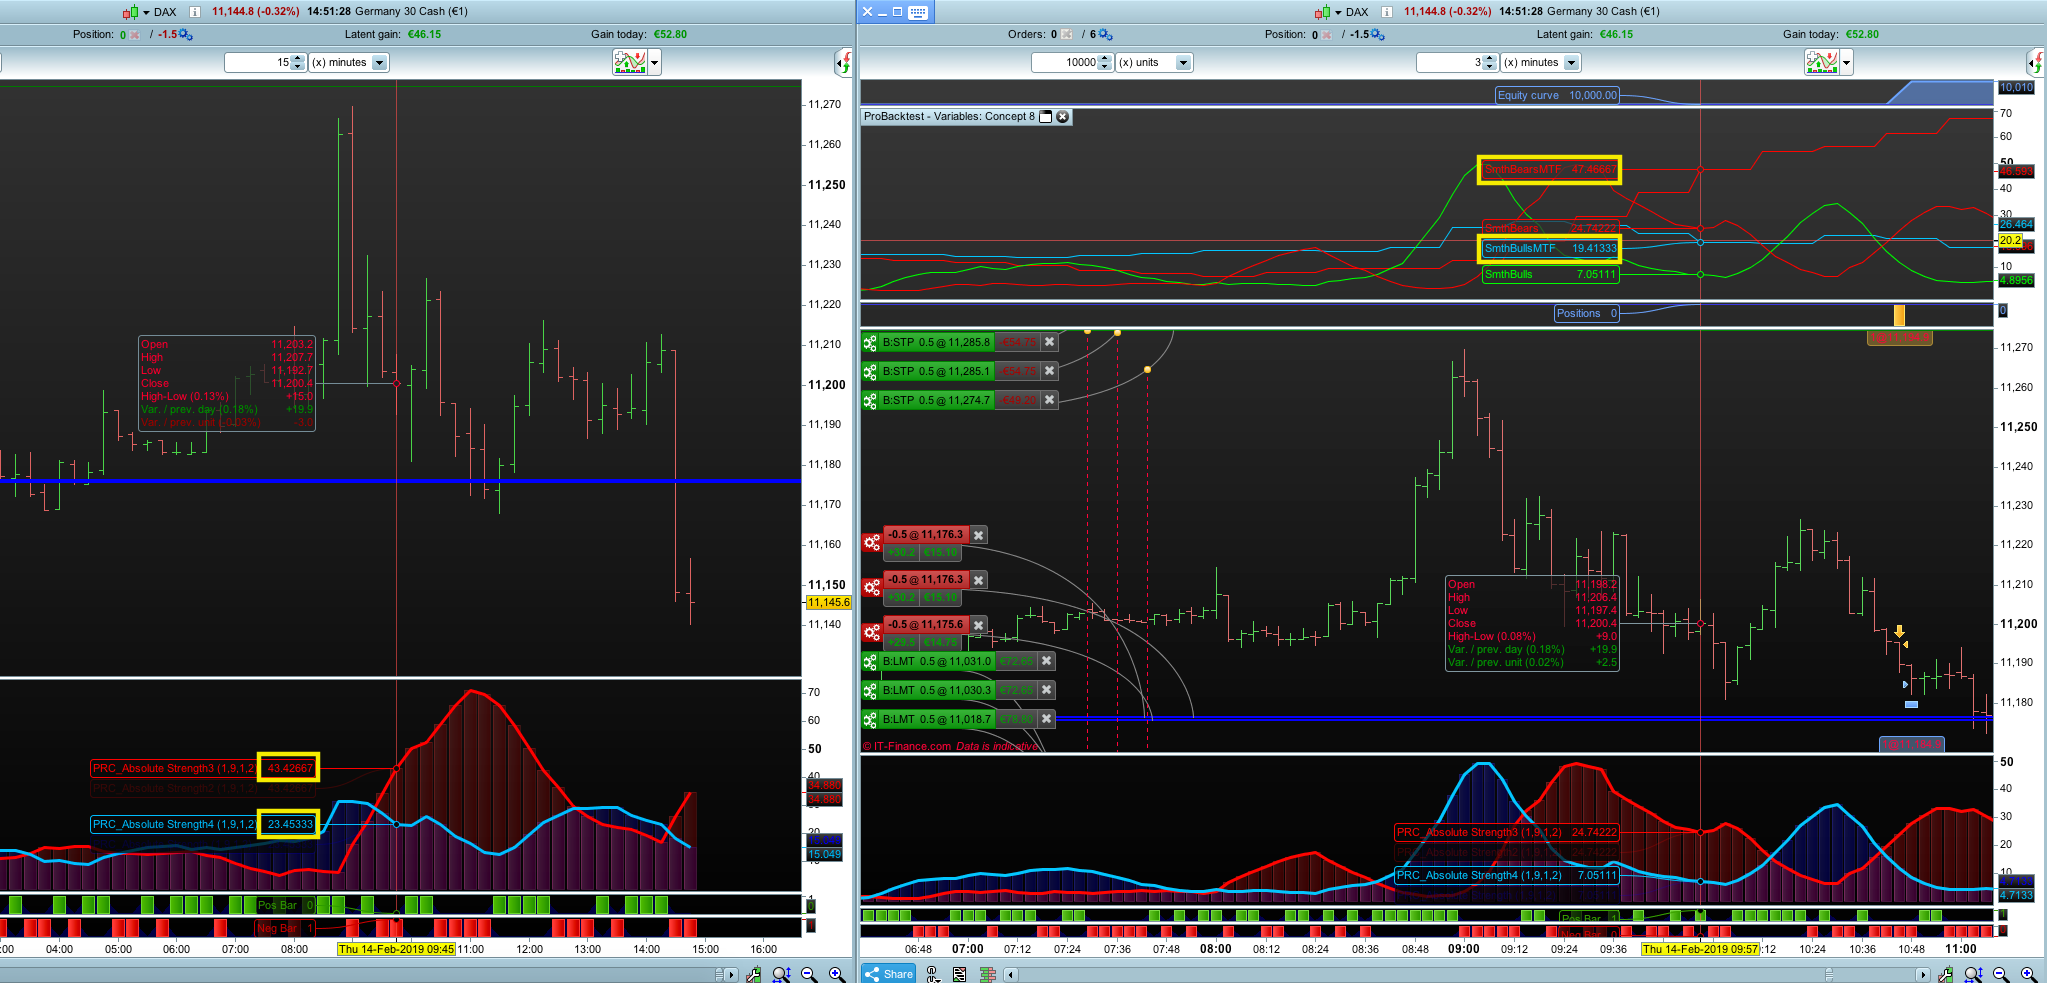
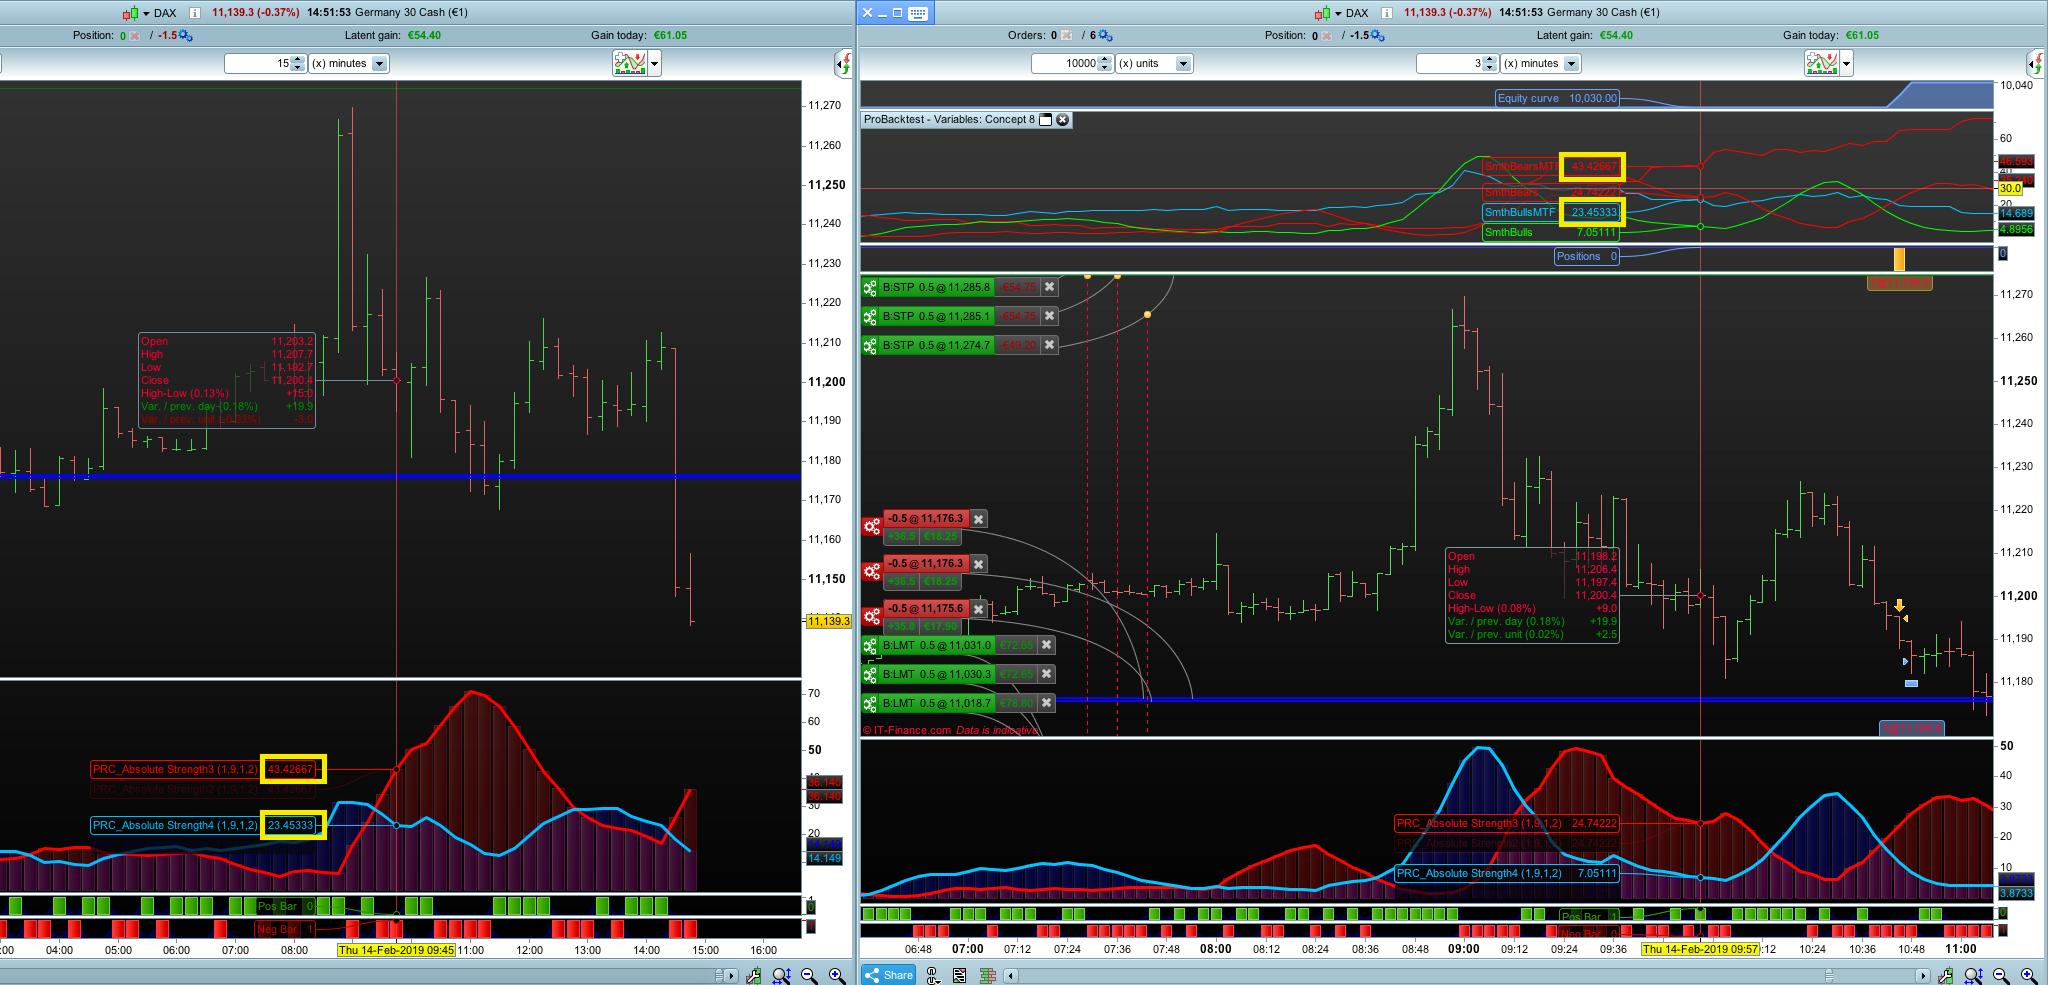
I am using the 3 Min chart of the Germany 30 Cash index as my current timeframe and the 15 Min chart for my higher timeframe.
I am also using the Graph function to make sure I get the correct values for the Absolute Strenght lines.
When looking at the Graph output, I noticed that when I use the condition “Timeframe(15 minutes,updateonclose)”, the Absolute Strength lines of the 15 Min timeframe slightly differ from the “true” values on the 15 Min chart.
However, when I use the condition “Timeframe(15 minutes)” [without, updateonclose], the Absolute Strenght lines are correct.
I would rather like to use the updateonclose condition for my strategy, so I would like to find out why this difference exist and if it can be fixed?
Below you can find my code and some screenshots to further illustrate my problem (I realise it probably isn’t the best looking code, especially the way I handled the MTF bit, but thats due to my lack in coding experience – mayby that’s why I have this problem in the first place)
//-------------------------------------------------------------------------
// Main code : AbsStrength (3M) - Concept 8
//-------------------------------------------------------------------------

Defparam Cumulateorders = False

//15 minute timeframe conditions
Timeframe(15 minutes,updateonclose)

//Absolute Strength Indicator START
// --- settings
ModeMTF   = 1   // 0-RSI method 1-Stoch method
LengthMTF = 9 // Period
SmoothMTF = 1 // Period of smoothing
ModeMAMTF = 2 // Mode of Moving Average
// --- end of settings

if barindex>max(LengthMTF,SmoothMTF) then
Price1MTF=customclose
Price2MTF=customclose[1]

if ModeMTF=0 then
BullsMTF=0.5*(Abs(Price1MTF-Price2MTF)+(Price1MTF-Price2MTF))
BearsMTF=0.5*(Abs(Price1MTF-Price2MTF)-(Price1MTF-Price2MTF))
endif
if ModeMTF=1 then
smaxMTF=Highest[LengthMTF](high)
sminMTF=Lowest[LengthMTF](low)
BullsMTF=Price1MTF - sminMTF
BearsMTF=smaxMTF - Price1MTF
endif

AvgBullsMTF=average[LengthMTF,ModeMAMTF](BullsMTF)
AvgBearsMTF=average[LengthMTF,ModeMAMTF](BearsMTF)

SmthBullsMTF=average[SmoothMTF,ModeMAMTF](AvgBullsMTF)
SmthBearsMTF=average[SmoothMTF,ModeMAMTF](AvgBearsMTF)
endif
//Absolute Strength Indicator END

//"default" timeframe conditions
Timeframe(default)

//Size & Targets
Positionsize = 1

PTL = 10
SLL = 10
PTS = 10
SLS = 10

// Day & Time
Once Entertime = 090000
Once Lasttime  = 173000

Tt1 = Time >= Entertime
Tt2 = Time <= Lasttime
Tradetime = Tt1 And Tt2

//Absolute Strength Indicator START
// --- settings
Mode   = 1   // 0-RSI method 1-Stoch method
Length = 9 // Period
Smooth = 1 // Period of smoothing
ModeMA = 2 // Mode of Moving Average
// --- end of settings

if barindex>max(Length,Smooth) then
Price1=customclose
Price2=customclose[1]

if Mode=0 then
Bulls=0.5*(Abs(Price1-Price2)+(Price1-Price2))
Bears=0.5*(Abs(Price1-Price2)-(Price1-Price2))
endif
if Mode=1 then
smax=Highest[Length](high)
smin=Lowest[Length](low)
Bulls=Price1 - smin
Bears=smax - Price1
endif

AvgBulls=average[Length,ModeMA](Bulls)
AvgBears=average[Length,ModeMA](Bears)

SmthBulls=average[Smooth,ModeMA](AvgBulls)
SmthBears=average[Smooth,ModeMA](AvgBears)
endif
//Absolute Strength Indicator END

//"default" timeframe
Timeframe(default)

//Entry & Exit Conditions
If Tradetime Then
If SmthBulls>SmthBears and SmthBulls[1]<SmthBears[1] and SmthBullsMTF>SmthBearsMTF and SmthBullsMTF>SmthBullsMTF[1] and SmthBearsMTF<SmthBearsMTF[1] Then
Buy Positionsize Contract At Market
SET TARGET PROFIT PTL
Set Stop loss SLL
Endif
Endif

If Tradetime Then
If SmthBulls<SmthBears and SmthBulls[1]>SmthBears[1] and SmthBullsMTF<SmthBearsMTF and SmthBullsMTF<SmthBullsMTF[1] and SmthBearsMTF>SmthBearsMTF[1] Then
Sellshort Positionsize Contract At Market
SET TARGET PROFIT PTS
Set Stop loss SLS
Endif
Endif


graph SmthBullsMTF coloured(0,191,255)
graph SmthBearsMTF coloured(255,0,0)

graph SmthBulls coloured (0,300,0)
graph SmthBears coloured (300,0,0)