Good Morning,
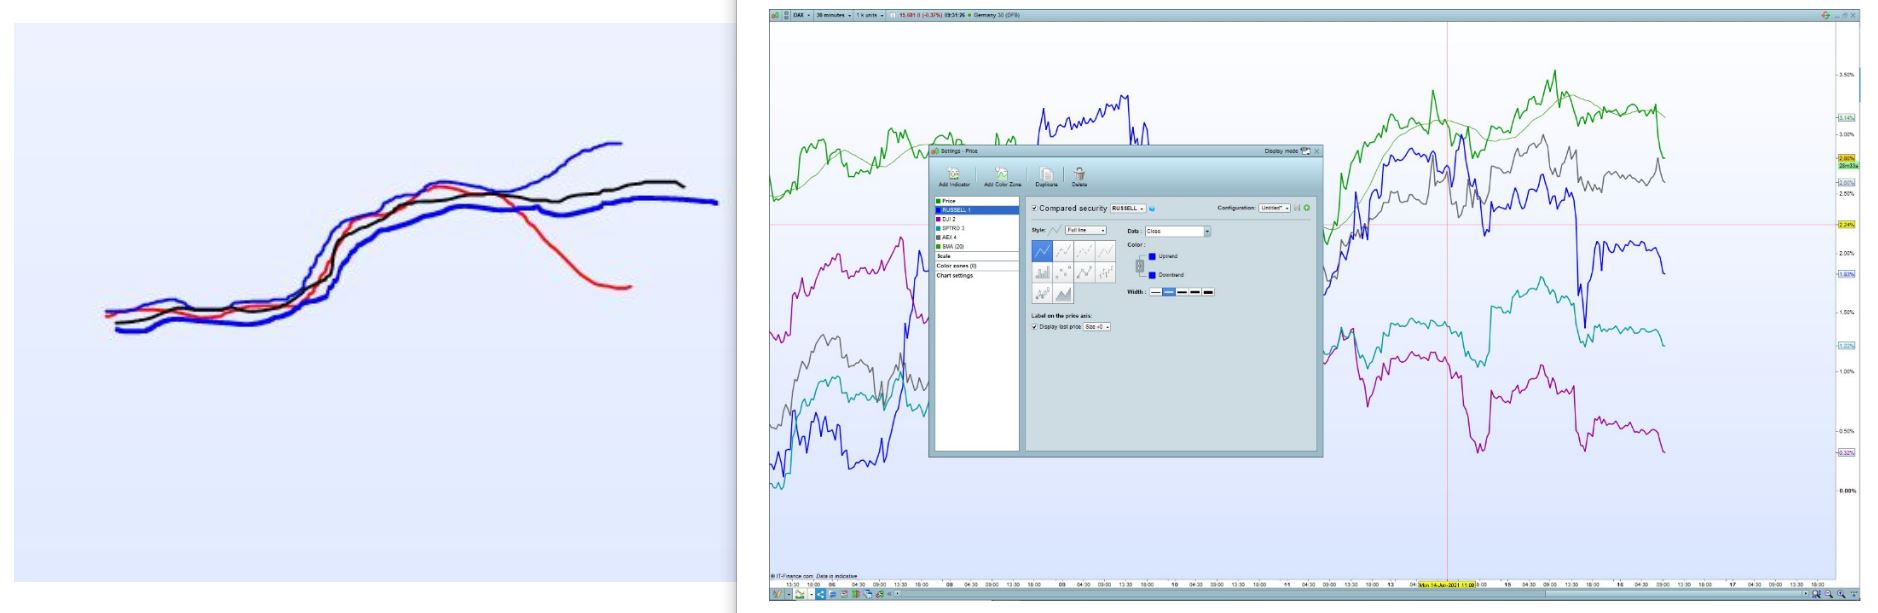
I am trying to create an indicator in PRT that can help me identify correlations and when these correlations are not in sync. I have taken the DAX and added Russell, Dow, S&P, AEX as a compared security. I have converted these to a line chart however I now want to be able to apply a moving average to of the compared assets. I can of course add an SMA to the DAX as this is a DAX chart however I am unable to do it on the compared assets. Please see attached image of where I am at the moment.
Once I have converted the others into SMA’s I will have 5 smoothed lines which I can adjust the vertical shift. By adjusting the vertical shift I will be able to bring them into line and have an indicator that will show me when the correlation steps out of line. (please see sketch of desired outcome).
If this is something you think could be done please let me know.
Many thanks
Alastair