VN
VNParticipant
Average
“So it will next update its value at the close of the 2344 candle.” – Vonasi, that is exactly the issue and my point on this. The “updateonclose” should update on every 5 min, an it does, so that is to be expected and is correct, BUT what is puzzling is why the 5 min candle closes at hh:44. I would expect the “updateonclose” values to update every 5 mins starting from the top of the hour ie hh:00 then hh:05, then hh:10 and so until hh:55 (as I already mentioned this in one of my posts) just like any indicator which is plotted on a 5 min candle. If you run a 5 min chart your time frames and your candle closes will also be on 00,05,10,15,20… 55 times, not 04,09,14… 44 0r 54min!
If you compare the “5m RSI updateonclose” setup (TIMEFRAME (5min, updateonclose) indicator (RSI14,close) running on a 1 min chart) to exactly the same indicator on a separate 5 min chart I would expect on every 5 min interval starting from top of the hour the values for both of these to be equal. If you do this on your end you will see that in fact, on every round 5 min interval (00, 05, 10, 15 etc to 55) the “5m RSI updateonclose” (running on the 1 min default hart) does NOT equal the 5 min RSI on the separate 5 min chart. That cannot be correct.
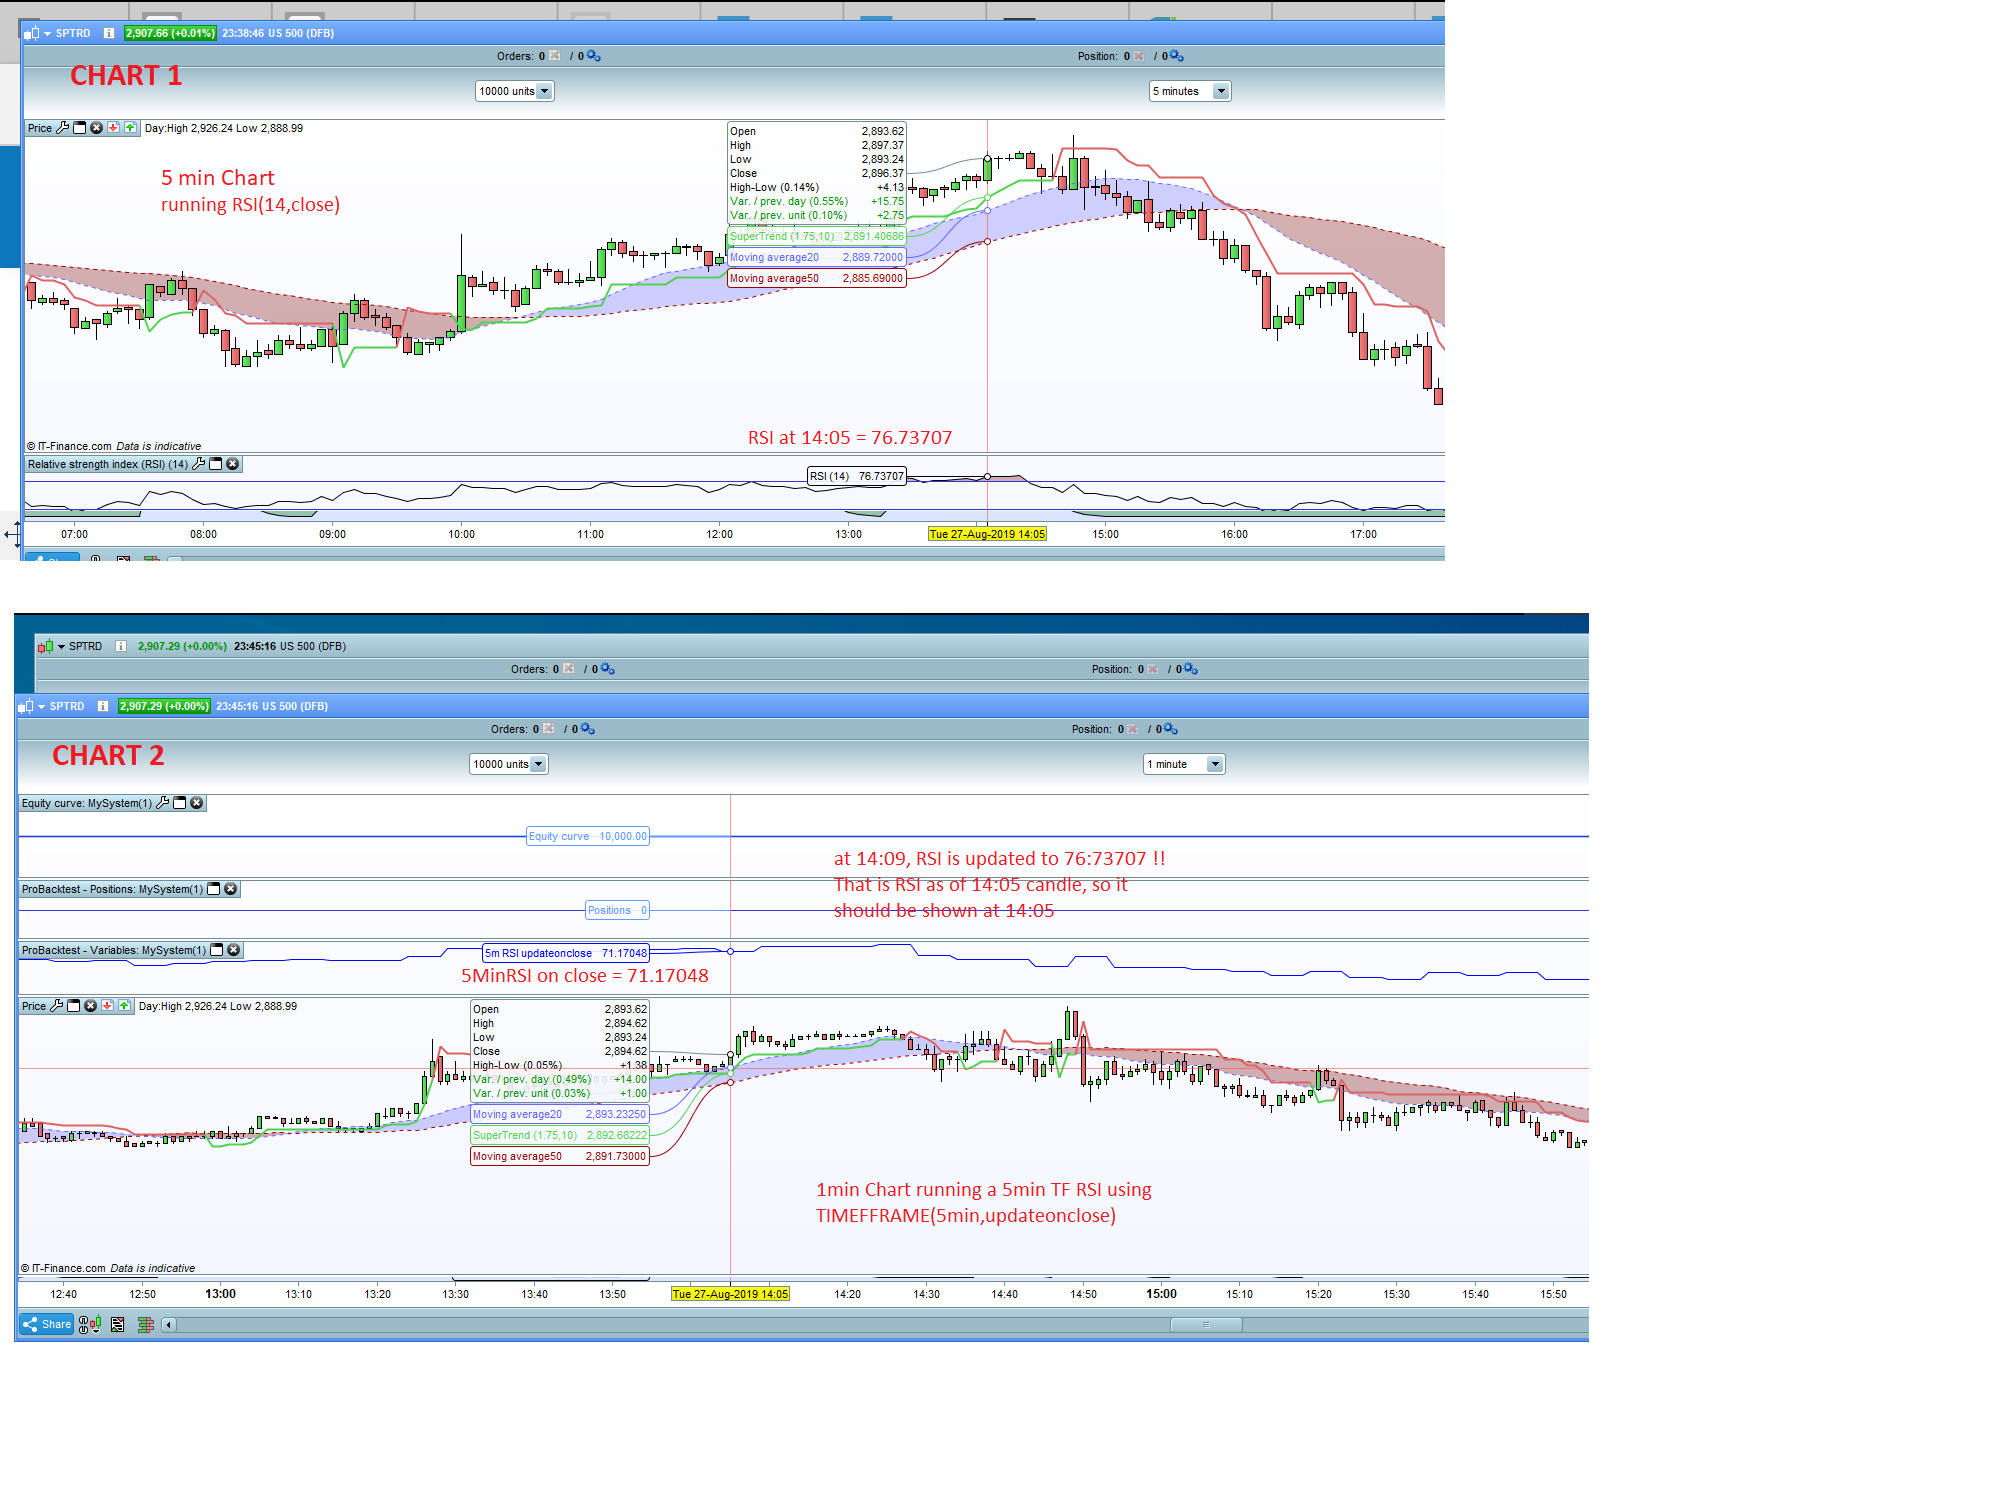
The attached screenshot show this.
The 1st chart shows the RSI14,close indicator running on the 5 min chart and on the close of 14:05 it reads 76.73707. That is the 5 min RSI close and is what I would expect to see at 14:05 on the 1 min chart running the 5min Timeframe,updateonclose function.
On the 2nd chart you have the equivelent 5m RSI updateonclose running on 1 min candles and if you pick the exact same 5 min point in time as the 5 min indicator so in this case 14:05 the “5m RSI updateonclose” = 71.17048. Surely that should read 76.73707 as at 14:05, that 5 min close is known (which is what the TIMEFRAME(5min, updateonclose is supposed to return) the 5 min candle has closed and it should return what the 5 min RSI has on the 5 min chart which is 76.73707. At 14:05 these two charts should show the same numbers, nut they dont. Like you have seen the 76.73707 is shown at 14:09 which is completely wrong as at that point we are almost closing the 10min candle. Is this a bug in the code, as I cannot understand how this logic is correct?! At 14:05 the 5 min price history is known and so the timeframe function should evaluate the indicator and return it exactly at 14:05 and not a min later.
14:09 is the open time of the 1-min candle of the 14:10 close time of the 5-min candlestick. RSI is calculate on Close value of the 14:05 candle which happen at 14:10. You must compare the same time of the closure between the 2 timeframes, that’s where your trouble come from.
The 1409 candle on the 1 minute chart closes at 1410 and the 1405 candle on the 5 minute chart also closes at 1410!
The 1409 candle runs from 1409 until the last tick in that minute and then the candle closes – so till 1410. Any indicator value for that candle is then fixed at what ever value resulted from that last tick – so it is the indicator value for 1410. Your strategy will be placing orders at the open of the next candle which is the 1410 candle.
VNParticipant
Average
Guys,
I’m not quite following.
Looking at just the 5min candle chart RSI alone and the value of 76.73707 shown at 14:05 close in chart1 of my image. My understanding is that this value is determined on the close of that 59th second at 14:04:59. That point in time marks a complete 5 min candle ie from 14:00 to 14:05 so as soon as that last 4th minute competes and the clock turns 14:05 the price is known and the value of 76.73707 is calculated and displayed. Therefore 76.73707 is at the close of the last 4th minute and is displayed as the RSI at 14:05 – you can clearly see that on chart1 of the image.
If above is true, then the 1min chart at 14:05 running the timeframe(5min,updateonclose) should show 76.73707 just like the 5min chart shows at 14:05.
What am I missing here?
Regards
Vassco
You are missing the fact that ALL indicators work on a specific TF, RSI[14] will calculate the 14-period RSI of the last 14 bars, 14 1-minute bars ARE NOT the same as 14 5-minute bars!
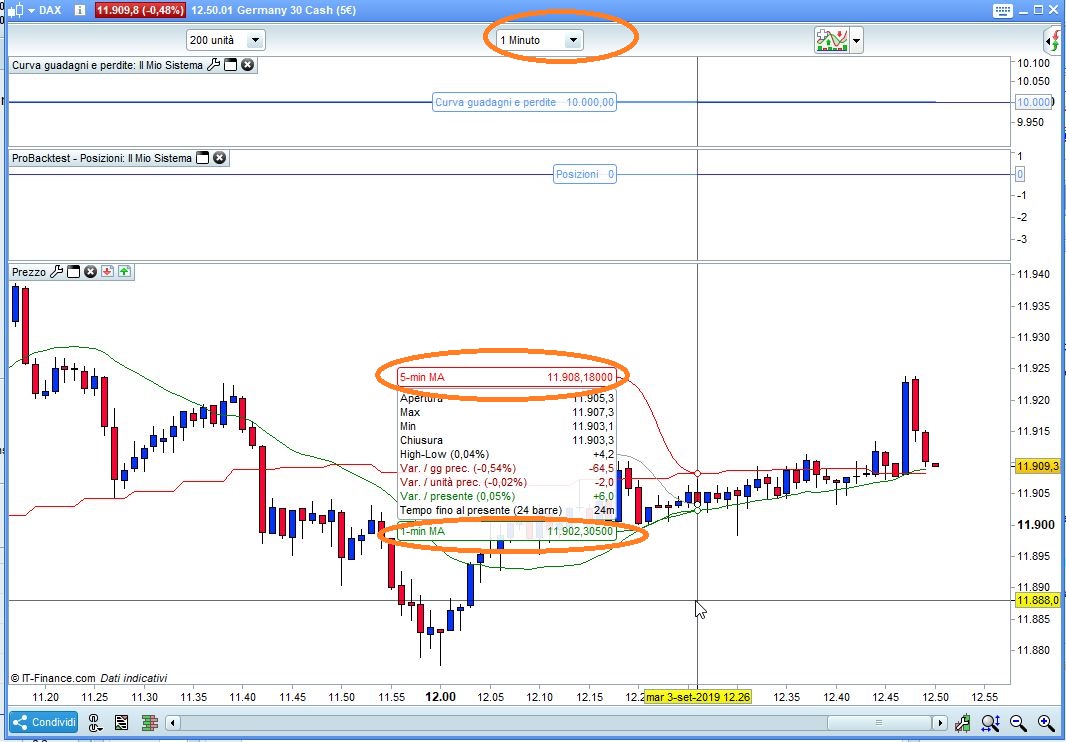
Try this dummy strategy on ProBackTest:
TIMEFRAME(5 minute,updateonclose)
Avg1 = average[20](close)
TIMEFRAME(default)                  //Run it from a 1-minute chart
Avg2 = average[20](close)
buy at -close limit
GraphOnPrice Avg1 coloured(255,0,0,255) AS "5-min MA"
GraphOnPrice Avg2 coloured(0,128,0,255) AS "1-min MA"
You will spot the two different MA’s.
VNParticipant
Average
Thanks Roberto for your input also, but this is not the comparison I am doing to illustrate my issue. I am not comparing a 5 min 14 period RSI to a 1 min 14 period RSI like you have shown – of course they will be different. These are completely two different reference points in time so the prices will be different so any indicator you put on will give you different values.
What I am comparing and expecting to be the same is a 14 period RSI running on a 5 min chart (ie that will naturally be a 5 min RSI) VERSUS a timeframe(5min,updateonclose) RSI running on a 1 min chart. What I am then checking is that at each 5min interval on that 1min chart or any time on the 1 min chart that aligns to the same time point on the 5 min chart (eg hh:00 or hh:05 or hh:10 …. etc to hh:55) that timeframe(5min,updateonclse) variable should equal the the RSI returned on the separate 5min chart. Do you follow?
So in your example code you kindly copied here, just compare the “avg1” value (the timeframe(5,updateonclose) running on your 1min chart to the average(20,close) on a separate DAX chart window running 5 min candles. Then pick a point time which appears on both charts eg 12:50 and compare the two values (it will have to be hh:00 or hh:05 or hh:10 or up to hh:55). I am expecting that at 12:50 point in time what your avg1 variable (timeframe(5min,updateonclose)) running on the 1min chart to show the same value as the 5min AVG running on your other separate DAX chart running 5min candles. Don’t look at anytime which is not on the 5min chart eg in your last image you had 12:46 as that time will not be on the 5min chart since that only closes on round 5min intervals. You will see that at 12:50 avg1 will NOT equal the 12:50 average on your 5min chart. That is what I cannot understand.
Your assumption is wrong.
1-minute chart can be used to set the pace at which strategies are executed, but ALL timeframes used are separate and each of them calculates its own indicators independent of the other ones.
What you want to do is simply impossible.
VNParticipant
Average
So why is my understanding incorrect Roberto, can you please explain?
Isn’t the functionality of timeframe(5min,updateonclose) function on a 1min chart the same as actually running an indicator on a separate 5min chart?? Isn’t the updateonclose which if set at 5min would do the same thing as the separate 5min chart running the same indicator?
14 1-minute bars ARE NOT the same as 14 5-minute bars!
VN – I think this is the important bit of information that you seem to be struggling with!
Your assumption is right VN, but you should re-read my last explanation and look at chart at the same time.
VNParticipant
Average
Hi Nicolas, thank you very much for confirming my assumption and by looking at a live chart comparison I understand what you mean in terms of the timing, but I do not know how to code this logic so that it is comparing like for like across the two times.
Vonasi kindly helped me with the original code which is below. Essentially I am trying to execute a trade when the 14 period RSI running on default TF candle e.g 1min falls below 30 AND at the same time as that happens I want the ROC, running on a 5 min TF to be negative AND the prior 5 min ROC from the prior candle to be less less than current 5 min ROC (condition1 in the code below). Running this code however gives rise to the timing issue which you have picked up on as it ROC(0) under the 1 min candle isn’t the ROC[0] on the 5 min candle. So as an example if the trade execution decision takes place under the timeframe(default) code ie the conditions are checked every 1 min, which 5 min ROC(n) do I need to reference as my current and prior ROC in the timeframe(5min,updateonclose) so that the check lines up to the same timeline to the execution time. In essence Nicolas, all I am doing is trying to automate what anyone of us will do when using two different timeframe charts and make a call but obviously doing it off one chart that is running the “timeframe(5min,updateonclose)” function.
In my simple example I am using the 1 min chart RSI as my 1st entry trigger condition and at the same time as a secondary confirmatory conditon, I am running a ROC on a 5min chart and I am checking that when the 1 min RSI falls below 30, I immediately look at my ROC running on the 5 min candle chart and if the ROC at that point in time shows me it is negative AND the prior ROC is lower than the current (closed) ROC then I put the trade on.
Can this be coded at all?
timeframe(5 minute, updateonclose)
myRSI5 = rsi[14](close)
myROC5 = ROC[14](close)                 // set the 5 min interval calculation point
condition1 = myROC5 < 0 AND myROC5[0] < myROC5[1]                      // to be done on a 5 min timeframe interval

timeframe(default)
myRSI = rsi[14](close)
condition2  = myRSI crosses under 30           // evaluated on the default chart time frame

IF NOT ShortOnMarket AND condition1 AND condtion2 THEN
SELLSHORT 1 at MARKET
ENDIF
VN – I’ve read your last post six times and I still have absolutely no idea what you are on about and I like to think that I know just a little bit about ProRealCode and strategy creation and MTF. Have you ever considered that 100 well chosen words could get a point across much easier than 100000 words? 🙂
RSI closed value (because you use UPDATEONCLOSE) of 10′ o clock will remain the same until the next 5-min bars will close. So between that time all the 1-minute bar will use that previous closed value. It is only after 10h05 that the 1-minute timeframe will be able to use that new value.
Imagine that a year is the 5-min TF and a single day is the 1-min TF: My birthday is 2nd April, everyday after that I have the same age until another year has passed.
Imagine that a year is the 5-min TF and a single day is the 1-min TF: My birthday is 2nd April, everyday after that I have the same age until another year has passed.
…and if you use DEFAULT instead of UPDATEONCLOSE then every day your age (Let’s use 45 as an age as I have no idea how old Nicolas is!) will change by 1 day or a value of 1/365 (0.0027) each day. So the value will be 45 years and 1 day (45.0027) and then 45 years and 2 days (45.0055) and so on. At the close of the final day of the birthday year on 1st April it will be midnight and Nicolas’s age will change to 46 at the close of both the day and the year method of counting.
Festive greetings. I was hoping you can help. I’m a bit stuck with multi timeframe analysis – have been testing out a few strategies. Sometimes the trade is executed as expected, sometimes not. Also when you backtest in some cases it states the entry and exit time is exactly the same and shows a profit or loss when technically it should be 0. I think this is true in a lot of cases actually – the ‘nbr bars’ shows many 0s yet in the ‘abs perf’ there are profits or losses – therefore the overall profit/loss figure is not right. I cant tell whether this is coding issue or an issue with multi timeframe?
The code is below is an example using 10 hours and 10 mins as the default
<pre class=”lang:probuilder decode:true “>defparam cumulateorders=true
timeframe(10 hour,updateonclose)
myrsi1=rsi[10](close)
timeframe(default)
myrsi2=rsi[4](close)
// BUY conditions
Bullish0 = myrsi1>70 and myrsi2 crosses over 30
IF Bullish0 THEN
buy 2 perpoint AT MARKET
set stop trailing 10
ENDIF
// SELL Conditions
Bearish0 = myrsi1<30 and myrsi2 crosses under 70
IF Bearish0 THEN
SELLSHORT 2 perpoint AT MARKET
set stop trailing 10
ENDIF