I am just wandering if anyone could help to convert moxie indicator and scanner from TOS (think of swim) to PRT.
Code as below
indicator
# ST_Moxie_Hourly Indicator

declare lower;DefineGlobalColor("UpTrend", Color.GREEN);DefineGlobalColor("DownTrend", Color.RED);DefineGlobalColor("NoTrend", Color.LIGHT_GRAY);def hP1a = AggregationPeriod.Day;def s5v = 12;def ul = Average( High * (1 + 4 * (High - Low) / (High + Low)), length = 14);def s5r = 26;def s5g = 9;def vc1 = ExpAverage(close(period = hP1a) , s5v) - ExpAverage(close(period = hP1a) , s5r);def m2 = AbsValue((close - Lowest(low, s5r)) - (Highest(high, s5g) - close)) / (Highest(high, s5g) - Lowest(low, s5g));def va1 = ExpAverage(vc1, s5g);plot Moxie = (vc1 - va1) * 3; def g1 = Cos(1.32 * 2 * Double.Pi / (s5g / 0.1));Moxie.SetStyle(Curve.FIRM);Moxie.SetLineWeight(2);Moxie.HideTitle();def l1 = Moxie < Moxie[1];def h1 = Moxie > Moxie[1];def sig = if l1 then yes else if sig[1] == yes and h1 == no then yes else no;Moxie.AssignValueColor(if sig then Color.RED else Color.UPTICK);plot zeroLine = if close[-1] > 0 then 0 else Double.NaN;zeroLine.setDefaultColor(Color.gray);zeroLine.SetStyle(Curve.FIRM);zeroLine.SetLineWeight(2);zeroLine.HideBubble();zeroLine.HideTitle();
Trade Signal
# ST_MoxiePriceSignal_Hourly

def hP1a = AggregationPeriod.Day;def s5v = 12;def ul = Average( High * (1 + 4 * (High - Low) / (High + Low)), length = 14);def s5r = 26;def s5g = 9;def vc1 = ExpAverage(close(period = hP1a) , s5v) - ExpAverage(close(period = hP1a) , s5r);def m2 = AbsValue((close - Lowest(low, s5r)) - (Highest(high, s5g) - close)) / (Highest(high, s5g) - Lowest(low, s5g));def va1 = ExpAverage(vc1, s5g);def Moxie = (vc1 - va1); plot crossingAbove = if Moxie[1] < 0 and Moxie > 0 then low(period = AggregationPeriod.DAY) else Double.NaN;plot crossingBelow = if Moxie[1] > 0 and Moxie < 0 then high(period = AggregationPeriod.DAY) else Double.NaN;crossingAbove.SetDefaultColor(Color.GREEN);crossingAbove.SetPaintingStrategy(PaintingStrategy.ARROW_UP);crossingBelow.SetDefaultColor(Color.RED);crossingBelow.SetPaintingStrategy(PaintingStrategy.ARROW_DOWN);
Scanner
# ST_Moxie_Scan Scanner

declare lower;def s5v = 12;def ul = Average( High * (1 + 4 * (High - Low) / (High + Low)), length = 14);def s5r = 26;def s5g = 9;def vc1 = ExpAverage(close , s5v) - ExpAverage(close , s5r);def m2 = AbsValue((close - Lowest(low, s5r)) - (Highest(high, s5g) - close)) / (Highest(high, s5g) - Lowest(low, s5g));def g1 = Cos(1.32 * 2 * Double.Pi / (s5g / 0.1));def va1 = ExpAverage(vc1, s5g);plot MoxieScan = ((vc1 - va1) * 3) > 0;
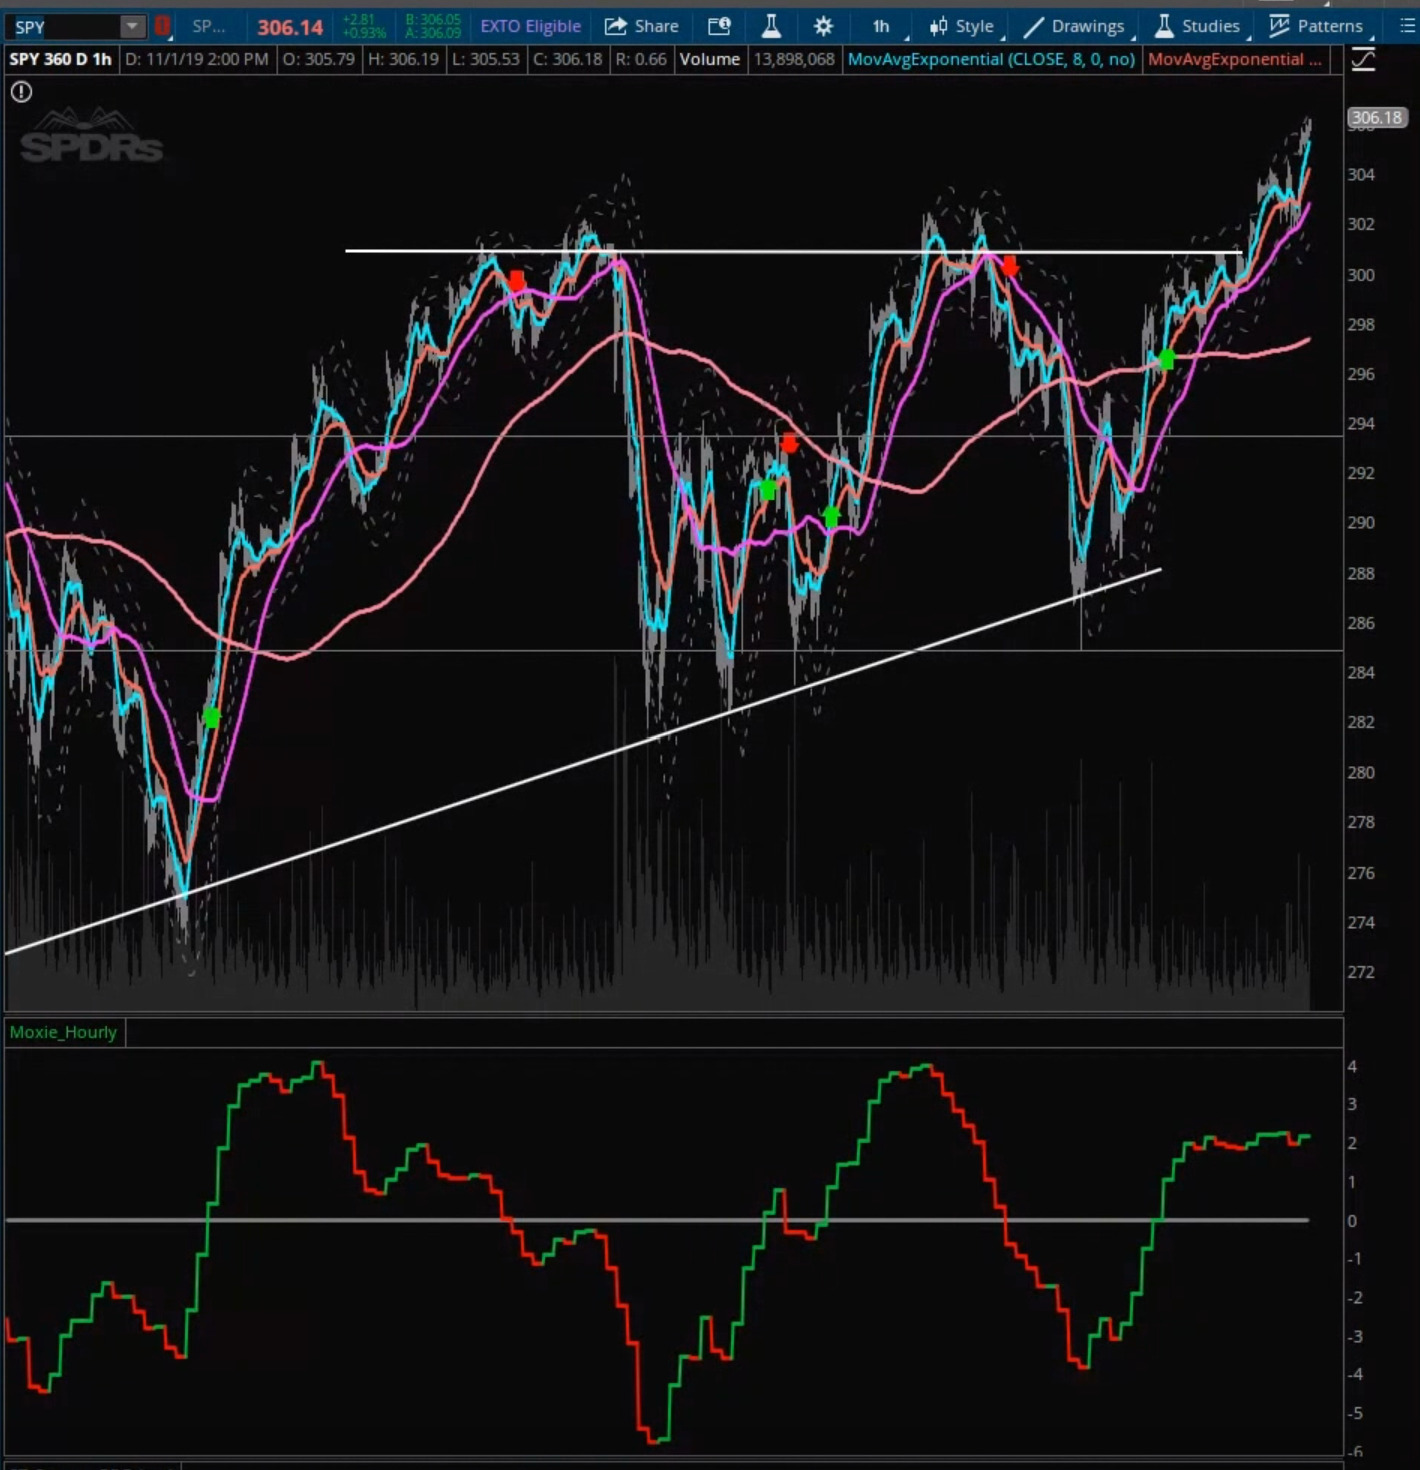
Please post pictures in order to get the same look into PRT.
Here you go. Thanks Nicolas
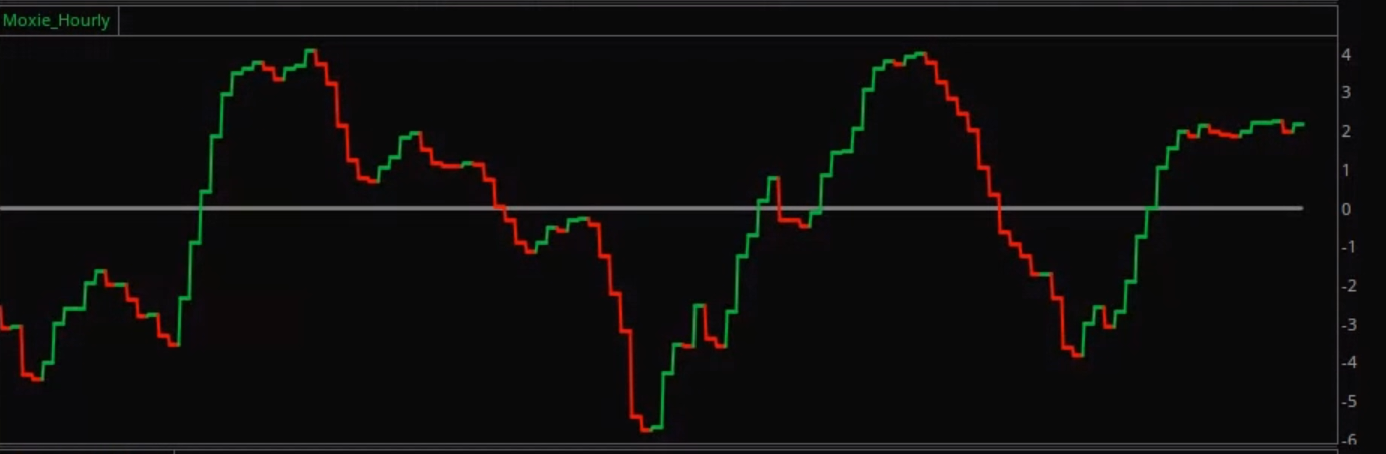
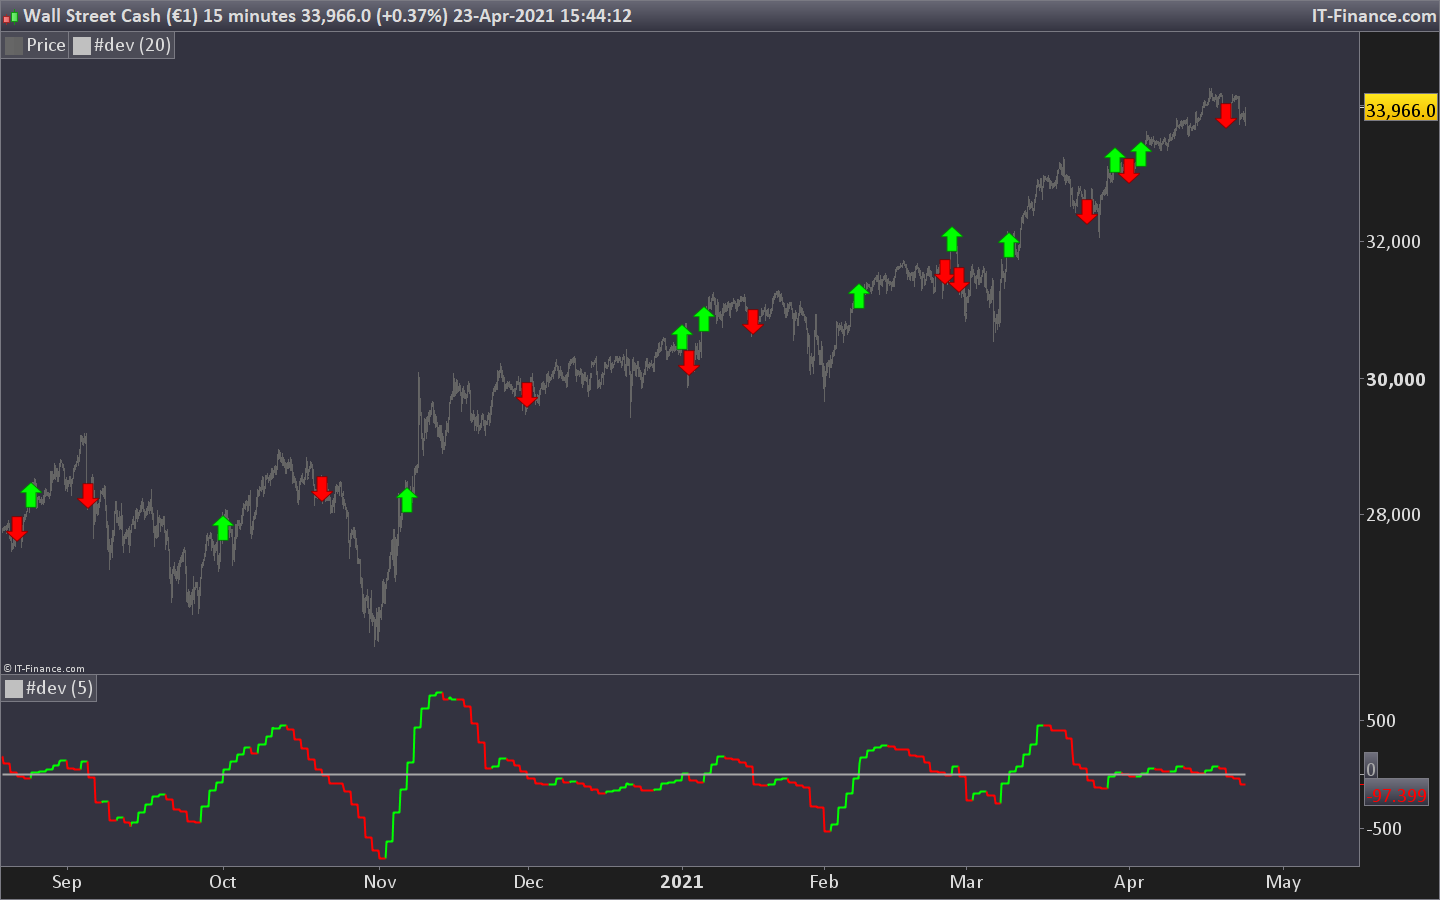
Here is the translated code of Moxie indicator. Apply it twice, on the price chart in order to see the arrows of the trading signals and separated as an oscillator. Lot of useless code have been wiped out. This indicator seems to be a daily normalized MACD.
//# ST_Moxie_Hourly Indicator

s5v = 12

s5r = 26
s5g = 9

timeframe(daily,updateonclose)
vc1 = ExponentialAverage[s5v](close) - ExponentialAverage[s5r](close)
m2 = Abs((close - Lowest[s5r](low)) - (Highest[s5g](high) - close)) / (Highest[s5g](high) - Lowest[s5g](low))
va1 = ExponentialAverage[s5g](vc1)
Moxie = (vc1 - va1) * 3

l1 = Moxie < Moxie[1]
h1 = Moxie > Moxie[1]
//sig =
if l1 then
r=255
g=0
elsif h1 then
r=0
g=255
endif
timeframe(default)
if moxie crosses over 0 then
drawarrowup(barindex,low) coloured(r,g,0)
elsif moxie crosses under 0 then
drawarrowdown(barindex,high) coloured(r,g,0)
endif

return Moxie coloured(r,g,0) style(line,2),0 coloured(168,168,168) style(line,2)
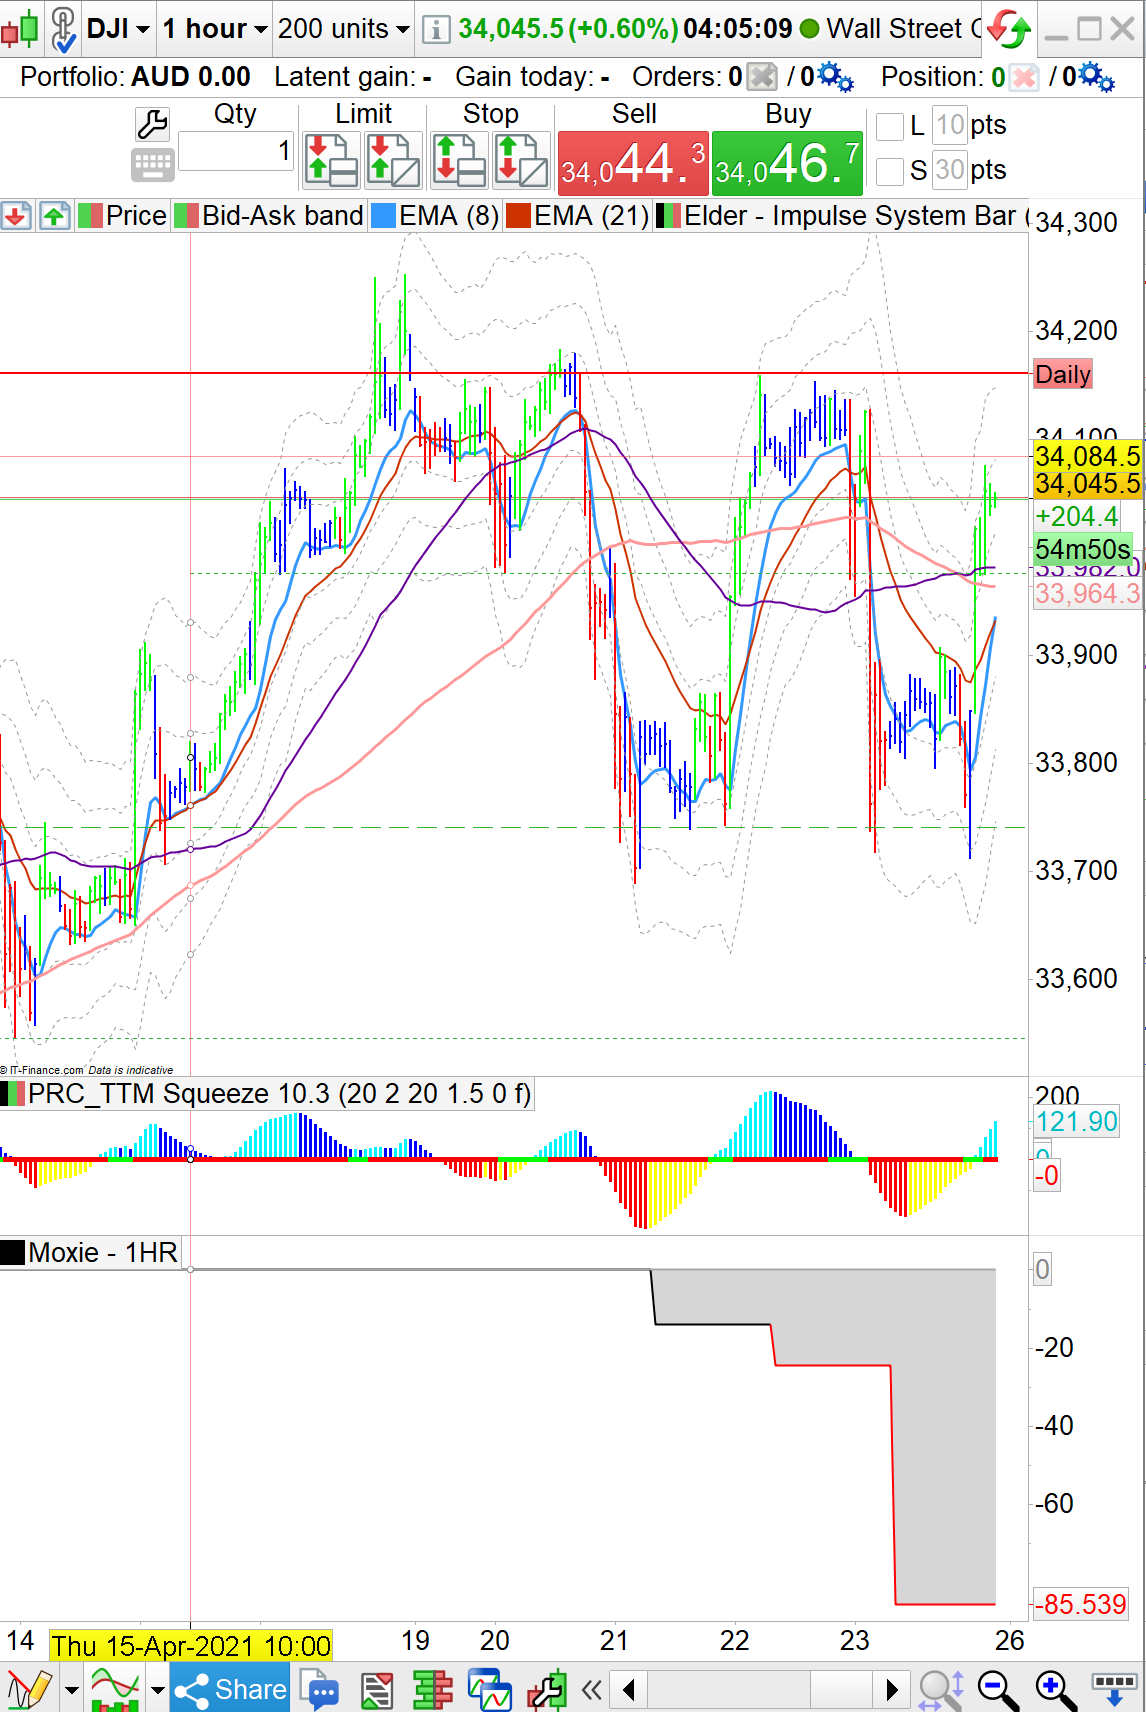
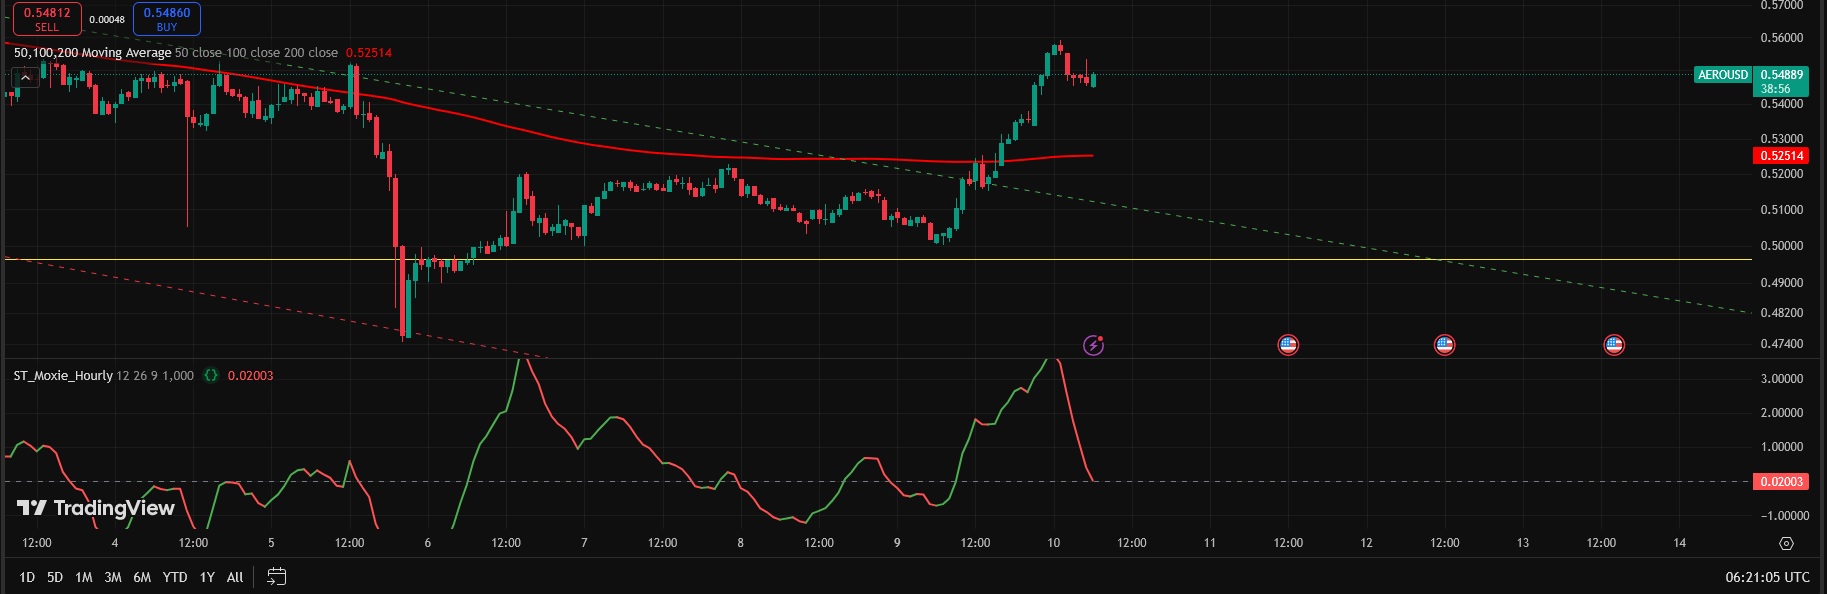
The signal and indicator don’t show up on my 1 hr chart
Apply it twice, on the price chart in order to see the arrows of the trading signals and separated as an oscillator.
Just follow the instruction ^^ 🙄
Hi Nicolas,
I have tried to use this code for Trading View. Do I require any ammendments in order for it to work?
Currently get this error
The Pine version of this script is unspecified, so it will compile as Pine v1. To use another version of Pine, add ‘//@version={versionNumber}’ to the top of the script. E.g., ‘//@version=5’ for Pine v5.
ps – I am no coder
update: used chatgpt
gave me this code
//@version=5
indicator(“ST_Moxie_Hourly”, overlay=false)
// === Input Parameters ===
s5v = input.int(12, “Short EMA”, minval=1)
s5r = input.int(26, “Long EMA”, minval=1)
s5g = input.int(9, “Signal EMA”, minval=1)
scaleFactor = input.int(1000, “Visual Scale”, minval=1) // Adjust for asset
// === Moxie Calculations ===
vc1 = ta.ema(close, s5v) – ta.ema(close, s5r)
va1 = ta.ema(vc1, s5g)
moxieRaw = vc1 – va1
moxie = moxieRaw * scaleFactor
// === Color Based on Trend Direction ===
isUp = moxie > moxie[1]
isDown = moxie < moxie[1]
moxieColor = isUp ? color.green : isDown ? color.red : color.gray
// === Line Plot ===
plot(moxie, title=”Moxie Line”, style=plot.style_line, color=moxieColor, linewidth=2)
// === Reference Line ===
hline(0, “Zero Line”, color=color.gray, linewidth=1)
It doesnt look like the original, unsure why. However do you think this is okay? Not got the arrows on the graph and I see you say paste it twice but that does not work and creates an error.
Also, can this code be used for any time frame or just the one hour? Do I need to make ammendemnets to it so I can switch between time frames and the data is still correct? cheers
Hello @jamjamjam,
Conversion of codes from Tradingview or another platform towards ProRealTime language would be free on the forums of this ProRealCode website dedicated to ProRealTime. But conversion of a ProRealTime code into a language compatible with tradingview would be a paid-for private job rather than a forum free discussion, for which you may ask for a quote in the “trading programming services” section of the PRC website, available in the help menu at the top of current page. Direct link:
Trading Programming Services