In another ProOrder discussion Nicolas pointed out this indicator in the library that I hadn’t spotted before:
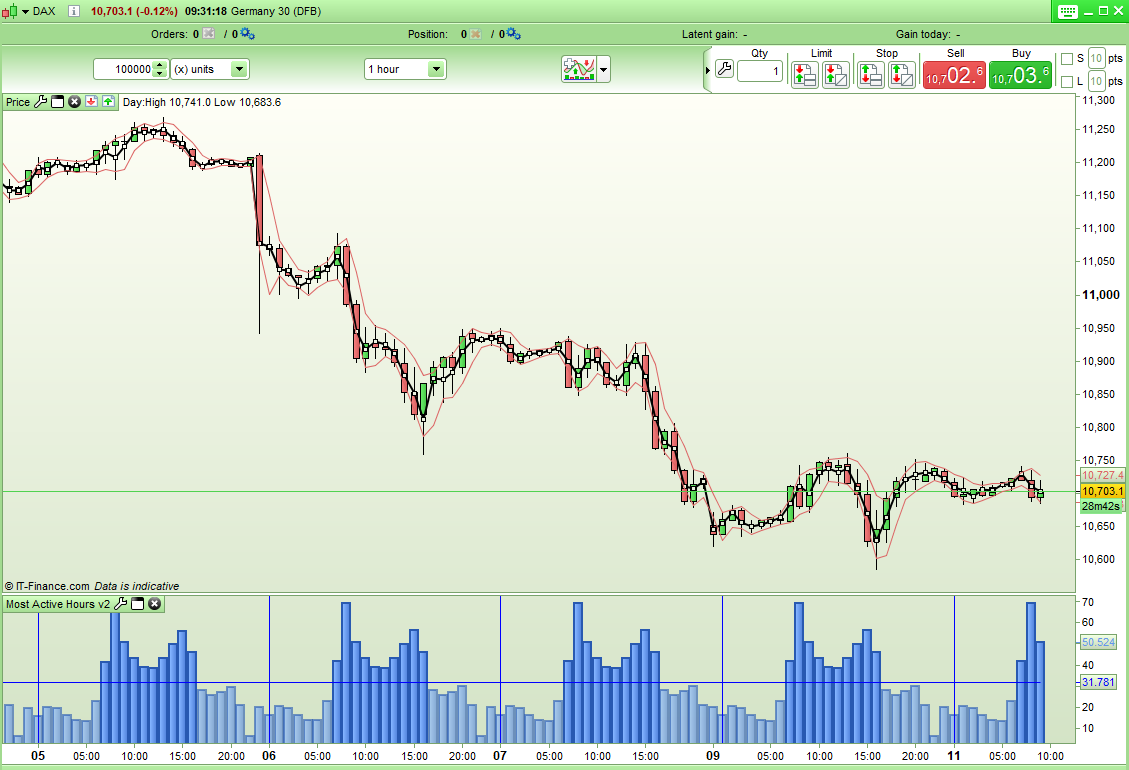
Most active hours of trading indicator
I thought that the output could be more easy to read graphically so I re-wrote it a little.
Now each hour is displayed under the hour it represents and an all time average is calculated and any hour above this average is highlighted with a darker colour.
I can post it in the library if Nicolas thinks that it is a worthwhile update on the original code.
Thanks to throwaway200 for the original idea.
[attachment file=86781]
//Most Active Hours v2
//By Vonasi (thanks to throwaway200 for the idea)
//20181211

//defparam calculateonlastbars = 1000

IF openhour = 0 THEN
H0 = (H0 + (High - Low))
H0Count = (H0Count + 1)
ThisHour = (H0 / H0Count)
drawvline(barindex) coloured(0,0,255)
ELSIF openhour = 1 THEN
H1 = (H1 + (High - Low))
H1Count = (H1Count + 1)
ThisHour = (H1 / H1Count)
ELSIF openhour = 2 THEN
H2 = (H2 + (High - Low))
H2Count = (H2Count + 1)
ThisHour = (H2 / H2Count)
ELSIF openhour = 3 THEN
H3 = (H3 + (High - Low))
H3Count = (H3Count + 1)
ThisHour = (H3 / H3Count)
ELSIF openhour = 4 THEN
H4 = (H4 + (High - Low))
H4Count = (H4Count + 1)
ThisHour = (H4 / H4Count)
ELSIF openhour = 5 THEN
H5 = (H5 + (High - Low))
H5Count = (H5Count + 1)
ThisHour = (H5 / H5Count)
ELSIF openhour = 6 THEN
H6 = (H6 + (High - Low))
H6Count = (H6Count + 1)
ThisHour = (H6 / H6Count)
ELSIF openhour = 7 THEN
H7 = (H7 + (High - Low))
H7Count = (H7Count + 1)
ThisHour = (H7 / H7Count)
ELSIF openhour = 8 THEN
H8 = (H8 + (High - Low))
H8Count = (H8Count + 1)
ThisHour = (H8 / H8Count)
ELSIF openhour = 9 THEN
H9 = (H9 + (High - Low))
H9Count = (H9Count + 1)
ThisHour = (H9 / H9Count)
ELSIF openhour = 10 THEN
H10 = (H10 + (High - Low))
H10Count = (H10Count + 1)
ThisHour = (H10 / H10Count)
ELSIF openhour = 11 THEN
H11 = (H11 + (High - Low))
H11Count = (H11Count + 1)
ThisHour = (H11 / H11Count)
ELSIF openhour = 12 THEN
H12 = (H12 + (High - Low))
H12Count = (H12Count + 1)
ThisHour = (H12 / H12Count)
ELSIF openhour = 13 THEN
H13 = (H13 + (High - Low))
H13Count = (H13Count + 1)
ThisHour = (H13 / H13Count)
ELSIF openhour = 14 THEN
H14 = (H14 + (High - Low))
H14Count = (H14Count + 1)
ThisHour = (H14 / H14Count)
ELSIF openhour = 15 THEN
H15 = (H15 + (High - Low))
H15Count = (H15Count + 1)
ThisHour = (H15 / H15Count)
ELSIF openhour = 16 THEN
H16 = (H16 + (High - Low))
H16Count = (H16Count + 1)
ThisHour = (H16 / H16Count)
ELSIF openhour = 17 THEN
H17 = (H17 + (High - Low))
H17Count = (H17Count + 1)
ThisHour = (H17 / H17Count)
ELSIF openhour = 18 THEN
H18 = (H18 + (High - Low))
H18Count = (H18Count + 1)
ThisHour = (H18 / H18Count)
ELSIF openhour = 19 THEN
H19 = (H19 + (High - Low))
H19Count = (H19Count + 1)
ThisHour = (H19 / H19Count)
ELSIF openhour = 20 THEN
H20 = (H20 + (High - Low))
H20Count = (H20Count + 1)
ThisHour = (H20 / H20Count)
ELSIF openhour = 21 THEN
H21 = (H21 + (High - Low))
H21Count = (H21Count + 1)
ThisHour = (H21 / H21Count)
ELSIF openhour = 22 THEN
H22 = (H22 + (High - Low))
H22Count = (H22Count + 1)
ThisHour = (H22 / H22Count)
ELSIF openhour = 23 THEN
H23 = (H23 + (High - Low))
H23Count = (H23Count + 1)
ThisHour = (H23 / H23Count)
ENDIF

avg = (h0 + h1 + h2 + h3 + h4 + h5 + h6 + h7 + h8 + h9 + h10 + h11 + h12 + h13 + h14 + h15 + h16 + h17 + h18 + h19 + h20 + h21 + h22 + h23)/(h0count + h1count + h2count + h3count + h4count + h5count + h6count + h7count + h8count + h9count + h10count + h11count + h12count + h13count + h14count + h15count + h16count + h17count + h18count + h19count + h20count + h21count + h22count + h23count)

c = 155
if ThisHour > Avg then
c = 255
endif

RETURN thishour coloured (100,149,237,c) style(histogram, 2) as "Average Range", avg coloured(0,0,255) style(line,1) as "All Time Average"
Yes, that will be a good addition to the library, please do share it there, thanks.
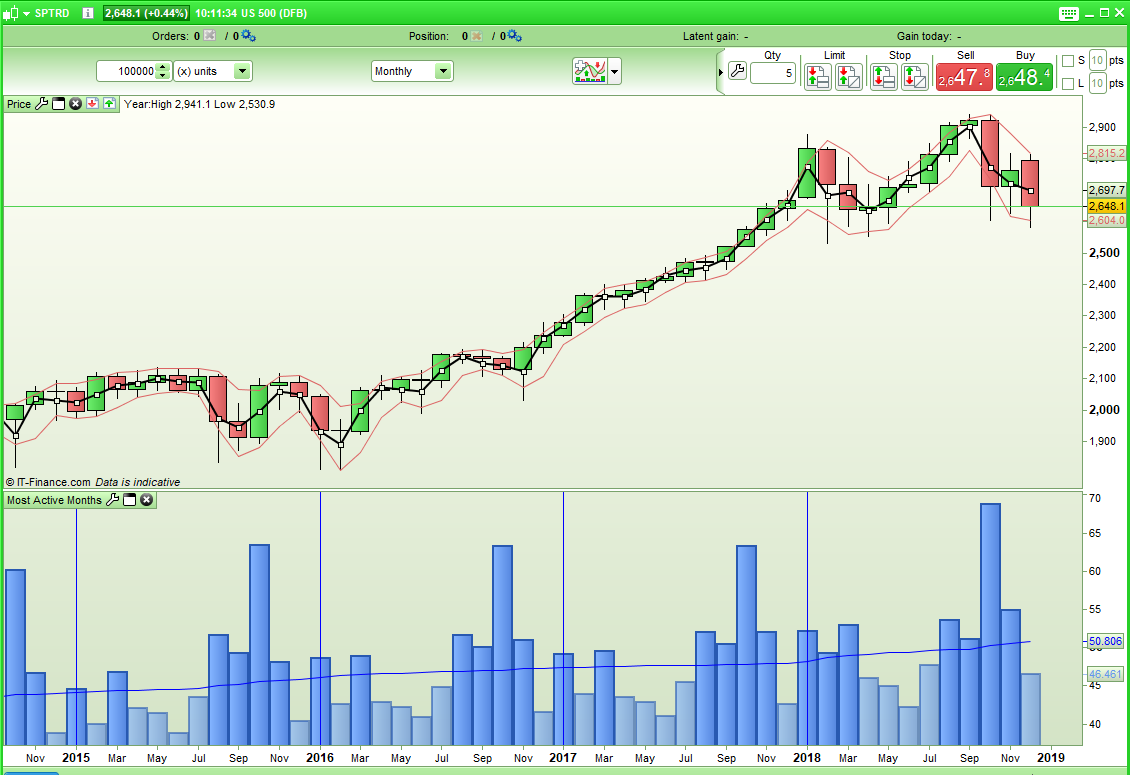
I have also converted it to check for the most active months just for interest.
I will submit both versions to the library as one indicator.
[attachment file=86799]
An interesting alternative is to based the indicator on hourly volume rather than hourly range. Potentially trading in only high volume hours and with take profit and stop loss values adjusted each hour based on the historical range from the first indicator. This might be a nice trading idea to test out rather than basing the levels on average true range – which will be taking into account out of hours, low volume, low range candles for their calculations – so the ATR will be lower than truly can be expected during the best trading hours. I feel another indicator coming on…..!
Here’s the adjusted code for the hourly chart:
//Most Active Hours Volume
//By Vonasi (thanks to throwaway200 for the idea)
//20181211

//defparam calculateonlastbars = 1000

IF openhour = 0 THEN
H0 = (H0 + volume)
H0Count = (H0Count + 1)
ThisHour = (H0 / H0Count)
drawvline(barindex) coloured(0,0,255)
ELSIF openhour = 1 THEN
H1 = (H1 + volume)
H1Count = (H1Count + 1)
ThisHour = (H1 / H1Count)
ELSIF openhour = 2 THEN
H2 = (H2 + volume)
H2Count = (H2Count + 1)
ThisHour = (H2 / H2Count)
ELSIF openhour = 3 THEN
H3 = (H3 + volume)
H3Count = (H3Count + 1)
ThisHour = (H3 / H3Count)
ELSIF openhour = 4 THEN
H4 = (H4 + volume)
H4Count = (H4Count + 1)
ThisHour = (H4 / H4Count)
ELSIF openhour = 5 THEN
H5 = (H5 + volume)
H5Count = (H5Count + 1)
ThisHour = (H5 / H5Count)
ELSIF openhour = 6 THEN
H6 = (H6 + volume)
H6Count = (H6Count + 1)
ThisHour = (H6 / H6Count)
ELSIF openhour = 7 THEN
H7 = (H7 + volume)
H7Count = (H7Count + 1)
ThisHour = (H7 / H7Count)
ELSIF openhour = 8 THEN
H8 = (H8 + volume)
H8Count = (H8Count + 1)
ThisHour = (H8 / H8Count)
ELSIF openhour = 9 THEN
H9 = (H9 + volume)
H9Count = (H9Count + 1)
ThisHour = (H9 / H9Count)
ELSIF openhour = 10 THEN
H10 = (H10 + volume)
H10Count = (H10Count + 1)
ThisHour = (H10 / H10Count)
ELSIF openhour = 11 THEN
H11 = (H11 + volume)
H11Count = (H11Count + 1)
ThisHour = (H11 / H11Count)
ELSIF openhour = 12 THEN
H12 = (H12 + volume)
H12Count = (H12Count + 1)
ThisHour = (H12 / H12Count)
ELSIF openhour = 13 THEN
H13 = (H13 + volume)
H13Count = (H13Count + 1)
ThisHour = (H13 / H13Count)
ELSIF openhour = 14 THEN
H14 = (H14 + volume)
H14Count = (H14Count + 1)
ThisHour = (H14 / H14Count)
ELSIF openhour = 15 THEN
H15 = (H15 + volume)
H15Count = (H15Count + 1)
ThisHour = (H15 / H15Count)
ELSIF openhour = 16 THEN
H16 = (H16 + volume)
H16Count = (H16Count + 1)
ThisHour = (H16 / H16Count)
ELSIF openhour = 17 THEN
H17 = (H17 + volume)
H17Count = (H17Count + 1)
ThisHour = (H17 / H17Count)
ELSIF openhour = 18 THEN
H18 = (H18 + volume)
H18Count = (H18Count + 1)
ThisHour = (H18 / H18Count)
ELSIF openhour = 19 THEN
H19 = (H19 + volume)
H19Count = (H19Count + 1)
ThisHour = (H19 / H19Count)
ELSIF openhour = 20 THEN
H20 = (H20 + volume)
H20Count = (H20Count + 1)
ThisHour = (H20 / H20Count)
ELSIF openhour = 21 THEN
H21 = (H21 + volume)
H21Count = (H21Count + 1)
ThisHour = (H21 / H21Count)
ELSIF openhour = 22 THEN
H22 = (H22 + volume)
H22Count = (H22Count + 1)
ThisHour = (H22 / H22Count)
ELSIF openhour = 23 THEN
H23 = (H23 + volume)
H23Count = (H23Count + 1)
ThisHour = (H23 / H23Count)
ENDIF

avg = (h0 + h1 + h2 + h3 + h4 + h5 + h6 + h7 + h8 + h9 + h10 + h11 + h12 + h13 + h14 + h15 + h16 + h17 + h18 + h19 + h20 + h21 + h22 + h23)/(h0count + h1count + h2count + h3count + h4count + h5count + h6count + h7count + h8count + h9count + h10count + h11count + h12count + h13count + h14count + h15count + h16count + h17count + h18count + h19count + h20count + h21count + h22count + h23count)

c = 155
if ThisHour > Avg then
c = 255
endif

RETURN thishour coloured (100,149,237,c) style(histogram, 2) as "Average Volume", avg coloured(0,0,255) style(line,1) as "All Time Average"
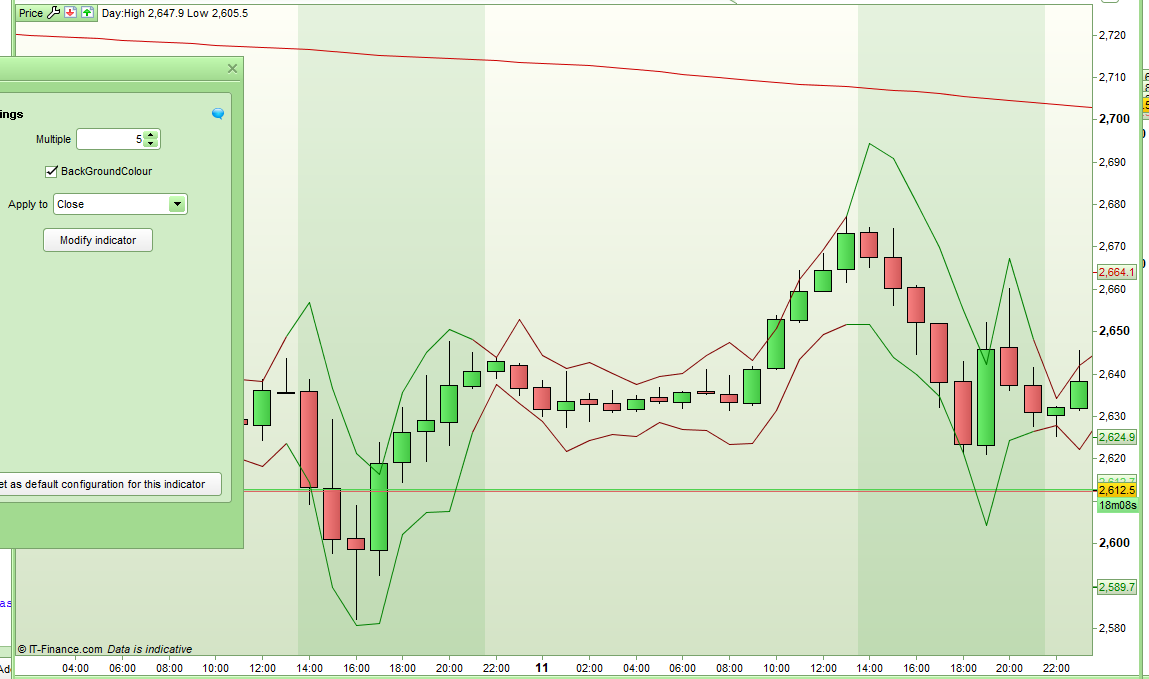
So here is my first attempt at something to make ATR more useful. I call it HODATR Bands which stands for Hour Of Day Average True Range.
It calculates the all time average range for every hour and the all time average volume for every hour. It then uses that HODATR to draw bands on each hourly candle. So it can be seen that during non high volume hours the bands are much closer and during high volume hours they are further apart. I have also added the options to expand the bands further out with a multiplier and also to be able to turn on or off colour highlighting for when the high volume best hours to trade are. The bands on each hour can be centred around any custom close from the previous hour so on closing price, median price etc.
At the moment it can only be used on hourly charts.
Any thoughts or ideas are welcome.
…and yes I know it should technically be called HODAR as the range calculation is not at all like an ATR calculation but I couldn’t be bothered to change it after I realised.
[attachment file=87134]
[attachment file=”HODATR Bands.itf”]
//HODATR bands
//By Vonasi
//20181214

// BackGroundColour = 1
//Multiple = 1

IF openhour = 0 THEN
H0 = (H0 + (High - Low))
H0Count = (H0Count + 1)
ThisHour = (H0 / H0Count)
V0 = (V0 + volume)
V0Count = (V0Count + 1)
ThisHourVol = (V0 / V0Count)
ELSIF openhour = 1 THEN
H1 = (H1 + (High - Low))
H1Count = (H1Count + 1)
ThisHour = (H1 / H1Count)
V1 = (V1 + volume)
V1Count = (V1Count + 1)
ThisHourVol = (V1 / V1Count)
ELSIF openhour = 2 THEN
H2 = (H2 + (High - Low))
H2Count = (H2Count + 1)
ThisHour = (H2 / H2Count)
V2 = (V2 + volume)
V2Count = (V2Count + 1)
ThisHourVol = (V2 / V2Count)
ELSIF openhour = 3 THEN
H3 = (H3 + (High - Low))
H3Count = (H3Count + 1)
ThisHour = (H3 / H3Count)
V3 = (V3 + volume)
V3Count = (V3Count + 1)
ThisHourVol = (V3 / V3Count)
ELSIF openhour = 4 THEN
H4 = (H4 + (High - Low))
H4Count = (H4Count + 1)
ThisHour = (H4 / H4Count)
V4 = (V4 + volume)
V4Count = (V4Count + 1)
ThisHourVol = (V4 / V4Count)
ELSIF openhour = 5 THEN
H5 = (H5 + (High - Low))
H5Count = (H5Count + 1)
ThisHour = (H5 / H5Count)
V5 = (V5 + volume)
V5Count = (V5Count + 1)
ThisHourVol = (V5 / V5Count)
ELSIF openhour = 6 THEN
H6 = (H6 + (High - Low))
H6Count = (H6Count + 1)
ThisHour = (H6 / H6Count)
V6 = (V6 + volume)
V6Count = (V6Count + 1)
ThisHourVol = (V6 / V6Count)
ELSIF openhour = 7 THEN
H7 = (H7 + (High - Low))
H7Count = (H7Count + 1)
ThisHour = (H7 / H7Count)
V7 = (V7 + volume)
V7Count = (V7Count + 1)
ThisHourVol = (V7 / V7Count)
ELSIF openhour = 8 THEN
H8 = (H8 + (High - Low))
H8Count = (H8Count + 1)
ThisHour = (H8 / H8Count)
V8 = (V8 + volume)
V8Count = (V8Count + 1)
ThisHourVol = (V8 / V8Count)
ELSIF openhour = 9 THEN
H9 = (H9 + (High - Low))
H9Count = (H9Count + 1)
ThisHour = (H9 / H9Count)
V9 = (V9 + volume)
V9Count = (V9Count + 1)
ThisHourVol = (V9 / V9Count)
ELSIF openhour = 10 THEN
H10 = (H10 + (High - Low))
H10Count = (H10Count + 1)
ThisHour = (H10 / H10Count)
V10 = (V10 + volume)
V10Count = (V10Count + 1)
ThisHourVol = (V10 / V10Count)
ELSIF openhour = 11 THEN
H11 = (H11 + (High - Low))
H11Count = (H11Count + 1)
ThisHour = (H11 / H11Count)
V11 = (V11 + volume)
V11Count = (V11Count + 1)
ThisHourVol = (V11 / V11Count)
ELSIF openhour = 12 THEN
H12 = (H12 + (High - Low))
H12Count = (H12Count + 1)
ThisHour = (H12 / H12Count)
V12 = (V12 + volume)
V12Count = (V12Count + 1)
ThisHourVol = (V12 / V12Count)
ELSIF openhour = 13 THEN
H13 = (H13 + (High - Low))
H13Count = (H13Count + 1)
ThisHour = (H13 / H13Count)
V13 = (V13 + volume)
V13Count = (V13Count + 1)
ThisHourVol = (V13 / V13Count)
ELSIF openhour = 14 THEN
H14 = (H14 + (High - Low))
H14Count = (H14Count + 1)
ThisHour = (H14 / H14Count)
V14 = (V14 + volume)
V14Count = (V14Count + 1)
ThisHourVol = (V14 / V14Count)
ELSIF openhour = 15 THEN
H15 = (H15 + (High - Low))
H15Count = (H15Count + 1)
ThisHour = (H15 / H15Count)
V15 = (V15 + volume)
V15Count = (V15Count + 1)
ThisHourVol = (V15 / V15Count)
ELSIF openhour = 16 THEN
H16 = (H16 + (High - Low))
H16Count = (H16Count + 1)
ThisHour = (H16 / H16Count)
V16 = (V16 + volume)
V16Count = (V16Count + 1)
ThisHourVol = (V16 / V16Count)
ELSIF openhour = 17 THEN
H17 = (H17 + (High - Low))
H17Count = (H17Count + 1)
ThisHour = (H17 / H17Count)
V17 = (V17 + volume)
V17Count = (V17Count + 1)
ThisHourVol = (V17 / V17Count)
ELSIF openhour = 18 THEN
H18 = (H18 + (High - Low))
H18Count = (H18Count + 1)
ThisHour = (H18 / H18Count)
V18 = (V18 + volume)
V18Count = (V18Count + 1)
ThisHourVol = (V18 / V18Count)
ELSIF openhour = 19 THEN
H19 = (H19 + (High - Low))
H19Count = (H19Count + 1)
ThisHour = (H19 / H19Count)
V19 = (V19 + volume)
V19Count = (V19Count + 1)
ThisHourVol = (V19 / V19Count)
ELSIF openhour = 20 THEN
H20 = (H20 + (High - Low))
H20Count = (H20Count + 1)
ThisHour = (H20 / H20Count)
V20 = (V20 + volume)
V20Count = (V20Count + 1)
ThisHourVol = (V20 / V20Count)
ELSIF openhour = 21 THEN
H21 = (H21 + (High - Low))
H21Count = (H21Count + 1)
ThisHour = (H21 / H21Count)
V21 = (V21 + volume)
V21Count = (V21Count + 1)
ThisHourVol = (V21 / V21Count)
ELSIF openhour = 22 THEN
H22 = (H22 + (High - Low))
H22Count = (H22Count + 1)
ThisHour = (H22 / H22Count)
V22 = (V22 + volume)
V22Count = (V22Count + 1)
ThisHourVol = (V22 / V22Count)
ELSIF openhour = 23 THEN
H23 = (H23 + (High - Low))
H23Count = (H23Count + 1)
ThisHour = (H23 / H23Count)
V23 = (V23 + volume)
V23Count = (V23Count + 1)
ThisHourVol = (V23 / V23Count)
ENDIF

VolAvg = (V0 + V1 + V2 + V3 + V4 + V5 + V6 + V7 + V8 + V9 + V10 + V11 + V12 + V13 + V14 + V15 + V16 + V17 + V18 + V19 + V20 + V21 + V22 + V23)/(V0count + V1count + V2count + V3count + V4count + V5count + V6count + V7count + V8count + V9count + V10count + V11count + V12count + V13count + V14count + V15count + V16count + V17count + V18count + V19count + V20count + V21count + V22count + V23count)

upper = customclose[1] + ((ThisHour/2) * multiple)
lower = customclose[1] - ((ThisHour/2) * multiple)

r = 128
g = 0
b = 0
c = 0

if ThisHourVol > VolAvg then
r = 0
g = 128
b = 0
c = 25
endif

if backgroundcolour then
backgroundcolor (r,g,b,c)
else
if not backgroundcolour then
r = 100
g = 149
b = 237
endif
endif

RETURN upper coloured (r,g,b) style(line, 1) as "Upper HODATR Band", lower coloured (r,g,b) style(line, 1) as "Lower HODATR Band"