I thought I would share this bit of code. You can add it to the bottom of any strategy that trades on an index and it will calculate a equity curve that takes into account any overnight fees so that our analysis of a strategies actual profit is a little more accurate,
There are some limitations as the Libor rate used in the calculation of overnight fees changes and we can only use a fixed value – but we have to work with the cards that we are dealt.
Everything is explained in the code but you will need to change some of the values depending on the time frame of the chart being used. It does not work on time frames slower than weekly.
Hopefully someone will find it useful.
//Indices Strategy Profit Minus Overnight Fees Calculator
//By Vonasi
//26 July 2018

//Use on Indices only
//Add the code to the bottom of your strategy.
//If using on intraday charts then you will need to adjust the time used in line 23 to match the open time of the last candle of the day on your chart on Friday afternoon.
//If using on intraday charts then there must be a candle at 220000.
//It does not work on time frames slower than weekly.

Capital = 10000 //Initial starting capital
PositionSize = 1 //Stake size
BrokerFee = 2.5 //Brokers fee in % for overnight calculation.
Libor = 0.4728 // The current Libor overnight rate in %
DaysInBar = 1 // Daily or faster time frame = 1 Weekly time frame = 7
IntraDay = 1 // Daily or Weekly chart = 0 Faster than daily chart = 1

Equity = Capital + StrategyProfit
LongFee = Round(((PositionSize * close) * (((BrokerFee/100) + (Libor/100))/365))*100)/100

If IntraDay and OnMarket and time = 220000 then
Cost = Cost + (countofposition * (LongFee * DaysInbar))
endif

If IntraDay and OnMarket and opentime = 230000 and opendayofweek = 5 then //Change time to open time of last candle of the day on Friday
Cost = Cost + ((countofposition * (LongFee * DaysInbar)) * 2)
endif

If not IntraDay and OnMarket then
Cost = Cost + (countofposition * (LongFee * DaysInbar))
ENDIF

Profits = Equity - Cost
Graph Profits
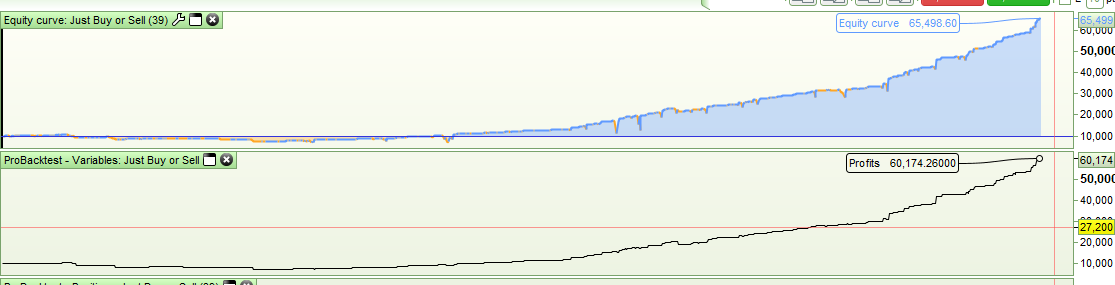
Here is an example of it used on a weekly strategy. It can be seen that the standard equity curve is showing a strategy balance of £65499 and the adjusted for fees curve is showing £60174 balance so over the years we have paid £5325 in overnight fees (had the Libor rate and brokers fees and spread stayed level).
[attachment file=76773]
Please note that I have not tested it on intraday strategies very much as I don’t really trade them any more. If you find a problem please point it out.
I’m surprised that not even GraHal has been along and hoovered this up for the Snippet Library?
I had some time to test out the above code and realised that it is full of errors and a total pile of poop! Ignore the above code and try this new one that should work properly:
//Indices Strategy Profit Minus Overnight Fees Calculator v2
//By Vonasi
//29 July 2018

//Use on Indices only
//Add the code to the bottom of your strategy.
//If using on intraday charts then you will need to adjust the time used in line 23 to match the open time of the last candle of the day on your chart on Friday afternoon.
//If using on intraday charts then there must be a candle at 220000.

Capital = 10000 //Initial starting capital
BrokerFee = 2.5 //Brokers fee in % for overnight calculation.
Libor = 0.4728 // The current Libor overnight rate in %
DaysInBar = 1 // Daily or lower timeframe=1 Weekly timeframe=7
IntraDay = 1 // Weekly chart=0 Daily=1 Faster than daily=2

Equity = Capital + StrategyProfit
LongFee = Round(((CountofPosition * close) * (((BrokerFee/100) + (Libor/100))/365))*100)/100

If IntraDay = 2 and OnMarket and time = 220000 then
Cost = Cost + (LongFee * DaysInbar)
endif

If IntraDay = 2 and OnMarket and opentime = 230000 and opendayofweek = 5 then //Change time to open time of last candle of the day on Friday
Cost = Cost +((LongFee * DaysInbar) * 2)
endif

If (IntraDay = 0 or IntraDay = 1) and OnMarket then
Cost = Cost + (LongFee * DaysInbar)
ENDIF

If IntraDay = 1 and OnMarket and opendayofweek = 5 then
Cost = Cost + (LongFee * DaysInbar)
ENDIF

Profits = Equity - Cost
Graph Profits
Hi Vonasi,
just a quick question. For line 17 above – should it be (as below) to factor in pip value/pip size?
LongFee = Round(((CountofPosition*pipsize*pipvalue * close) * (((BrokerFee/100) + (Libor/100))/365))*100)/100
Thanks for the code to copy/play with.
Cheers
Finning.
Very possibly but my understanding of the use of PIPVALUE and PIPSIZE is very limited so I am probably not the best person to answer this question. I spread bet with IG and have never found the need to use either instruction in any of my strategies and they have always worked just fine. I know that Roberto uses it a lot so maybe he can be more helpful on this subject.
Hi Vonasi,
no worries I’ll keep this in mind to check if I migrate to different instruments.
Cheers,
Finning
No, Countofposition is the number of shares traded and has nothing to do with Pip calculations.
CLOSE might be used sometimes for this kind of conversion, not in this case, though.
Moreover you used twice the conversion, which would yield erroneous results.
PIPVALUE (or PIPSIZE) must be used to convert a number of pips to price by multiplying it by that number, while converting a price into pips requires division.
PipsGained = (Tradeprice - close) / pipsise //Price —-> Pips
StopLoss   = tradeprice - (20 * pipsize)    //Pips  —-> Price
Hi Roberto,
I was looking at the same instrument with different contract values (e.g. – and index with $1 or $25 per point), and I wasn’t sure if it was accounted for in the initial formula above.
I was trying to define pipsize = 1.0 pip/point (an index) and pipvalue = $1.0 per pip/point (a mini contract).
Just thought you needed a total trade value to apply the fee % to.
Was looking at this for indexes – https://www.ig.com/au/help-and-support/cfds/fees-and-charges/why-is-overnight-funding-charged-and-how-is-it-calculated-

And I thought that the Trade size was (number of pips x pip size x value of pips) x (close) x (interest rates/365).
Cheers,
Finning
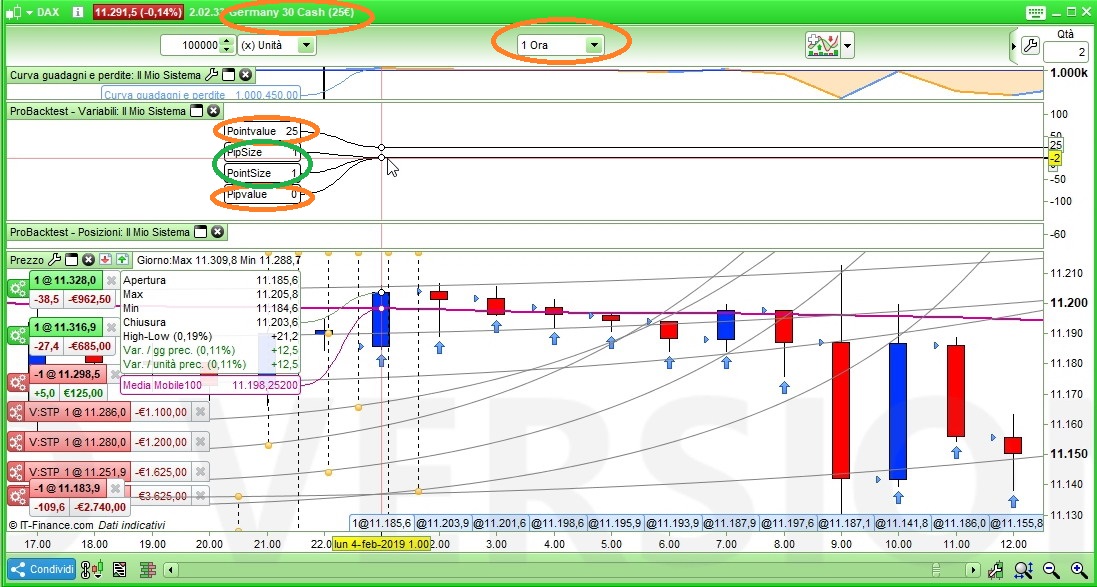
Sorry for some confusion on my side, PIPSIZE and POINTSIZE are equivalent and refer to the size of 1 pip (usually 1/10000th for FX pairs), while PIPVALUE and POINTVALUE should be equivalent and refer to the value of each pip, but as you can see from my pic (Dax, h1) this is not always true, so it seems that POINTVALUE is the recommended keyword to use.
So there was no double multiplication.
Still CLOSE has to be divided by PipSize to get the correct number of pips, then you correctly multiply that by PointValue and CountOfPosition to get the total value p/Pip of your positions (contracts or shares). The correct formula you posted should read:
LongFee = Round(((CountofPosition * ((close / pipsize) * pointvalue)) * (((BrokerFee/100) + (Libor/100))/365))*100)/100
(close / pipsize) = converts price into Pips
(Pips * pointvalue) = value of 1 position
(Value of 1 position * CountofPosition) = value of all positions
Thank you Roberto – I was nearly there.
That will be a big help when I’m switching between instruments.
Cheers,
Brett