Based on the idea here explained https://www.prorealcode.com/prorealtime-indicators/forex-entry-point-indicator-no-repaint/
Tested it on 15min timeframe from Aug.2019 till now (that’s the maximum that IGPRT allows to me) on different forex pairs. Here’s the best results of gain/loss ratio:
AUDCAD 1.11
AUDCHF 1.16
AUDEUR 1.37
AUDNZD 1.32
EURAUD 1.43
EURCAD 1.17
EURCHF 1.43
EURUSD 1.95
GBPJPY 1.19
GBPNOK 1.29
NZDCHF 1.40
NZDUSD 1.17
USDNOK 1.19
I would like to ask you if it’s possible to do major tests on previous periods, and also if you have some suggestions to optimize it.
DEFPARAM CumulateOrders = false

// Strategy Basics
ONCE PeriodK = 21
ONCE PeriodD = 12
ONCE Smoothing = 14
ONCE HighZone = 76
ONCE LowZone = 24

StochK = Stochastic[PeriodK,Smoothing](Close)
StochD = SmoothedStochastic[PeriodD,Smoothing](Close)

// Long
IF StochK<StochD AND StochK[1]>StochD[1] AND StochK<LowZone AND StochK[1]<LowZone THEN
BUY 1 CONTRACT AT MARKET
ENDIF

// Short
IF StochK>StochD AND StochK[1]<StochD[1] AND StochK>HighZone AND StochK[1]>HighZone THEN
SELLSHORT 1 CONTRACT AT MARKET
ENDIF

// Stop and target
SET STOP pLOSS 30
SET TARGET pPROFIT 80

StartBreakeven = 15 // How much pips/points in gain to activate the Breakeven function?
PointsToKeep = 5 // How much pips/points to keep in profit above of below our entry price when the Breakeven is activated (beware of spread)

// Reset the BreakevenLevel when no trade are on market
IF NOT ONMARKET THEN
BreakevenLevel=0
ENDIF

// Test if the price have moved favourably of "startBreakeven" points already
IF LONGONMARKET AND close-tradeprice(1)>=startBreakeven*pipsize THEN
//Calculate the BreakevenLevel
BreakevenLevel = tradeprice(1)+PointsToKeep*pipsize
ENDIF

// Place the new stop orders on market at BreakevenLevel
IF BreakevenLevel>0 THEN
SELL AT BreakevenLevel STOP
ENDIF

IF SHORTONMARKET AND tradeprice(1)-close>startBreakeven*pipsize THEN
//Calculate the BreakevenLevel
BreakevenLevel = tradeprice(1)-PointsToKeep*pipsize
ENDIF

//Place the new stop orders on market at BreakevenLevel
IF BreakevenLevel>0 THEN
EXITSHORT AT BreakevenLevel STOP
ENDIF
So you get those results with variables optimization? Which ones?
I didn’t used variables optimizations.
Tryied the same strategy of the code in the same way for all the pairs that i have indicated.
Ok good! But what was the spread used for each pair?
AUDEUR and EURAUD are the same instrument, so that’s not necessary to test both of them.
I didn’t try any spread on all of it, and that could bring losses on the most part of the pairs.
I only tried EURUSD (which is the most performing) with a 2 point spread and the gain/loss ratio still mantain a very good 1.41.
So probably it could be used principally for that pair; also implementing a progressive money management automated system could generate a very nice profitable strategy IMHO!
also if you have some suggestions to optimize it.
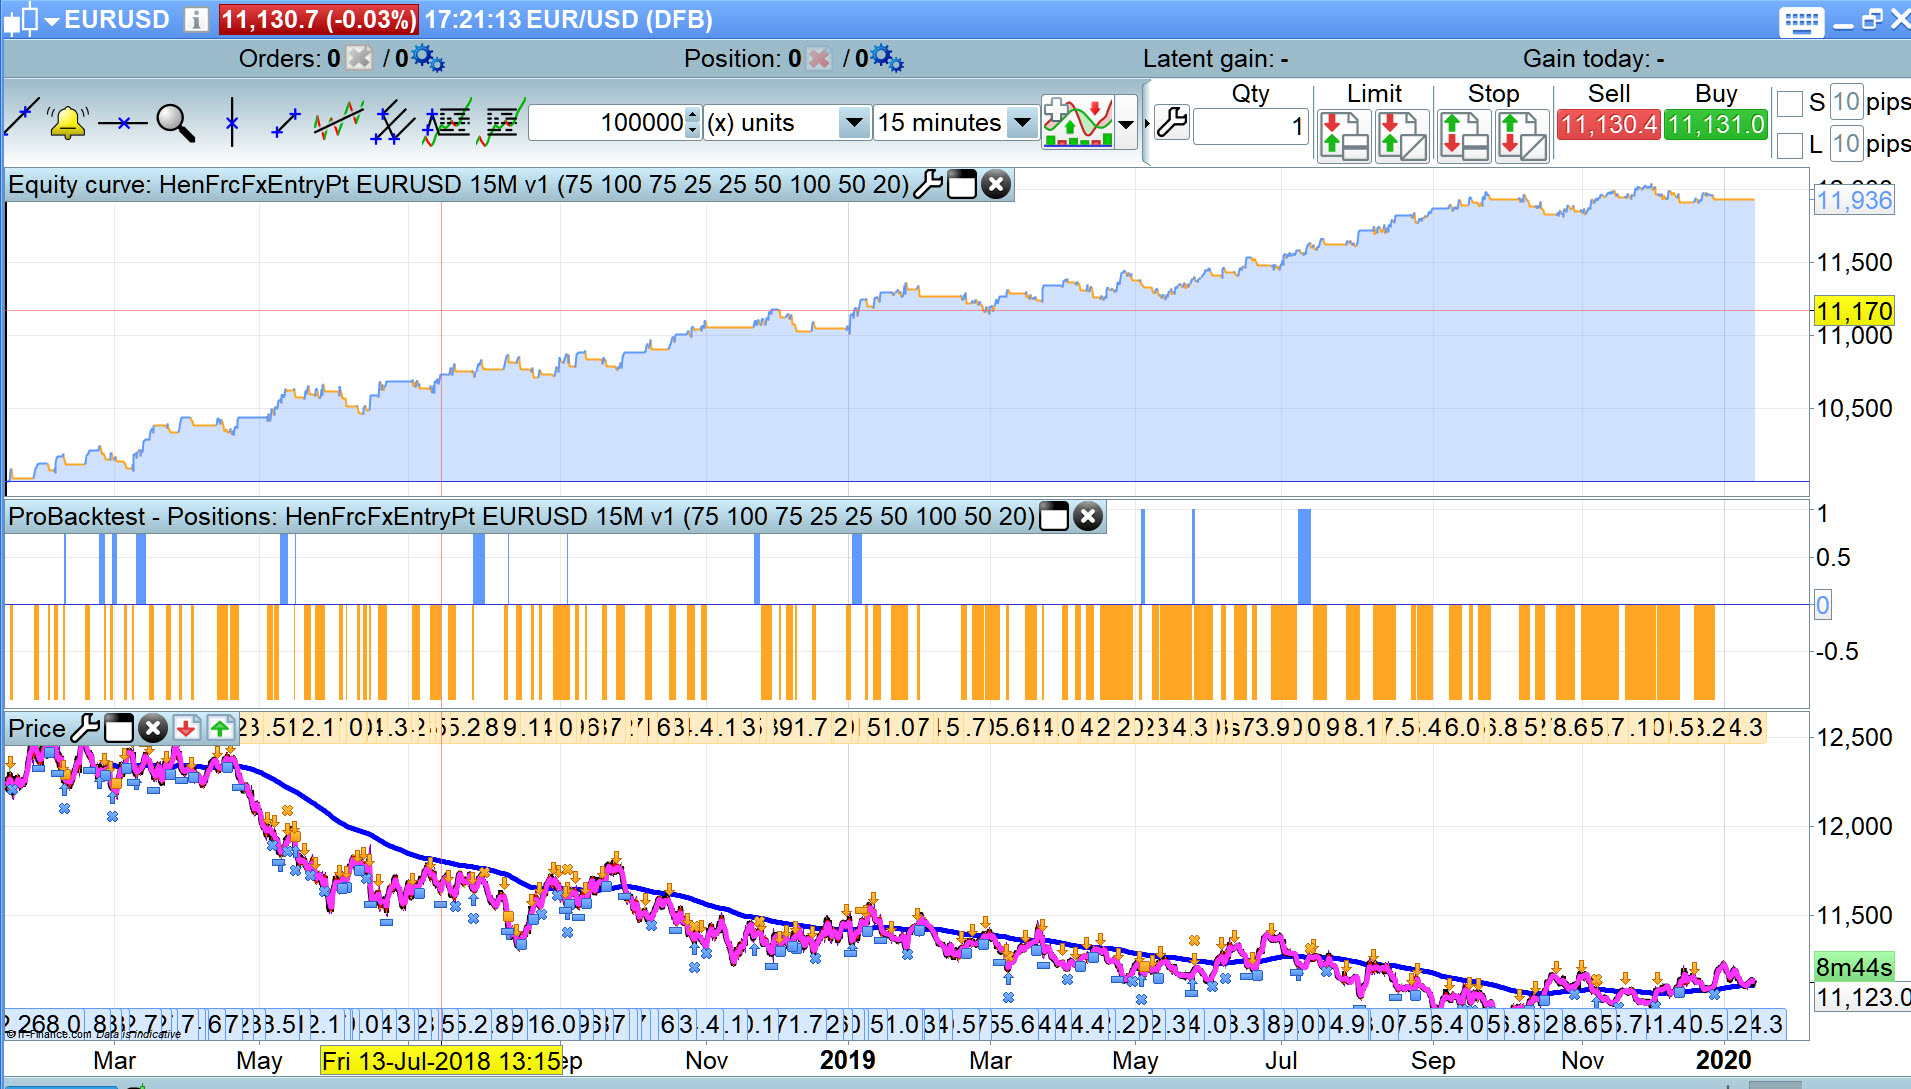
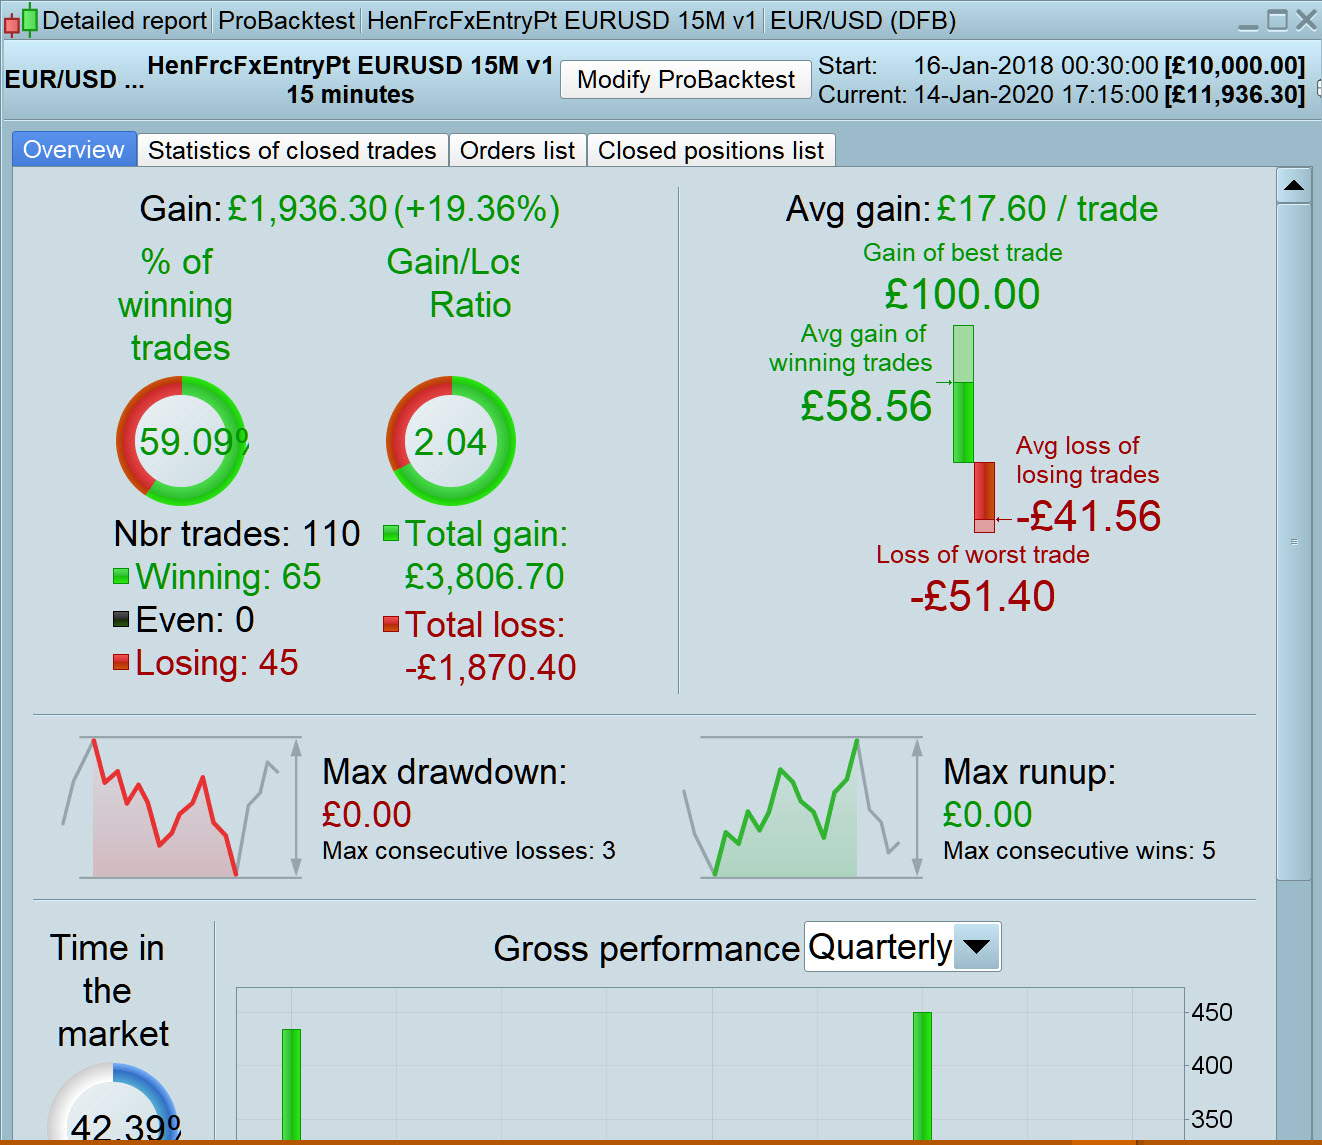
There you go … attached with variable settings in the optimiser.
I’ve used large steps for the variables so it optimises quickly, but it appears to work good enough to become a habit! 🙂
Needs WF now.
Also if the downtrend ends and price turns up then it would need regularly re-optimising.
@GraHal
Thanks but Francesco was pointing the fact that all that forex pairs have good results with the same exact variables values, great to know but next step was to consider the spread/fees..
@GraHal
Seems to work pretty good also on 2 year timeframe! Thank you so much for the testing and the optimization!
Could you share the final code?
@Nicolas
I think that starting from that ratios withouth spread nothing will have profits except from EURUSD that as i said before brings good results anyway.
I will start to try on Demo today, do you think could be shared also on library?
 ALZ
ALZParticipant
Average
Hi
i don’t have the same result with the initial code and 200k bars..
could you provide the last code with optimized parameters ?
thx
Could you share the final code?
could you provide the last code with optimized parameters ?
Apologies … I did attach the .itf in my post above but must have attached an image over the top! 🙂
Anyway here is the code (Spread = 2)
@GraHal
Looks pretty god! Nice work 😀
Not good with 200k.
I do not have 200k so please can you optimise it over 200k bars and post results here please.
All the settings are there for you set up in the optimiser so it will be real easy and quick for you.
I do not have 200k so please can you optimise it over 200k bars and post results here please. All the settings are there for you set up in the optimiser so it will be real easy and quick for you.
You optimised on 100k bars and got a nice equity curve and then ALZ tested those optimised values on 200k bars and that is a great 100k in sample and 100k out of sample walk backwards! ALZ says it failed which should tell us all that it is over optimised/curve fitted. Optimising it on the entire 200k bars seems pretty pointless unless you have another 200k bars of out of sample data to compare that new in sample test to?
Not good with 200k..
Out of interest, please can you post a screen shot of the results over 200k bars?