This code calculates both DrawDown and RunUp and their ratio, butyou have to add it to one of your strategies, not indicators:
// DrawDown & RunUp  (abridged)
//
ONCE Capital  = 10000
ONCE MinPoint = Capital
ONCE MaxPoint = 0
ONCE MaxRU    = 0
ONCE MaxDD    = 0
//------------------------------------------
//       EQUITY
Equity        = Capital + StrategyProfit
TempProfit    = PositionPerf * PositionPrice / PipSize * PipValue //   / abs(CountOfPosition)
TempEquity    = Equity + TempProfit
//------------------------------------------
//       DrawDown
MaxPoint      = max(MaxPoint,TempEquity)
DD            = MaxPoint - TempEquity
MaxDD         = max(MaxDD,DD)
DDperc        = MaxDD * 100 / Capital
//
//------------------------------------------
//       RunUp
MinPoint      = min(MinPoint,TempEquity)
RU            = TempEquity - MinPoint
MaxRU         = max(MaxRU,RU)
RUperc        = MaxRU * 100 / Capital
//------------------------------------------
//       DD/RU ratio
DDRUratio     = (MaxDD / MaxRU) * 100
//------------------------------------------
You only have to set your Capital, in place of 10000.
@robertogozzi Isn’t there a mistake on line 24?
MaxRU = min(MaxRU,RU)
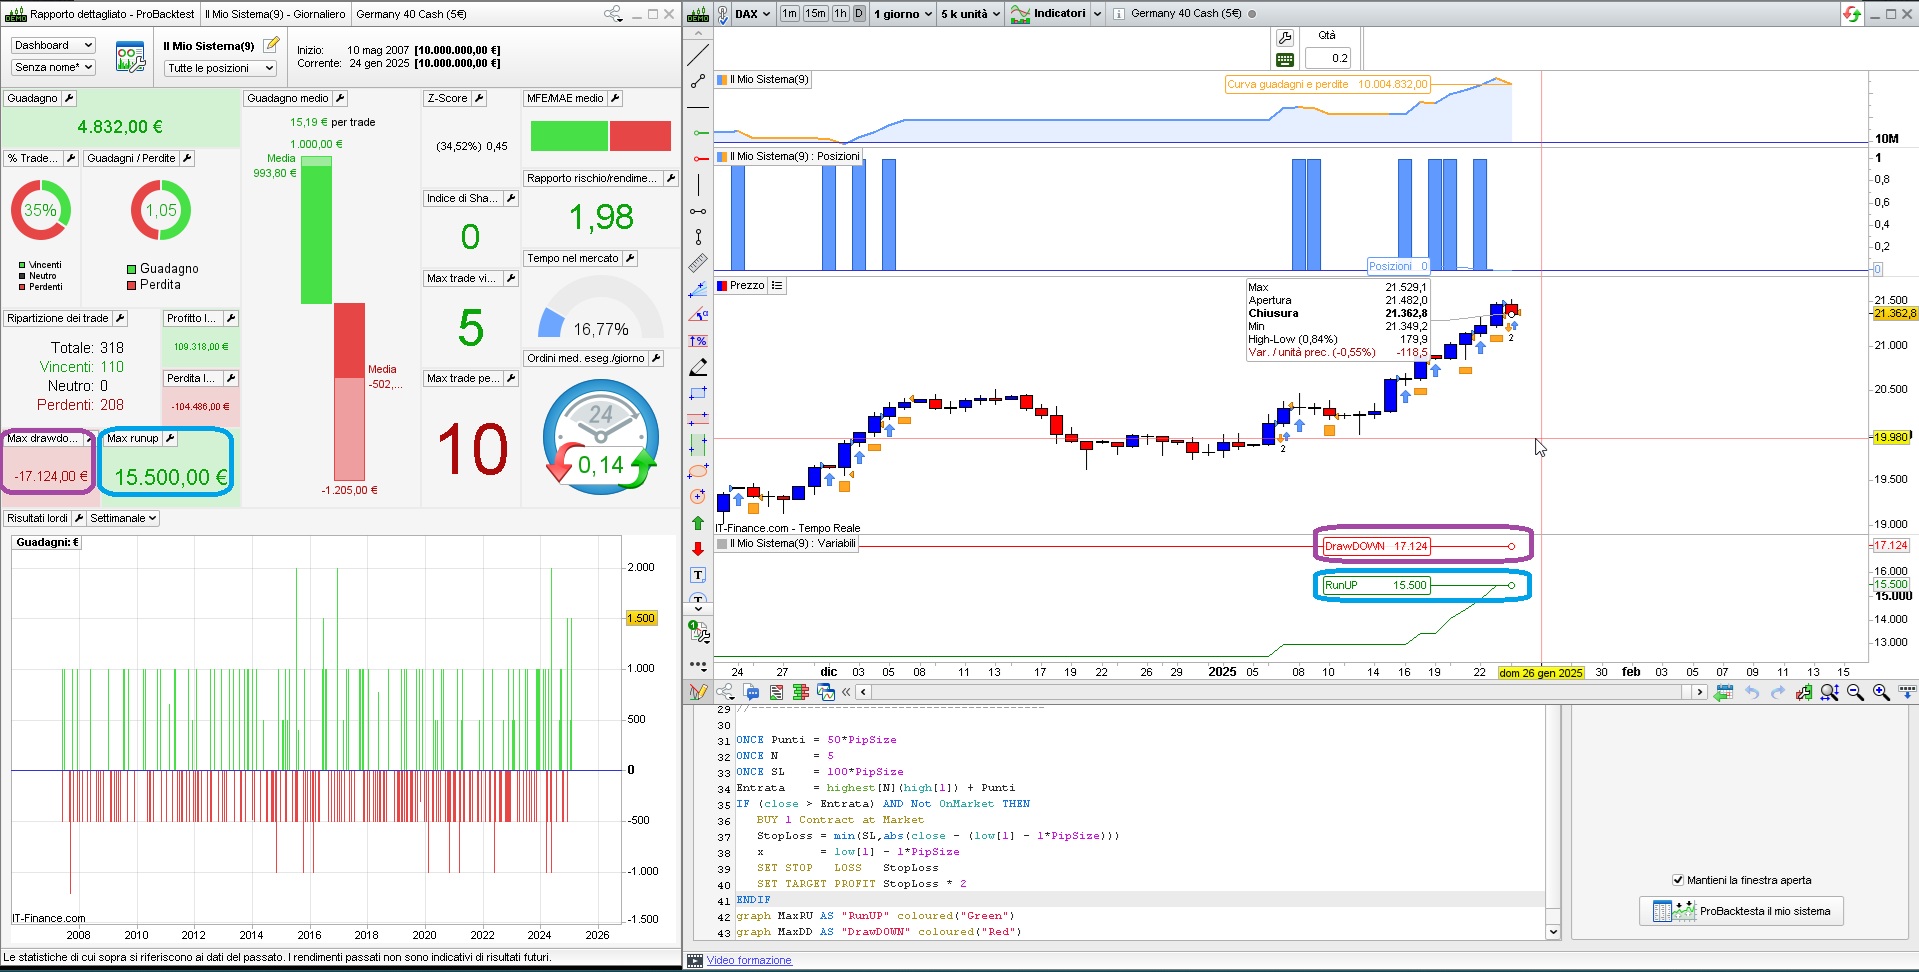
No, as we always have to store the highest value, both for RunUP and DrawDOW, this code matches ProRealTime calculations (on Dax, DailyTF) as shown in the attached pic:
// DrawDown & RunUp
//
ONCE Capital  = 100000
ONCE MinPoint = Capital
ONCE MaxPoint = 0
ONCE MaxRU    = 0
ONCE MaxDD    = 0
//------------------------------------------
//       EQUITY
Equity        = Capital + StrategyProfit
TempProfit    = PositionPerf * PositionPrice / PipSize * PipValue //   / abs(CountOfPosition)
TempEquity    = Equity + TempProfit
//------------------------------------------
//       DrawDown
MaxPoint      = max(MaxPoint,TempEquity)
DD            = MaxPoint - TempEquity
MaxDD         = max(MaxDD,DD)
DDperc        = MaxDD * 100 / Capital
//
//------------------------------------------
//       RunUp
MinPoint      = min(MinPoint,TempEquity)
RU            = TempEquity - MinPoint
MaxRU         = max(MaxRU,RU)
RUperc        = MaxRU * 100 / Capital
//------------------------------------------
//       DD/RU ratio
DDRUratio     = (MaxDD / MaxRU) * 100
//------------------------------------------

ONCE Punti = 50*PipSize
ONCE N     = 5
ONCE SL    = 100*PipSize
Entrata    = highest[N](high[1]) + Punti
IF (close > Entrata) AND Not OnMarket THEN
   BUY 1 Contract at Market
   StopLoss = min(SL,abs(close - (low[1] - 1*PipSize)))
   x        = low[1] - 1*PipSize
   SET STOP   LOSS   StopLoss
   SET TARGET PROFIT StopLoss * 2
ENDIF
graph MaxRU AS "RunUP" coloured("Green")
graph MaxDD AS "DrawDOWN" coloured("Red")
Same ast the code above, the do match!
Same ast the code above, the do match!
How do I get time-series Drawdown into a ProRealTime CSV export?
I’ve added your code to my strategy and it displays correctly on the chart in ProRealTime—great!
But I can’t figure out how to include Drawdown in my CSV export.
What I’m doing now
What I actually need
Ideal CSV columns (any equivalent works):
-
Date/Time, Equity (or Balance/NetLiquidation), Running Peak, Drawdown (amount), Drawdown (%).
With those I can filter any interval and calculate max DD for that window.
Question
If PRT can’t export DD directly
Current path used: Detailed report → Closed positions list (CSV).
Looking for the precise click path (and settings) to get a time-series drawdown out. Thanks!
You may get some data from the backtest:
- entry price
- exit price
- outcome
- type of trade (long or short)
then you have to get the OHLC data from the chart (you can find posts on how to get it, which is not as straightforward, though, at
https://www.prorealcode.com/topic/exporter-les-donnees-historiques-ohlc/#post-250046).
Once you have that data I think a spreadsheet app, such as eXcel, might be able to recalculate the drawdown, maybe with the help of Visual Basic for Applications (VBA).