Stef
StefParticipant
Average
Hi All,
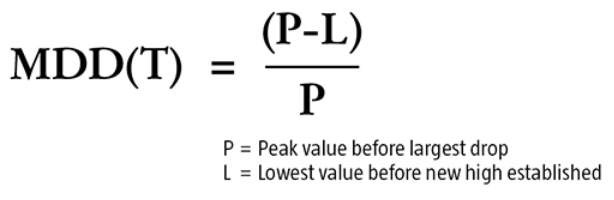
I am trying to calculate the max drawdown for a strategy in order to display this on a backtest.
This is what I have so far:
// max drawdown - wip

once highestequity=startcapital
once lowestequity=startcapital
once mddall=0

equity=startcapital+strategyprofit

if equity>highestequity then
highestequity=equity
lowestequity=equity
newpeakbar=barindex
endif

if equity<lowestequity and barindex>newpeakbar then
lowestequity=equity
mdd=(lowestequity-highestequity)/highestequity*100
endif


if mdd<mddall then
mddall=mdd
endif

graph mddall
Not sure how right or wrong this is currently.
Any help would be appreciated.
Stef
You should investigate on how to calcule the MAE (Max Adverse Excursion), which is the opposite of the MFE. You’ll find a way to calculate MFE in my trailing stop function here: http://www.prorealcode.com/blog/learning/trailing-stop-max-favorable-excursion-mfe/
The max drawdown of a strategy is already displayed on the backtest result window, so why are you looking to another way to find it?
StefParticipant
Average
@Nicolas. Max drawdown is displayed as a single value only. I would like to see how it developed over time – visually. By calculating it yourself, you will also be able to see if a large system drawdown was the result of a single bad year/month or many bad months/years. If a single occurrence, you can investigate it further – before simply eliminating a system because of that.
Have you looked at/tried my code – I don’t think it is necessarily that far off?
Stef
No I’m sorry, I didn’t test your code already. But the MAE is the complete inverse of my previous code of the MFE, it should be something like this:
//resetting variables when no trades are on market
if not onmarket then
 MAXPRICE = 0
 MINPRICE = close
endif

//case SHORT order
if shortonmarket then
 MAXPRICE = MAX(MAXPRICE,close) //saving the MAE of the current trade
endif

//case LONG order
if longonmarket then
 MINPRICE = MIN(MINPRICE,close) //saving the MAE of the current trade
endif
With this little code snippet you already have the minimum or maximum price met when you are on market. You could make a difference of these 2 values with the POSITIONPRICE and then transform this difference into money. Done, you have your max $ drawdown.
StefParticipant
Average
Tx Nicolas. Unless I am understanding you incorrectly, I do not think that we are trying to calculate the same thing.
I am not trying to calculate the high-low of a single trade, I am trying to calculate the largest difference between any highest peak and subsequent lowest trough.
As in:
http://www.robeco.com/en/professionals/insights/markets/2015/03/the-formula-maximum-drawdown.jsp
http://www.investopedia.com/terms/m/maximum-drawdown-mdd.asp
Stef
Hmmm ok, you are right it’s rather different from what I thought in the first place.
If I refer to the investopedia explanation, it deals with money, but are only the closed profit or the closed profit + floating one? (made by current trades on market).
 John
JohnParticipant
Senior
Your drawndown and of which trades it consists is visible in your equity curve.
Or is that not what you mean ?
StefParticipant
Average
@Nicolas. Would be closed an floating.
StefParticipant
Average
@John S.
You can see the peak to valley troughs on the equity graph yes, but it is not that simple to see if one peak to valley trough is bigger than another – especially if your equity curve contains a lot of data (system was backtested over a long time). Also, max drawdown takes into account all the decline until a new high or peak is formed. It might be of interest, for example, to know that your system might take 3/6 months before a new equity high is formed. During that time, your system is in drawdown – you’re not making money.
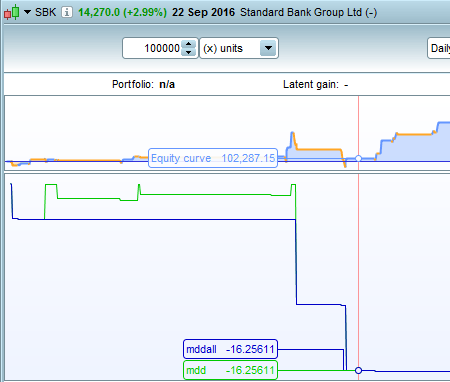
What I am looking for is more like this (see attachment). It shows the max drawdown as it develops over time (green line), and max drawdown for the whole period (blue line).
What I was hoping (asking) for was for someone to check my calculations to see if they agree.
Stef
About your code, ‘strategyprofit’ only deals with already closed positions, floating ones are not included in your own code. So do you really want them to be included?
StefParticipant
Average
I think the most accurate (correct way) would be to include open positions. I did not know how, so I used strategyprofit. It should not make that big a difference either way; i.e. if open positions cannot be included, then closed only ones would be good enough. Whether drawdown is calculated as 16.6% or 17.8%, for example, is not THAT important. I would be more interested to know if drawdown is less than 10%, 20%, 25%, etc.
Yes you can include them, you can use this code snippet in your formulas :
//floating profit
floatingprofit = (((close-positionprice)*pointvalue)*countofposition)/pipsize //actual trade gains
I made a request to PRT to add a new instruction for the floating profit, because we already have POSITIONPERF but it is in percentage.
Anyway, this variable can added to this line:
equity=startcapital+strategyprofit+floatingprofit
StefParticipant
Average
@Nicolas, tx for that!
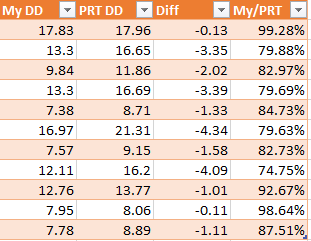
I wonder how they (PRT) calculate their max drawdown %.
I did some comparisons on different instruments – see attached.
It looks like my calculations are 85%+ accurate on average – or at least 85%+ the same as theirs.
Interesting if you look at the 2nd and 4th results – at least we are both consistent which is a good sign.
Stef
The PRT DD% is calculated with opened orders, it’s a live equity drawdown.
Hey! I am trying to calculate the max drawdown in cash, from the CSV file exported out from ProRealTime. I can’t get it to match with the max drawdown showing in ProRealTime. I am using the “Abs Perf” together with “MAE” column, trying to calculate the max dd, but still dont get same result as ProRealTime. Do any one know the formula ProRealTime is using to calculate the max drawdown?