Master Candle Indicator

Viewing 5 posts - 16 through 20 (of 20 total)
  • Author
    Posts
  • #15316 quote
    mmichaelmmichael
    Participant
    Average

    Hello Nicolas,

    I noticed those “extra” dots are frequent and it will be nice to fix that issue. Is is possible to add the reset of bullish/bearish to zero when the first break out is made to have cleaner result?

    #15339 quote
    mmichaelmmichael
    Participant
    Average

    Hi Nicolas,

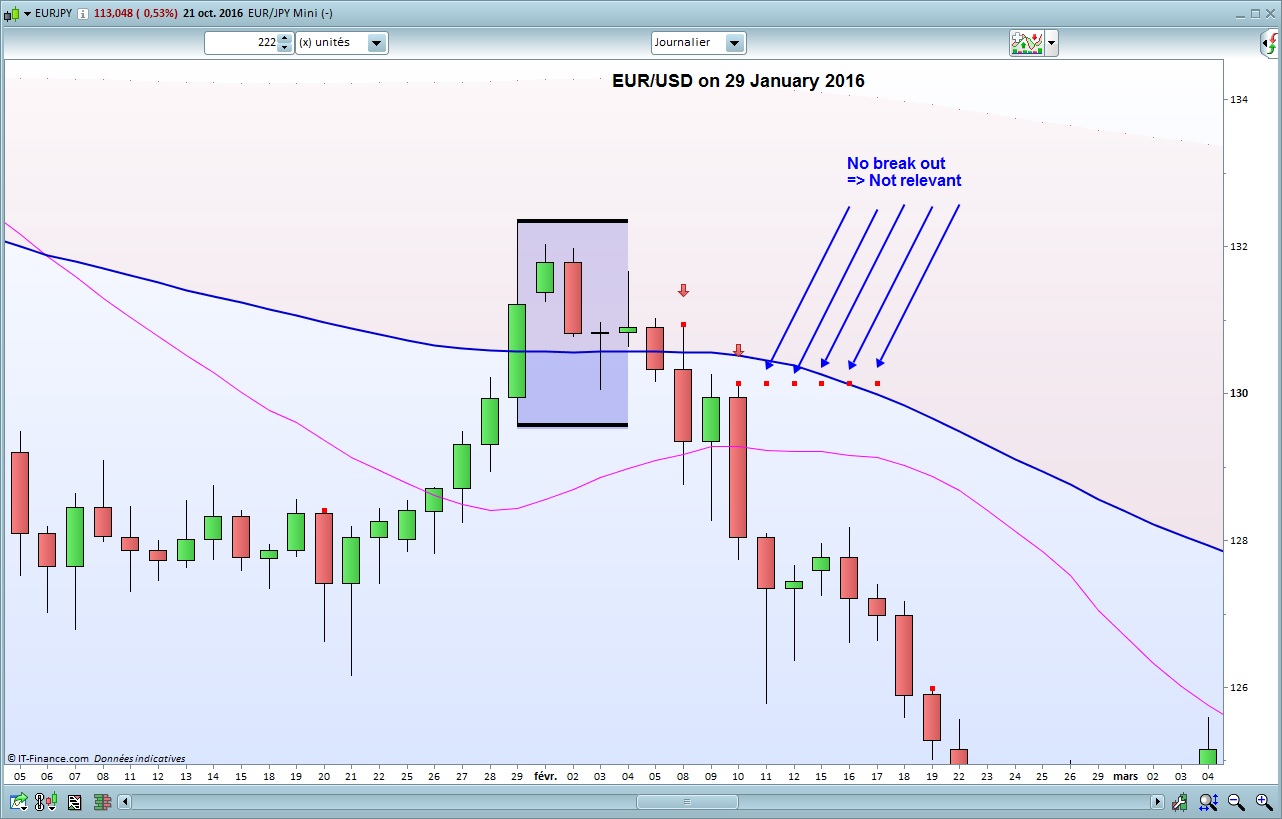
    As concrete example, I attached the graph of eur/usd on 29 January 2016. you can see that there are 5 dots which do not correspond to any break out. I think it is better to not see them…

    Do you have a code suggestion to fix these not relevant dots? I do not know how to do the variable reset you mentioned…

    One other remark, I am very happy with the V10.3 and I think the visual representation can be better using drawrectangle and drawarrow functions.

    Many thanks.

    issue-eur-usd-29-janv.jpg issue-eur-usd-29-janv.jpg
    #15342 quote
    mmichaelmmichael
    Participant
    Average

    I found the correction myself. here is it:

    // replace this part of the code
    
    if count=candlescount then
    patternbar = barindex
    goodhh = hh
    goodll = ll
    else
    bearish = 0
    bullish = 0
    endif
    #15362 quote
    NicolasNicolas
    Keymaster
    Legend

    Many thanks mmichael, you saved me some times. Would you mind upload here the final version of the indicator? Thanks, have a nice Sunday!

    #15372 quote
    mmichaelmmichael
    Participant
    Average

    Hello,

    You are welcome Nicolas. Here is the complete final code I have:

    PS.: the next step would be to bring some visual enhancements using the 10.3 functionnalities (drawline / drawrectangle)… But I am beginner, so if someone can help to do that enhancementit would be nice.


    candlescount = 4
    
    count = 0
    for i = candlescount+1 downto 1 do
    if i = candlescount+1 then
    hh = high[i]
    ll = low[i]
    elsif i<candlescount+1 and high[i]<hh and low[i]>ll then
    count=count+1
    endif
    next
    
    if count=candlescount then
    patternbar = barindex
    goodhh = hh
    goodll = ll
    else //fix 23/10/2016 extra dots fix
    bearish = 0
    bullish = 0
    endif
    
    if barindex-patternbar<=3 then
    bearish = 0
    bullish = 0
    if close crosses over goodhh then
    bullish = low-3*pipsize
    bearish = 0
    color = 1
    endif
    if close crosses under goodll then
    bearish = high+3*pipsize
    bullish = 0
    color = -1
    endif
    endif
    
    return goodhh as "top", goodll as "bottom", bullish coloured by color as "bullish signals", bearish coloured by color as "bearish signals"
    
    Nicolas thanked this post
Viewing 5 posts - 16 through 20 (of 20 total)
  • You must be logged in to reply to this topic.

ProRealAI ProRealAI New

Stuck on this ProBuilder code?

Describe what this topic is trying to build, in plain English, and ProRealAI writes the ProRealTime™ indicator, screener or system for you.

Available in 7 languages
Try ProRealAI

Master Candle Indicator


ProBuilder: Indicators & Custom Tools

New Reply
Author
author-avatar
draco76x @draco76x Participant
Summary

This topic contains 19 replies,
has 4 voices, and was last updated by mmichaelmmichael

9 years, 11 months ago.

Topic Details
Forum: ProBuilder: Indicators & Custom Tools
Language: English
Started: 09/23/2016
Status: Active
Attachments: No files
ProRealCode ProRealCode
Loading...