Ciao a tutti,
ho bisogno se potete di un aiuto di programmazione. Come faccio a trovare i massimi di un grafico con PRT?
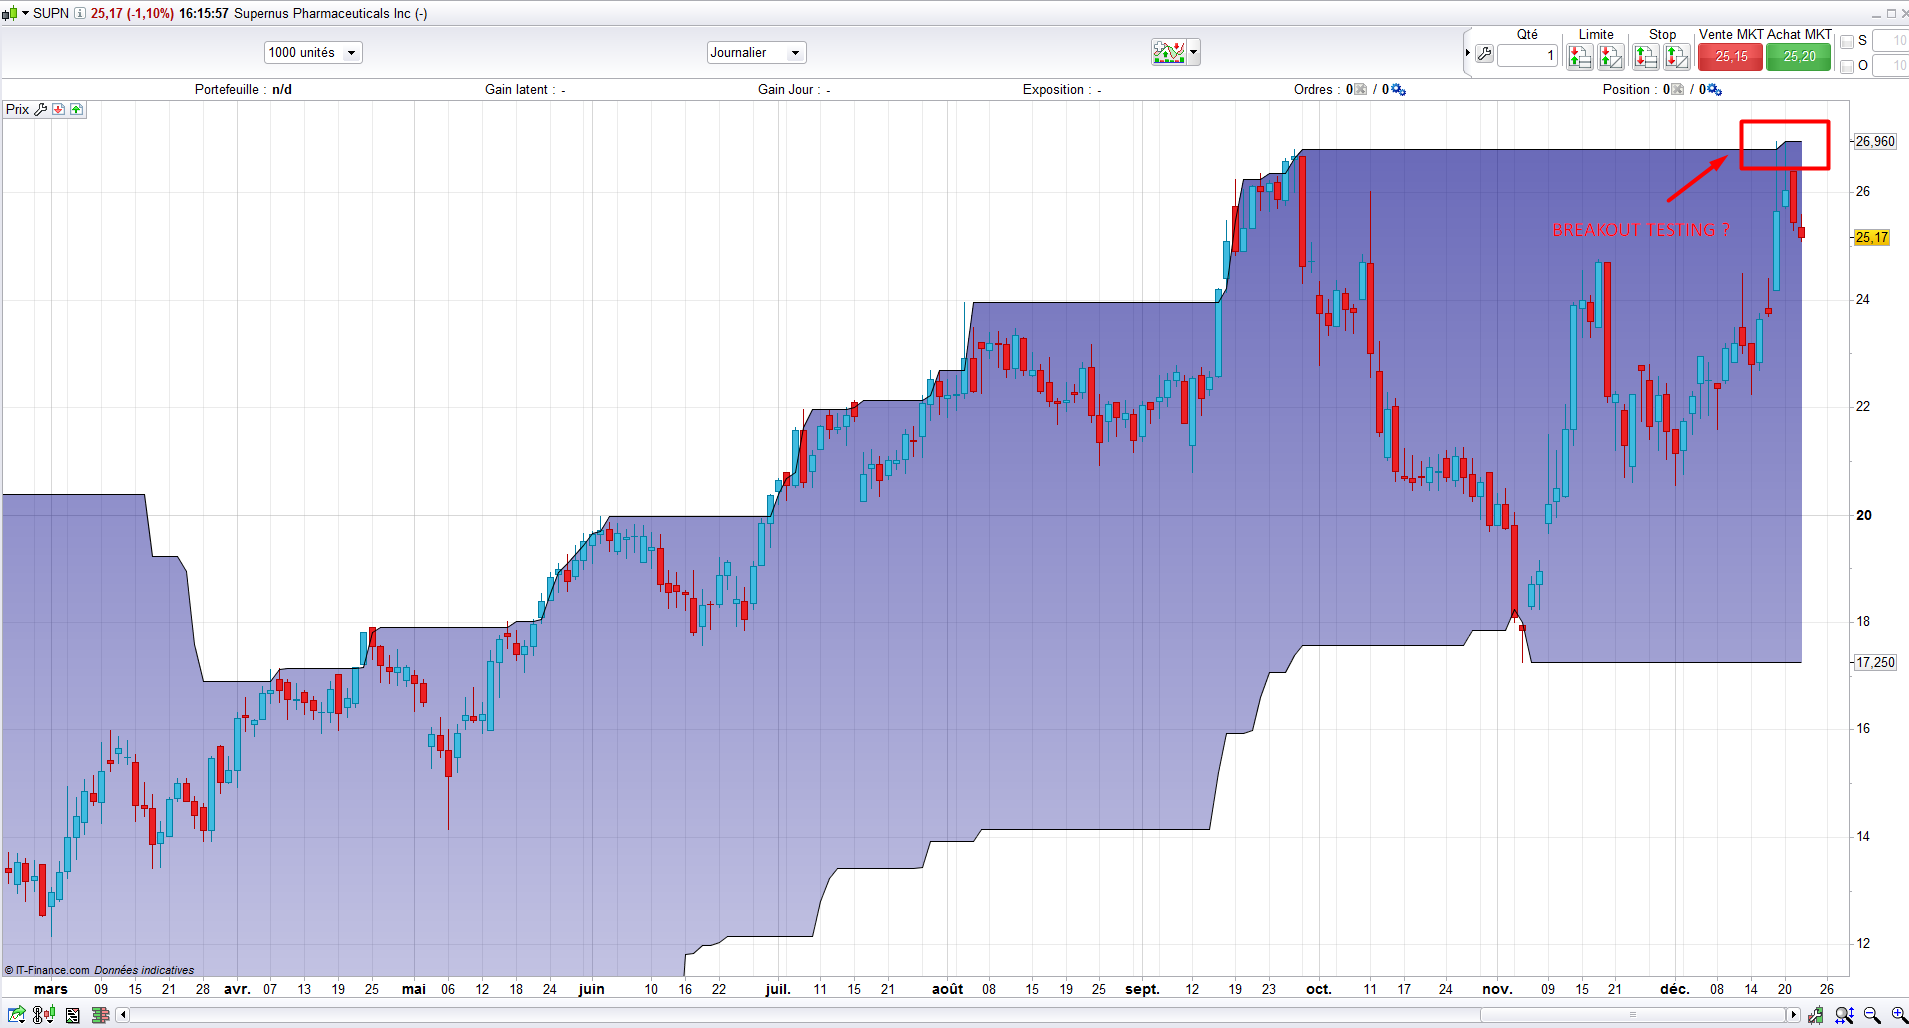
Ad es. si prenda il grafico SUPN. Vorrei uno screen da far girare giornalmente che mi dicesse ad es. quando la chiusura ha superato (o gli manca ad es. l’1%) un massimo del passato (es. ultimi 90/120 gg) .
Ad es. nel caso SUPN quando il close supererà i 26.68 $ lo screen dovrebbe rivelarmelo. Ovviamente la chiusura sui max a seconda delle azioni non si sa a priori quando è avvenuta.
Spero di essere stato chiaro (in pratica assomiglia parecchio al metodo Canslim di O’Neil).
Grazie
Fabio
Hi, anyone alive? Can somebody answer my Q?
Ci scusiamo per il ritardo per rispondere alla tua domanda. A volte, argomenti sono scavate in altri e io non lo vedo ..
Quindi, se ho capito bene la vostra richiesta, si vuole fare uno screener che restituisce il breakout degli ultimi 90 o 120 giorni più alto alto o più basso basse?
Visivamente, è molto simile a osservare il breakout di un canale Donchian di 90 giorni (o 120 giorni) come nello screenshot allegato.
Esatto Nicolas, la soluzione proposta potrebbe fare al caso mio. Saresti così gentile e dirmi come implementarla in termini di formule?
Grazie
Sì, naturalmente, questa è la formula di uno screener che rileverà il breakout dei 90 periodi più alto alto (si può cambiare te stesso questo valore nel codice).
period = 90 //period in days of the highest high
percentminimum = 1 //minimum percent of current high piercing

hh = highest[period](high)[1]
c = 1-(hh/high)>=percentminimum/100

screener [c] (variation as "variation")
Questo screener dovrebbe funzionare come previsto, vi preghiamo di darci un feedback!
Grazie 1000 Nicolas, sfortunatamente non è esattamente quanto mi aspetto…..
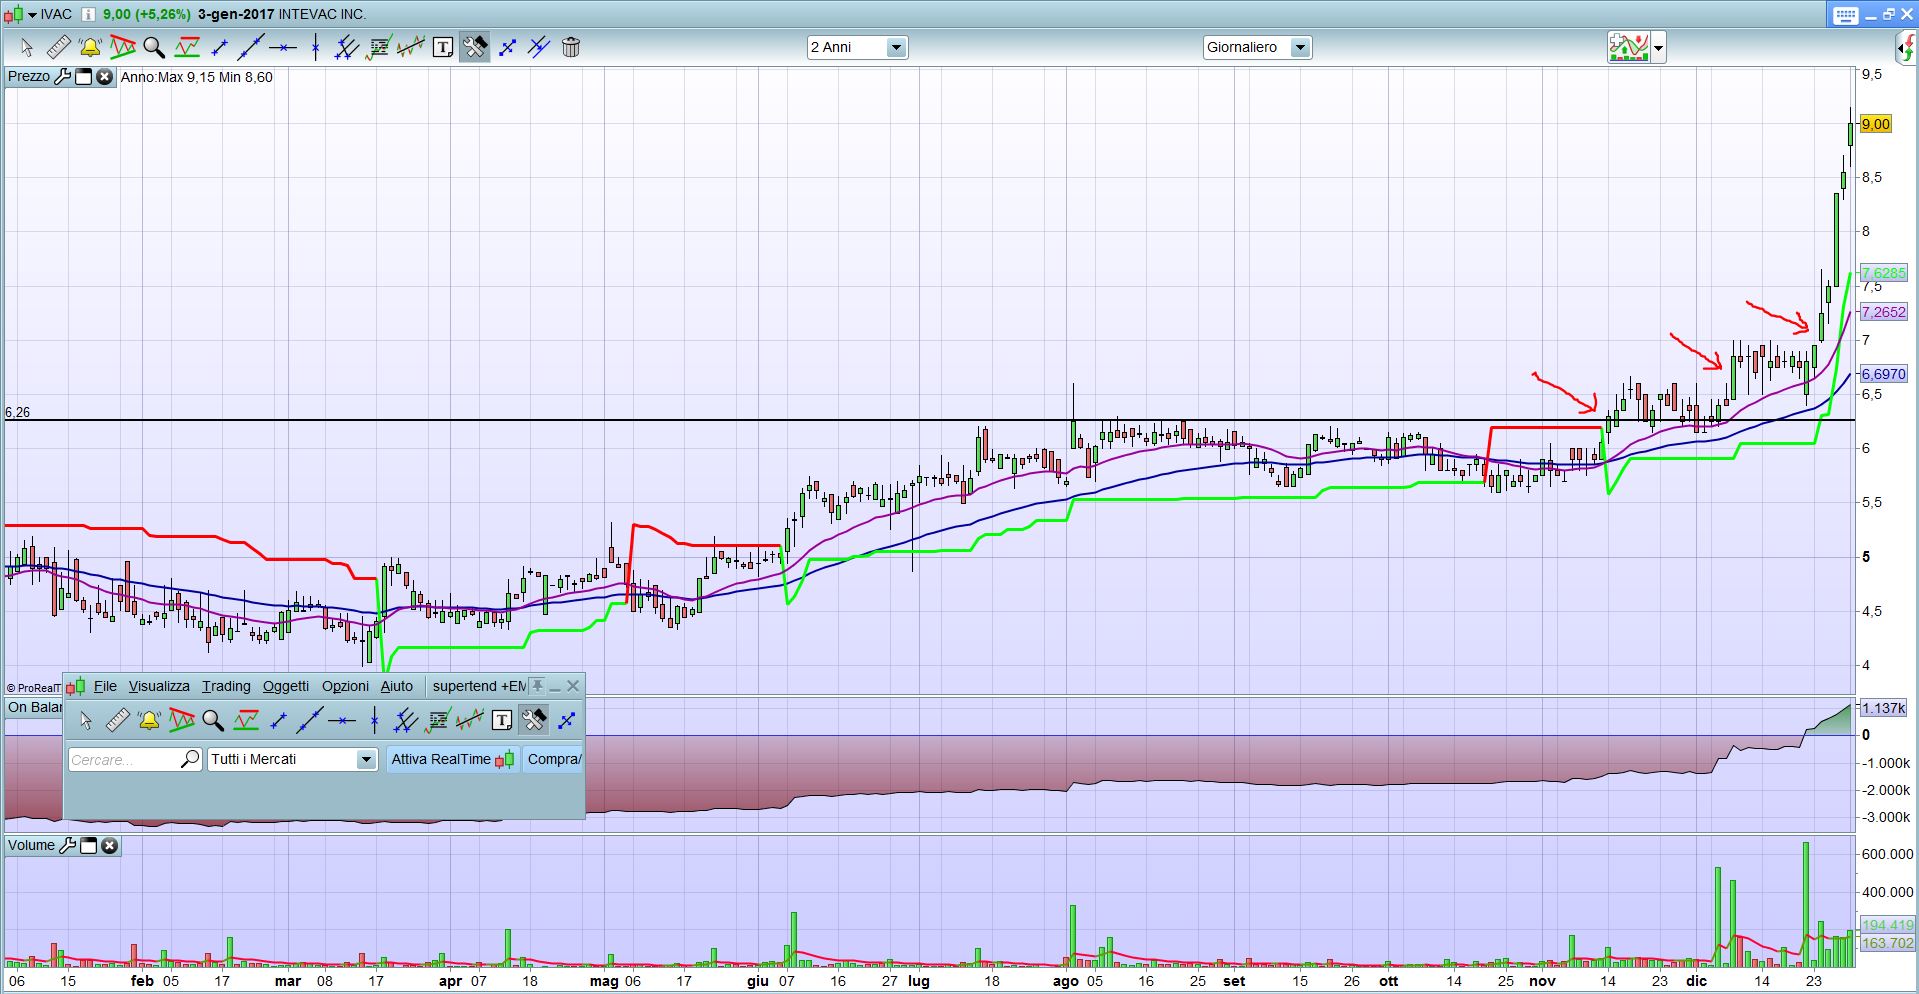
Ad es. lo screen individua il ticker IVAC che ormai ha abbondantemente rotto i supporti…..come si dice è andata la quaglia……
Mi piacerebbe un qualcosa che ad es. sempre restando su IVAC e mantenendo il setting di ad es. 90 gg (periodi) individuasse il breakout del 14 novembre il 14 novembre stesso su una resistenza (o un massimo dei precedenti 90 gg), e anche i giorni successivi.
Vorrei cioè qualcosa che individua la PRIMA rottura del massimo dei precedenti XX (90) gg, massimo che ovviamente non deve essere quello del giorno precedente.
Spero di essere stato chiaro.
Fabio
p.s. anche il mio screener sottostante ad es. individua IVAC, ma non è ciò che cerco
V0= Average[60](Volume)*Close[0]>200000 and Close[0]>2 // liquidità sufficiente
//V1= Average[2](Volume)>2*Average[90](Volume) //volume in crescita
V5= Volume[0] >1.3*Average[90](Volume) and Volume[1] >1.3*Average[90](Volume)
V2= Close[0] > Close[1]*1.04 and Close[0] < Close[1]*1.15
V3= Close[0] > Close[1]
V4= ExponentialAverage[20](close) > ExponentialAverage[50](close)

Screener [V0 and V5 and V2 and V3 and V4]
Si prega di aggiungere uno screenshot di ciò che si vuole esattamente.
Il vagliatore ho dato di testare se la condizione sono soddisfatte il giorno corrente, non giorni fa … Se non lo dici, io non saprei! 🙂
Non ho strumento IVAC sulla mia piattaforma, dove non è elencato?
Scusa Nicolas, pensavo di essere stato chiaro ma forse non è così….
Prendiamo il grafico IVAC dal Nasdaq (che hai sulla piattaforma) allegato.
Come indicato dalla linea orizzontale IVAC ha avuto due massimi identici il 2 e il 23/8 a 6.25. Io vorrei uno screen che il giorno 14/11 (e solo il 14/11) mi selezioni la IVAC in quanto ha superato il massimo dei (ad es.) 90 gg precedenti. Lo screen dovrà poi tornare a selezionare il titolo il giorno 8/12 in quanto ha superato il massimo precedente, ma non nei giorni successivi fino al 23/12 e poi di nuovo selezionarlo il 27/12.
Ad es. il giorno 28/12 non si ha un massimo, in quanto il massimo è un punto tra 2 valori (giorno prima e giorno successivo) adiacenti inferiori.
A questo punto dovrei essere stato chiaro…..
Buongiorno Nicolas, hai qualche idea su come implementare quanto sopra?
Grazie
Fabio
Mi dispiace, ho passato lunghi minuti per capire la vostra richiesta attraverso la traduzione automatica con google, ma io ancora non so cosa fare 🙂 A volte il linguaggio italiano Traduci in inglese o francese è un casino e niente chiaro .. mi piacerebbe vuole aiutare, parli inglese forse?
Hi Nicolas,
as requested by you, I’ll try in English 🙂
I try to be as clear as possible, and I hope to be able to let you to understand.
As example let’s continue to work on same attach of my previous thread, IVAC graph (from Nasdaq). How I indicated on graph by means of the horizontal line, IVAC had 2 relative maximum identical on 02/08 and on August 23, at 6.25$. I’d like a screen which on 03 and 24 August (the days after) detect this maximum of the previous 90 days. Same thing for 16 of november.
This screen as example should select again this ticker (IVAC) the 9 of decembre, and 28/12 (days after relative maximum), because they passed a previous maximum.
What I wish to avoid is to detect the ticker the following days because the break out has already started. On 29/12 there’s not a maximum relevant to the previous period, but just to the previous day.
Hope now my request is more clear. 🙂
So the first breakout is 90 periods highest high and what about the next one? You say:
the 9 of decembre, and 28/12 (days after relative maximum), because they passed a previous maximum.
How do you define this previous maximum? That’s why I supposed you’d better use donchian channels to determine what were the last previous high to test the next breakout.
You proposed to use donchian channel, but the screener you made did not use it. Try to propose a screener with doncian Channel, and may be this is what I am looking for…
Thanks again
Fabio
…previous maximum is the maximum value reached in the past 90 days unless is the previous day (which I do not want), as 8 Dicember and 27 dicember which I decect with the screen the day after.
Hi Nicolas any suggestion with Doncian?