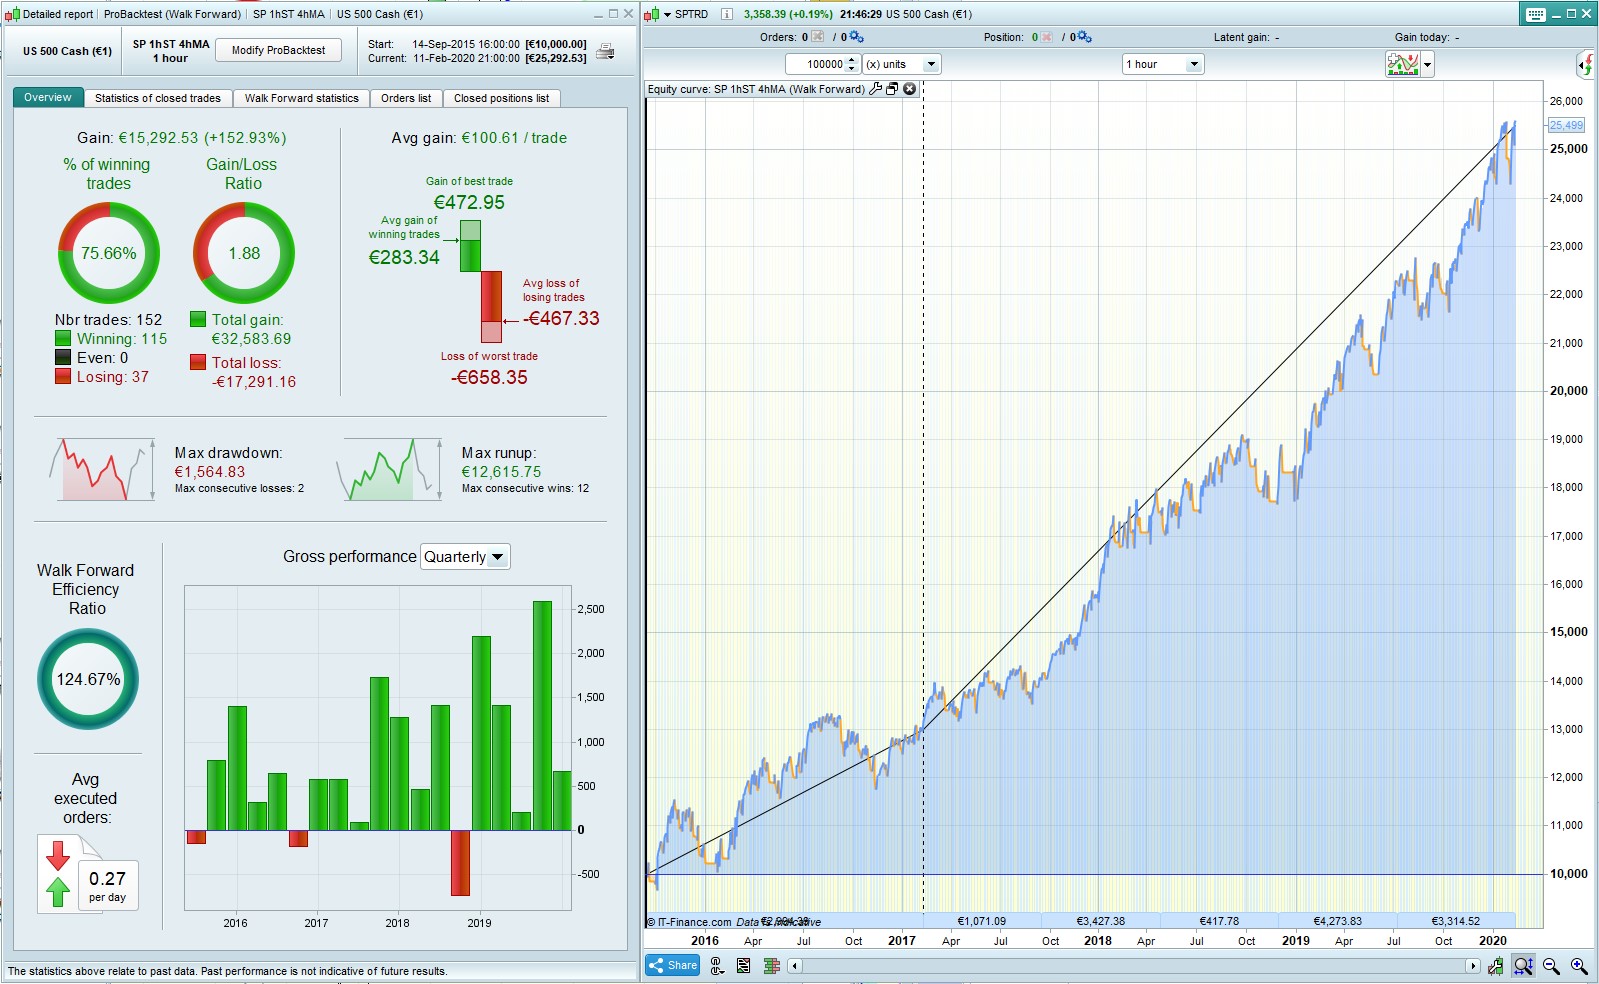
Here’s a nice simply strategy for the SP 1h, long only. WF is good, robustness reasonably good. 4 year backtest with MM is v nice.
Position size is €9, comparable margin to €1 on the DJ.
All suggestions welcome…
// Definition of code parameters
DEFPARAM CumulateOrders = false // Cumulating positions deactivated
DEFPARAM preloadbars = 5000

Capital = 10000
MinSize = 9                 //The minimum position size allowed for the instrument.
MM1stType = 0               //Starting type of moneymanagement. Set to 0 for level stakes. Set to 1 for increasing stake size as profits increase and decreasing stake size as profits decrease. Set to 2 for increasing stake size as profits increase with stake size never being decreased.
MM2ndType = 1               //Type of money management to switch to after TradesQtyForSwitch number of trades and ProfitNeededForSwitch profit has occurred
TradesQtyForSwitch = 5    //Quantity of trades required before switching to second money management choice.
ProfitNeededForSwitch = 2   //% profit needed before allowing a money management type change to MM2ndType.
DrawdownNeededToSwitch = 8 //% draw down from max equity needed before money management type is changed back to MM1stType.
DrawdownNeededToQuit = 25   //% draw down from max equity needed to stop strategy

Once MoneyManagement = MM1stType

Equity = Capital + StrategyProfit
maxequity = max(equity,maxequity)

if equity < maxequity * (1 - (DrawdownNeededToSwitch/100)) then
enoughtrades = 0
tradecount = 0
moneymanagement = MM1stType
endif

if equity < maxequity * (1 - (DrawdownNeededToQuit/100)) then
quit
endif

if not EnoughTrades then
if abs(countofposition) > abs(countofposition[1]) then
tradecount = tradecount + 1
endif
if tradecount > TradesQtyForSwitch and maxequity >= Capital * (1 + (ProfitNeededForSwitch/100)) then
EnoughTrades = 1
MoneyManagement = MM2ndType
endif
endif

IF MoneyManagement = 1 THEN
PositionSize = Max(MinSize, Equity * (MinSize/Capital))
ENDIF

IF MoneyManagement = 2 THEN
PositionSize = Max(LastSize, Equity * (MinSize/Capital))
LastSize = PositionSize
ENDIF

IF MoneyManagement <> 1 and MoneyManagement <> 2 THEN
PositionSize = MinSize
ENDIF

PositionSize = Round(PositionSize*100)
PositionSize = PositionSize/100

// Size of POSITIONS
PositionSizeLong = 1 * positionsize

TIMEFRAME(240minutes,updateonclose)
indicator2 = Average[6](typicalPrice)
indicator3 = Average[10](typicalPrice)
c1 = (indicator2 > indicator3)

TIMEFRAME(60 minutes,updateonclose)
indicator1 = SuperTrend[6,15]
c2 = (close > indicator1)

// Conditions to enter long positions
IF  c1 and c2  THEN
BUY PositionSizeLong CONTRACT AT MARKET
ENDIF
SET STOP %LOSS 2.2
SET TARGET %PROFIT 1.6

//trailing stop function
trailingstart = 30 //trailing will start @trailinstart points profit
trailingstep = 1 //trailing step to move the "stoploss"

//reset the stoploss value
IF NOT ONMARKET THEN
newSL=0
ENDIF

//manage long positions
IF LONGONMARKET THEN
//first move (breakeven)
IF newSL=0 AND close-tradeprice(1)>=trailingstart*pipsize THEN
newSL = tradeprice(1)+trailingstep*pipsize
ENDIF
//next moves
IF newSL>0 AND close-newSL>=trailingstep*pipsize THEN
newSL = newSL+trailingstep*pipsize
ENDIF
ENDIF

//manage short positions
IF SHORTONMARKET THEN
//first move (breakeven)
IF newSL=0 AND tradeprice(1)-close>=trailingstart*pipsize THEN
newSL = tradeprice(1)-trailingstep*pipsize
ENDIF
//next moves
IF newSL>0 AND newSL-close>=trailingstep*pipsize THEN
newSL = newSL-trailingstep*pipsize
ENDIF
ENDIF

//stop order to exit the positions
IF newSL>0 THEN
SELL AT newSL STOP
EXITSHORT AT newSL STOP
ENDIF
Did you do the robustness test and walk forward test with money management on? If so then turn it off and robustness test and walk forward test again. All testing should be done with level stakes – we should only turn money management on once we are happy that a strategy can make money on level stakes and it is robust and not curve fitted. Money management just clouds the picture.
All testing is level stakes, MM added after for illustration.
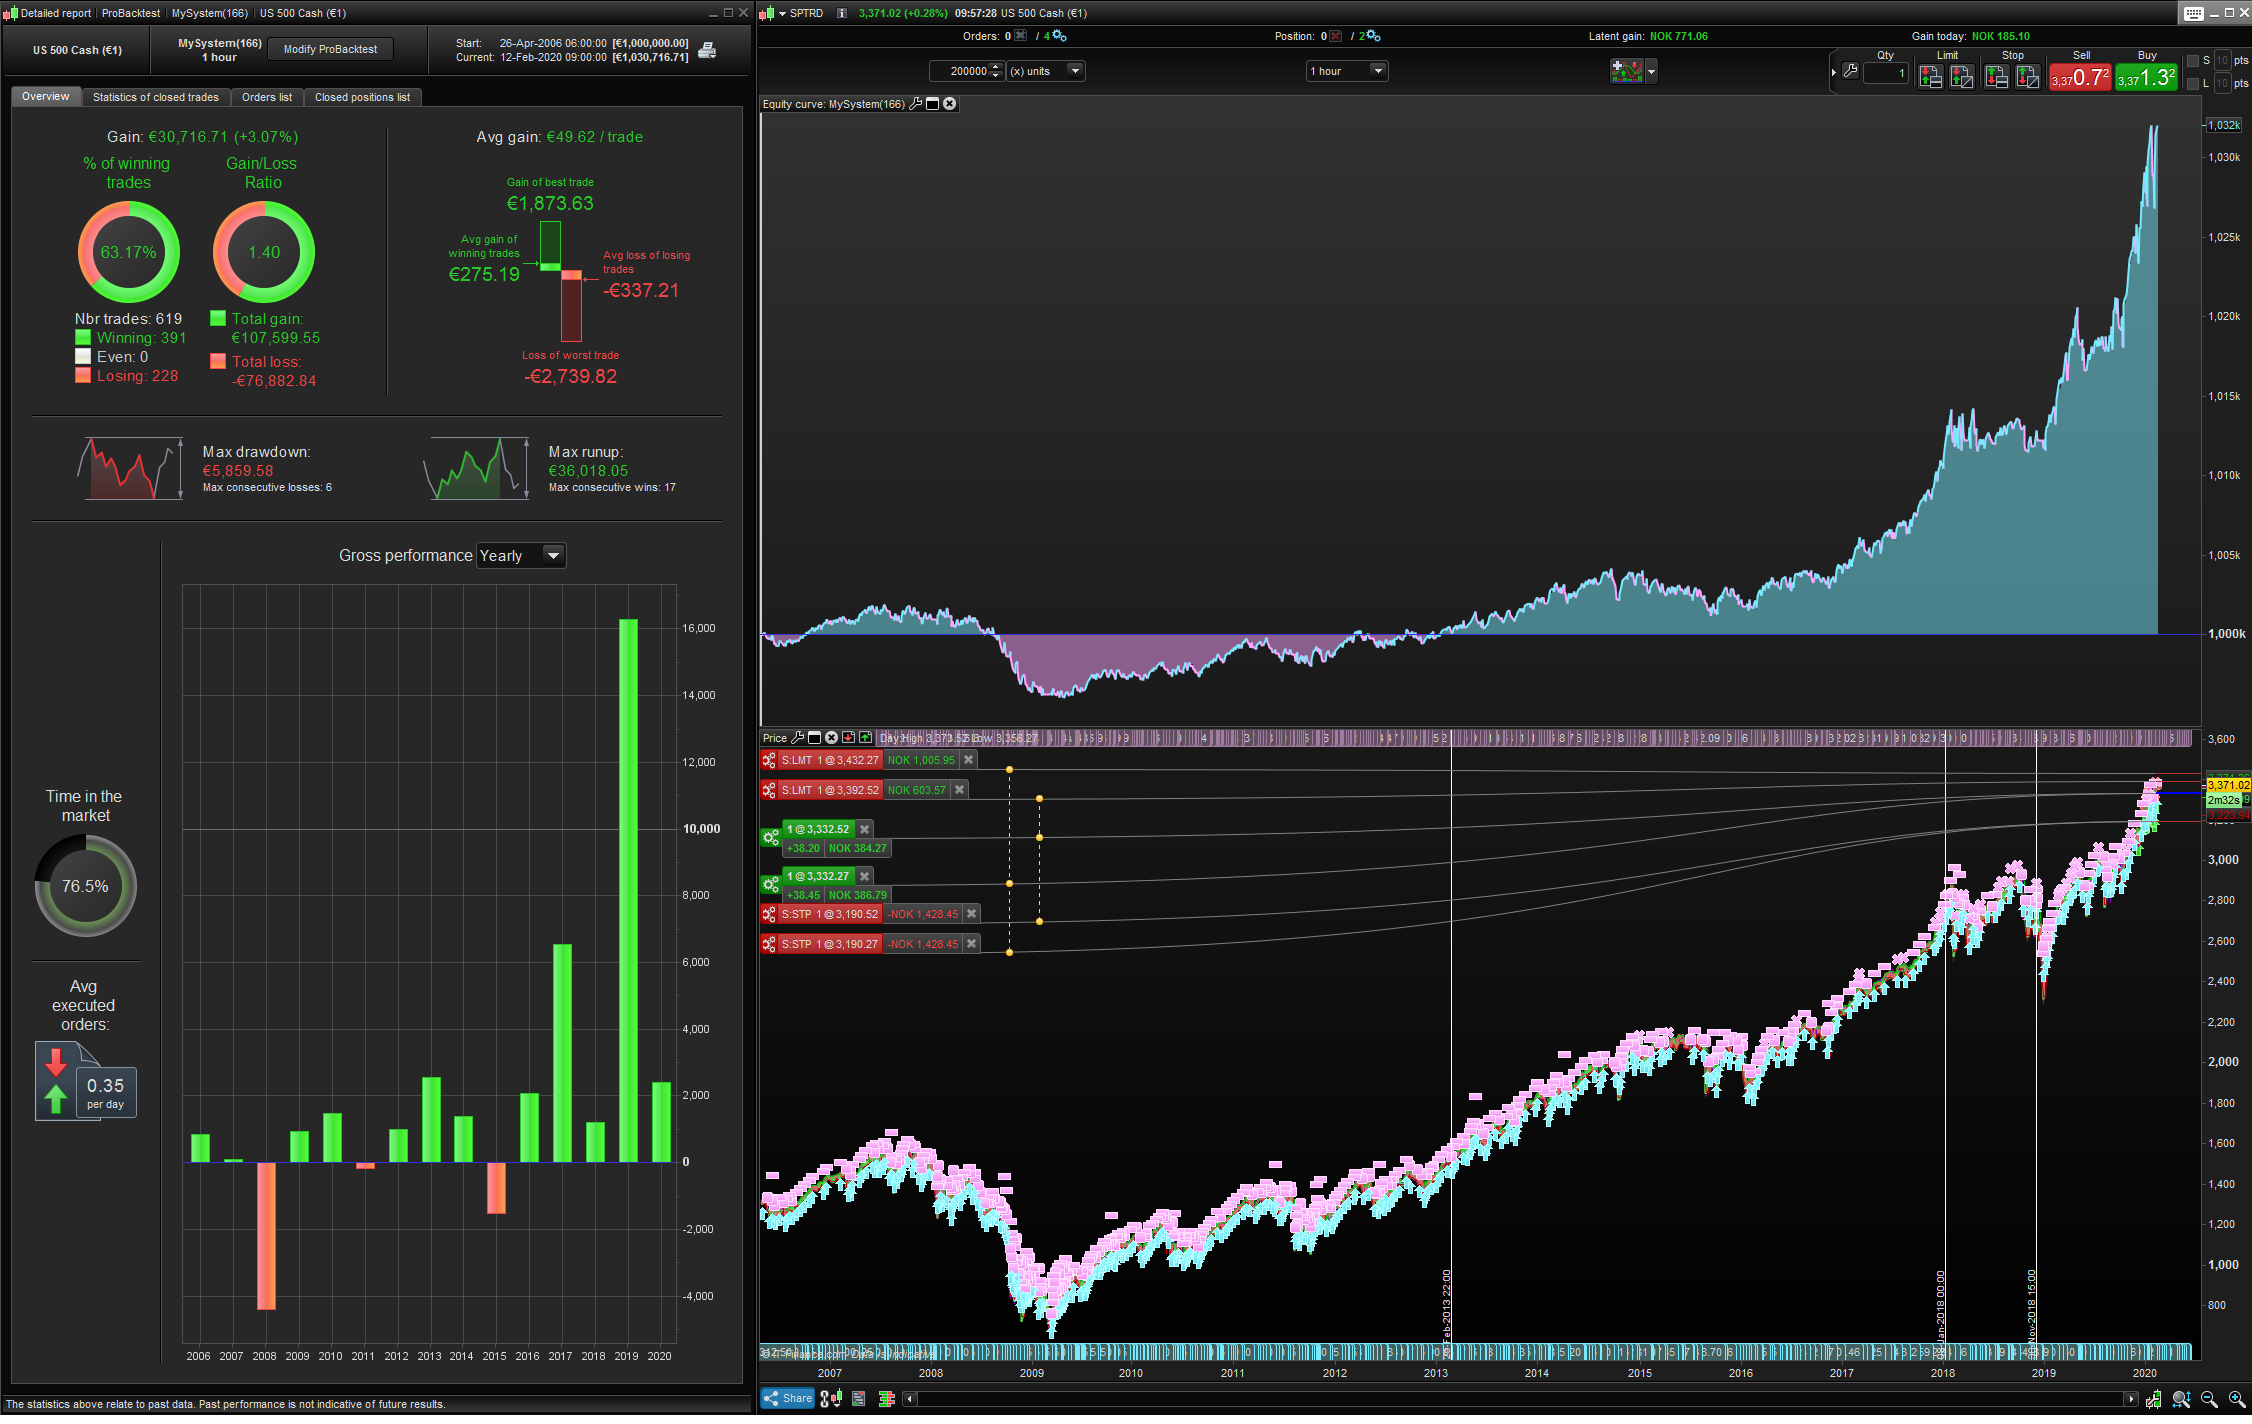
That’s good news – so now we just need someone to do a 200k backtest with MM turned off so we can see how it works OOS.
That would be great. 100k is all I have to work with so even with 1h TF it’s not a lot to go on.
May well flop if looking further back, but the logic of it is so simple and (to me) intuitively sensible that hopefully it will just mean minor adjustments.
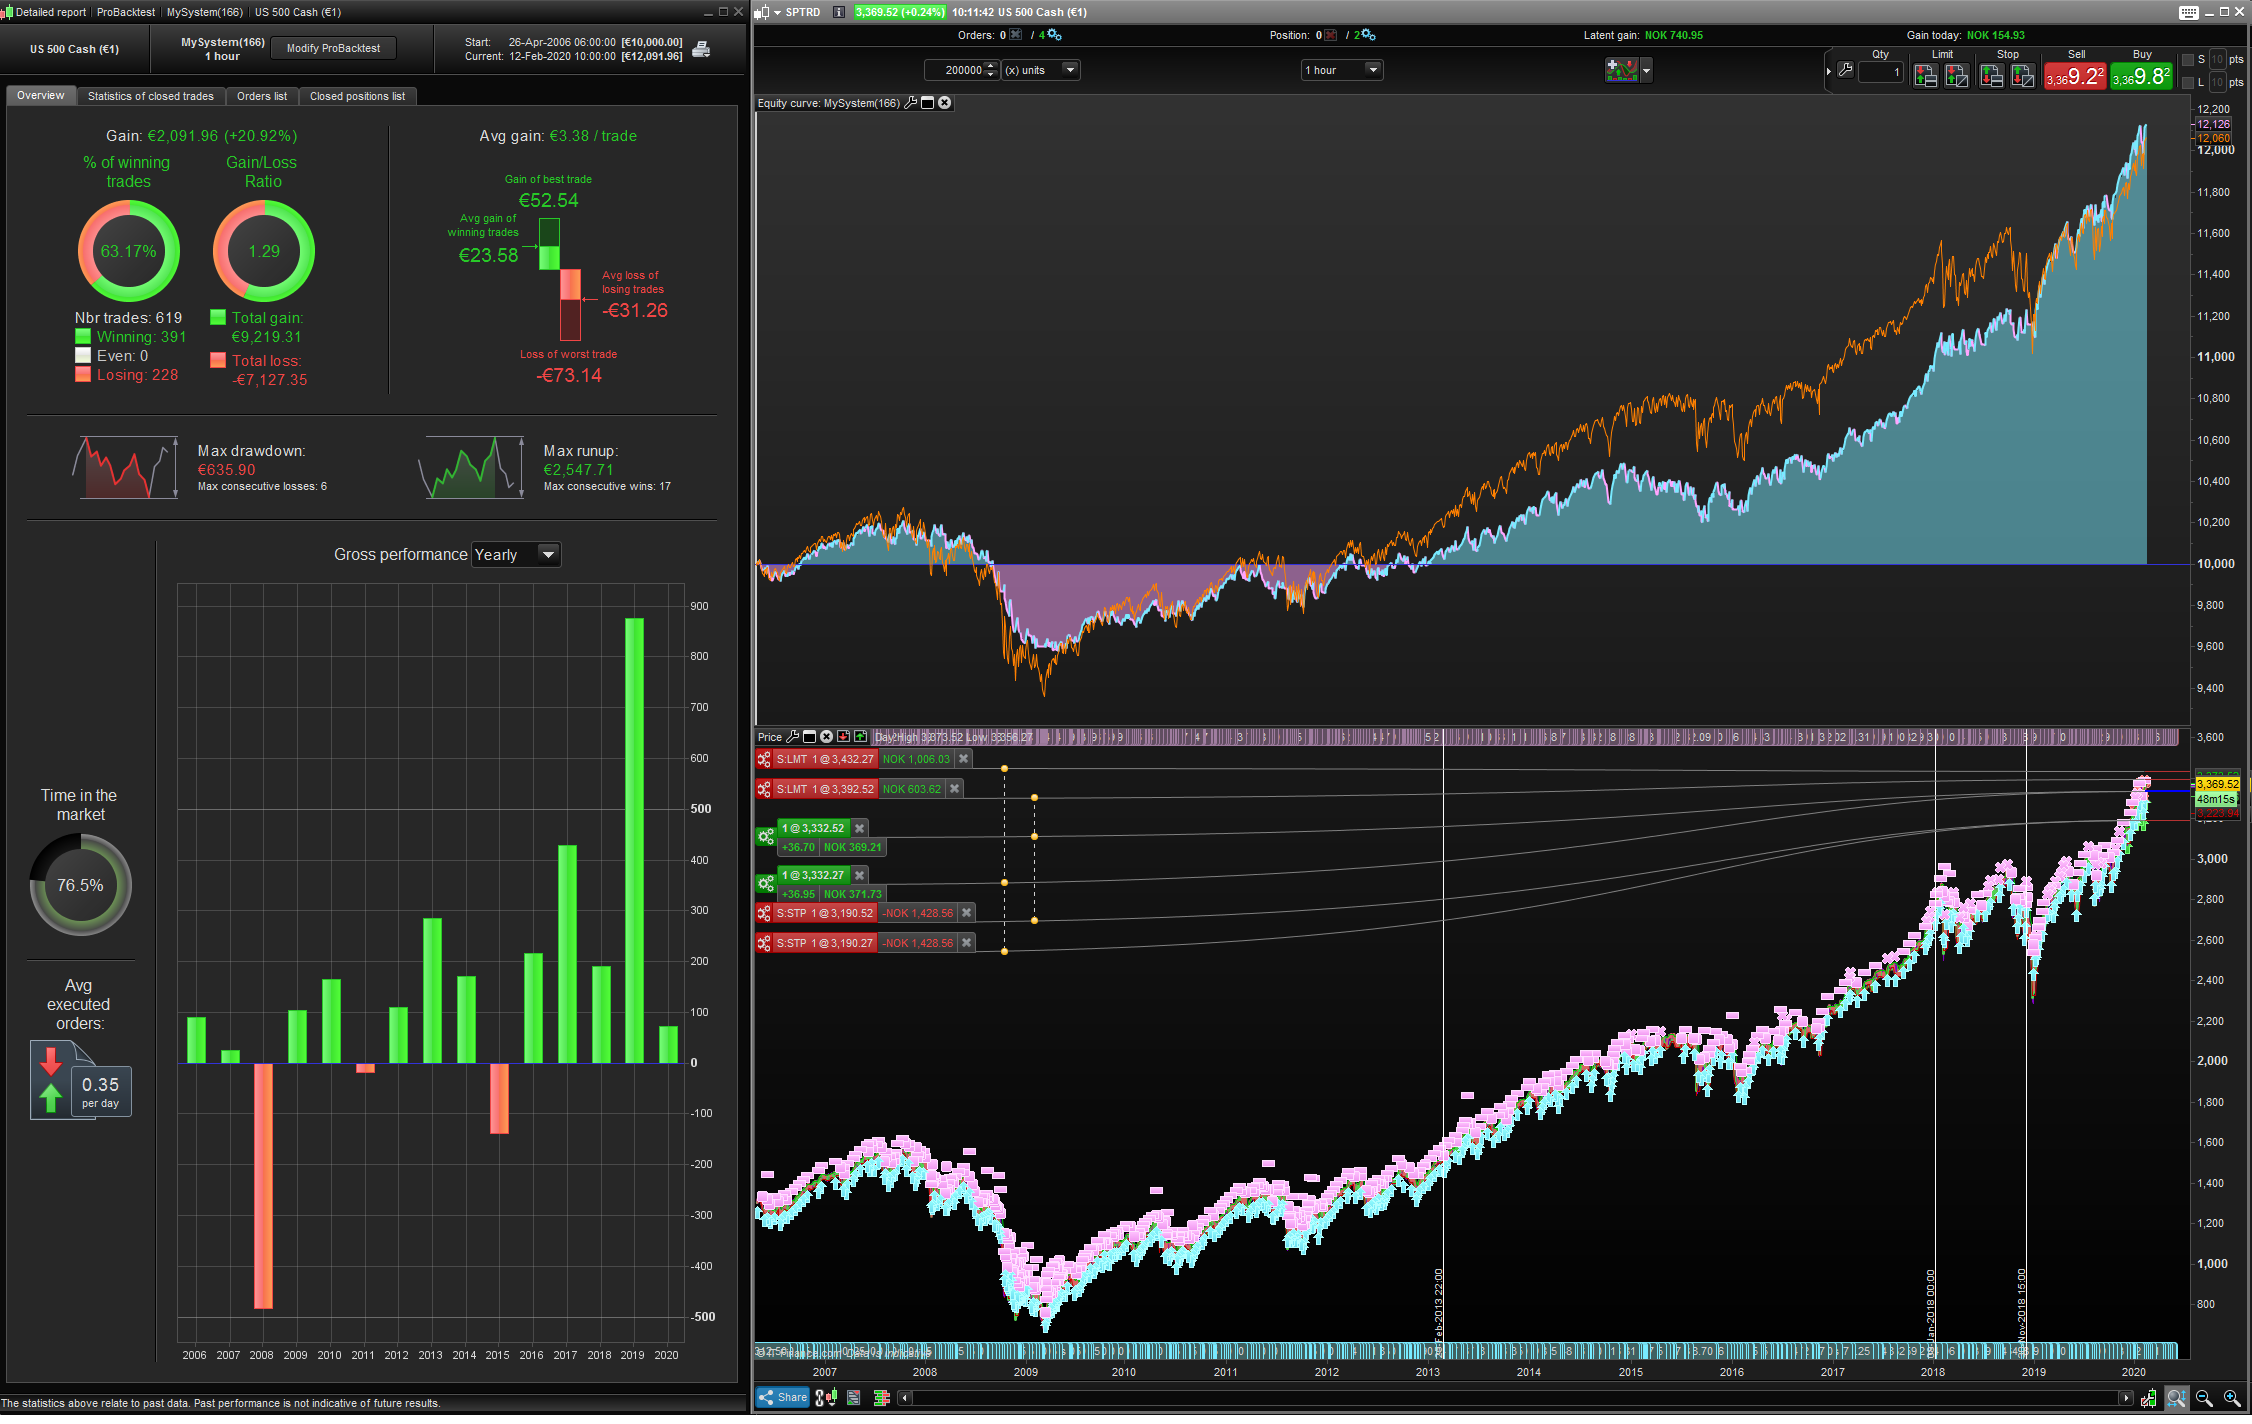
200K test with MM (had to adjust “max drawdown before quit” because it got stopped out (-25% drawdown) during 2008 crash
Do you want me to test with different MM? Send me the code/post code here, ill apply it to a 200K test
Here is without MM: (compared to buy n hold = orange line)
Hi
the graph of the underlying product and the system are remarkably similar without money management, did you use a position size of one as it looks like the system under performed the underlying asset in the image without MM
Thanks
Ruark
For me there are two factors that a strategy must achieve:
- Make more money than buy and hold.
- Have less drawdown than buy and hold.
I don’t mind if it only does one of these and not both of them as they are a balance of risk and reward. To beat the market I think more risk is necessary which leads to more draw down which is fine if you can afford it. Making less money than buy and hold is fine too as long as the drawdown is minimal and so the risk of going bust minimal.
That 200k equity curve fails to hit the mark on either point for me.
Thanks @jebus89 for the 200k test. Did not handle the 2008 crash at all well, but this is mostly because the 25% panic button had been removed. If that were set to, say 15% or whatever you feel comfortable with in case of a crash, then most of it would have been avoided – it is a part of the code and it’s there for a reason! Even without that though, in real life, any sensible person would have gone to cash before it truly tanked, it’s not as if no one knew there was a crash going on. Better would be if the algo handled reversals more effectively than just buying on every bounce and getting stopped out for 2.2% over and over…
Good news is that once the recovery took hold it does make money from 2013, 3 years OOS from the data I had to work with. The 100k optimization beats a buy and hold over that period by about 25%.
That 200k equity curve fails to hit the mark on either point for me.
Are we looking at the same graph? In 2009 the buy and hold line is way below the system line, ie greater drawdown. From 2006 to date, the SP moved 2118 points; the system made 2096 points. Not much in it, esp considering we’re looking at 10 years OOS. And, to repeat what I’ve said above, the ‘% drawdown to quit’ had been disabled. In the real world it would have done exactly what it was there for.
Hmm, I wonder if we know who wrote that part of the Money Management? 😉
Yes – draw down for both B and H and the strategy is terrible and it does not make more money than B and H and was under performing the B and H for most of the back test so in my mind you might as well just buy an ETF of the index. Your capital will be far safer than spread betting with it.
Yes a fuse would help – but then you have to decide when it is a good idea to go back in and start trading again. So in reality B and H of an ETF would be far easier and result in a better return.
A strategy has got to good to go live not do almost the same thing as the index!
Yes – the creator of that money management snippet was clearly a very clever chap – possibly very good looking too I would guess.
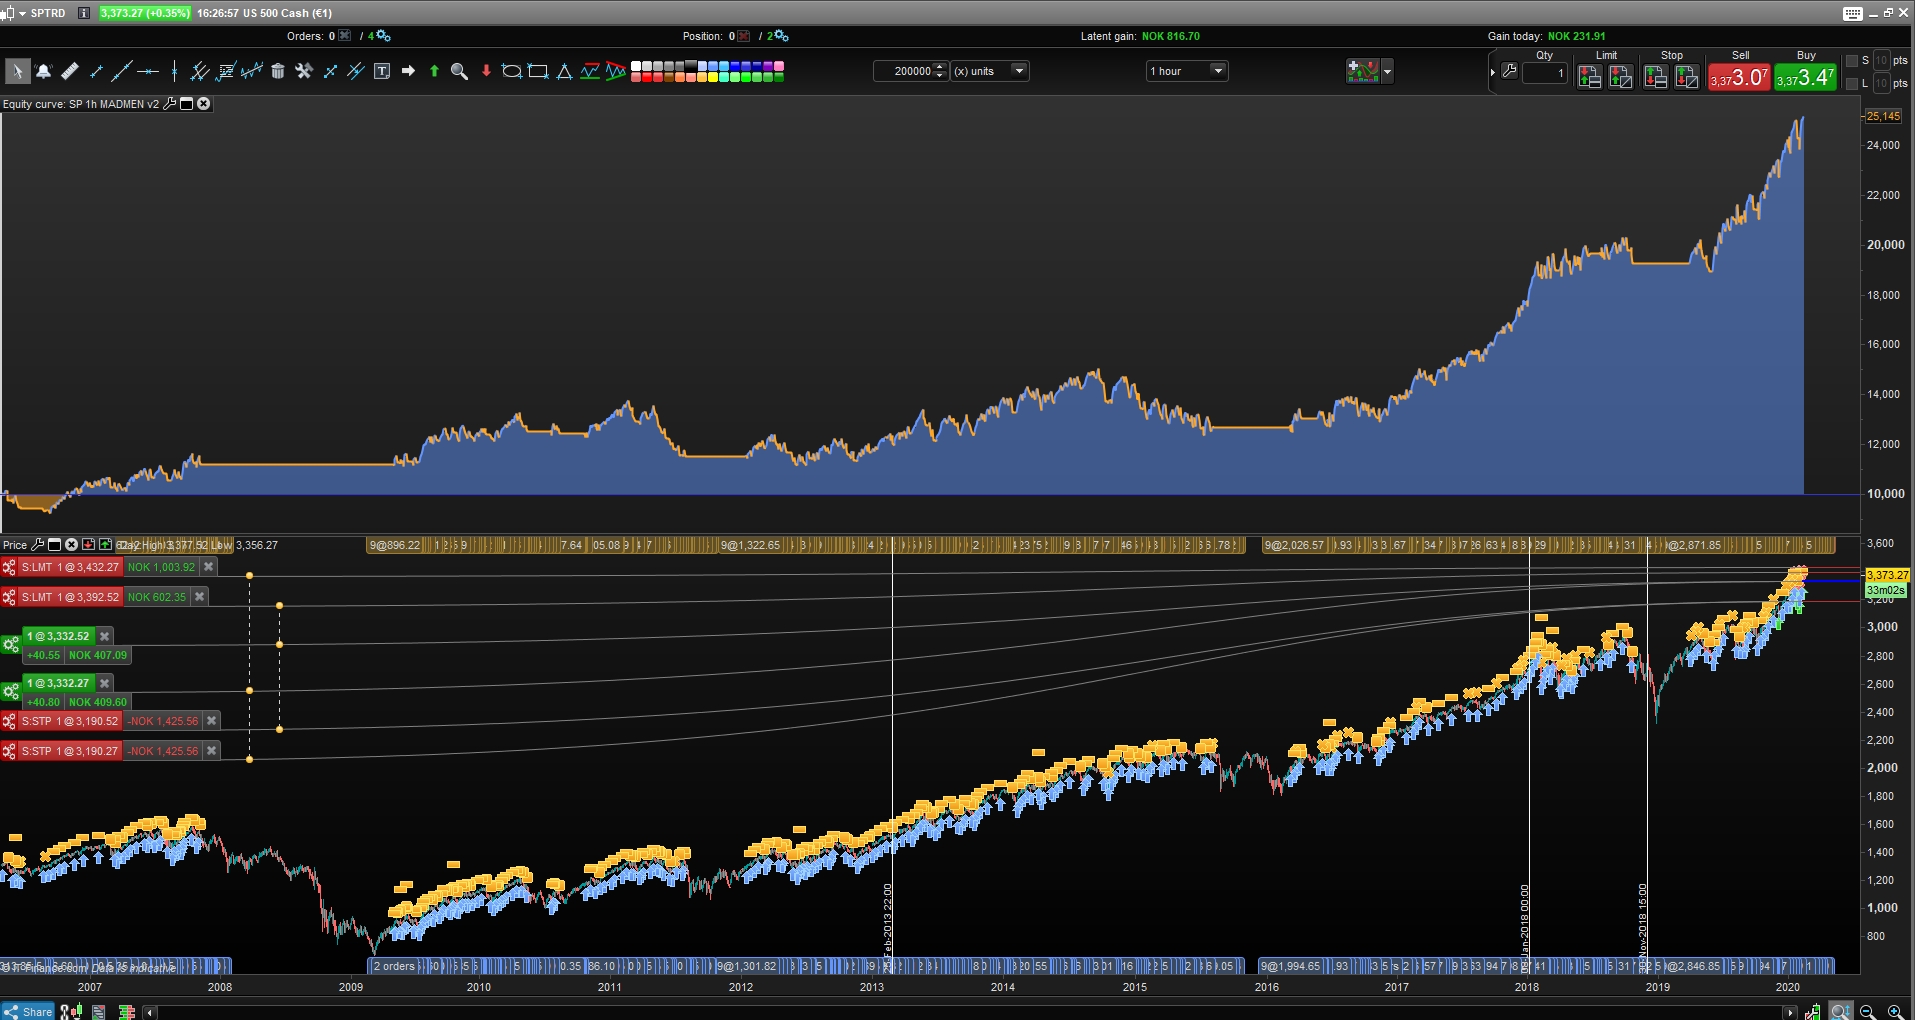
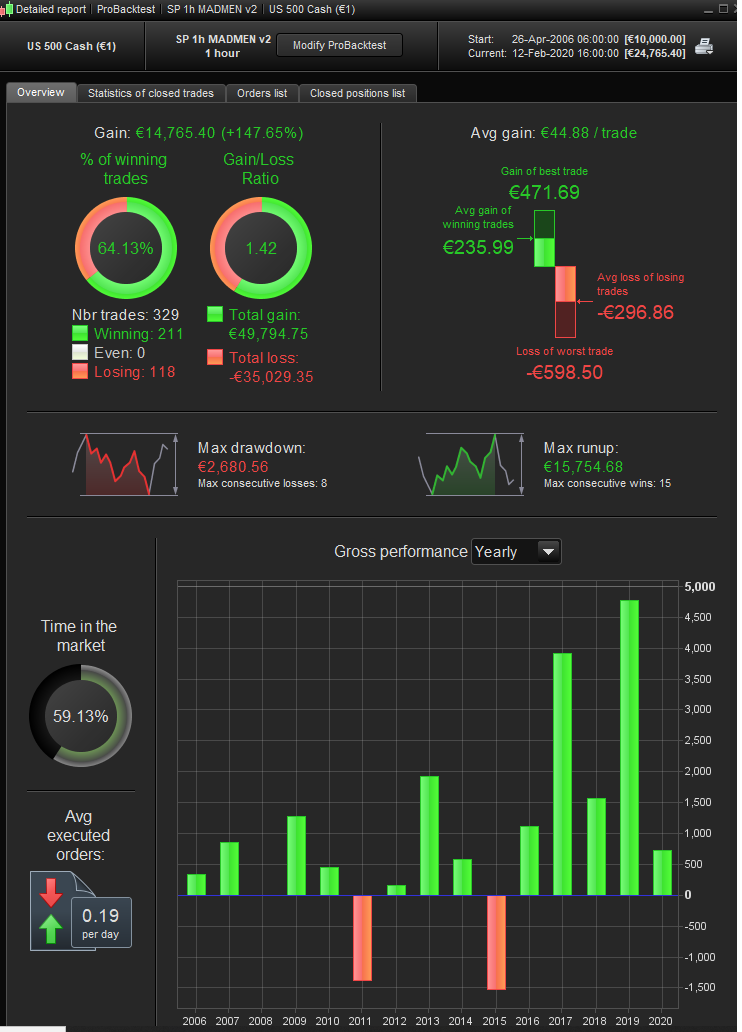
@jebus89 would you mind running this one over 200k, I added an MA 20 on a weekly TF – should shut it down for the whole of 2008, back on in May 2009 … in theory.
Tusen takk! That takes care of the nasty Lehman Bros drama. Still room for improvement but not too bad for 10 years OOS. And it didn’t trigger the 25% drawdown to quit?