MACD divergence indicator with histogram

Viewing 2 posts - 1 through 2 (of 2 total)
  • Author
    Posts
  • #149838 quote
    Oliviertrader2020Oliviertrader2020
    Participant
    Average

    Hello,

    Sorry for this basic question but I’m switching from manual to automatic trading recently.

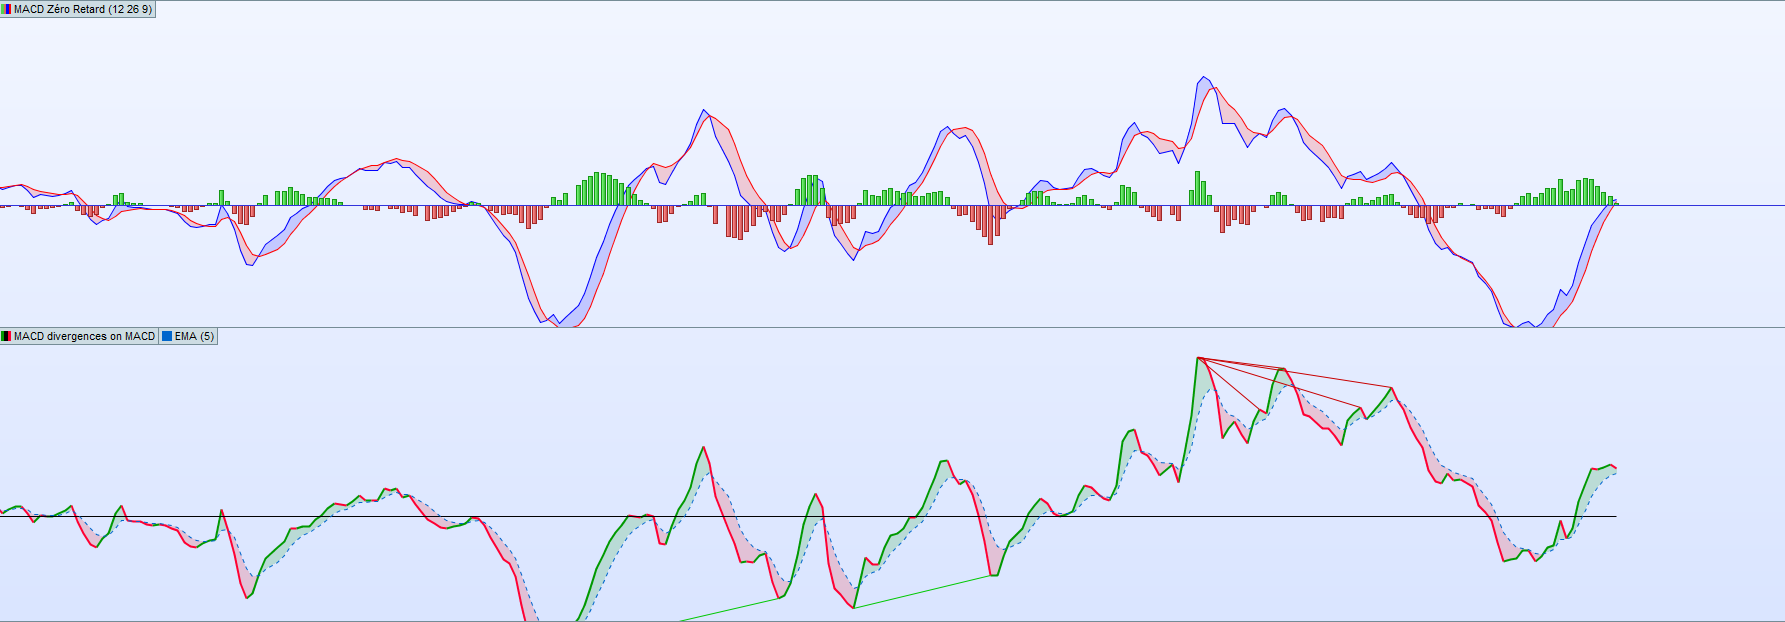
    When I trade manually, I use for one of my strategies a divergence indicator on RSI (with a support or a resistance) and a MACD zero lag as a trigger (using the histogram to take the reversal).

    I try to code an indicator that combines these 2 functions.

    For this I used the MACD divergence indicator from Jose7674 (https://www.prorealcode.com/prorealtime-indicators/macd-divergences-on-price-and-indicator/).

    On line 11, I modified the variables of the Exponential Average (to make it a version close to zero lag), then I added directly on the graph of the indicator an exponential AVerage [5].

    I tried different codes to add a histogram as on the zero lag but I have the impression that it is not possible to return the discrepancies and a histogram.

    Note that the histogram should not indicate when there is a discrepancy, but when the MACD is higher than the EMA5 I added (as the MACD zero lag on the graph)
    Does anyone have the solution?

    /////////////////////////////////////////////
    
    // MACD divergences on MACD
    // by Jose Callao
    // twitter @jose7674
    // Use this indicator in a new window
    
    N=40///N is the number of bars to look back for a divergence. Normal values are 20-40. Must be the same in both indicators
    
    //using any other indicator is as easy as changing the values
    miMACD = exponentialAverage[5](close) - exponentialAverage[12](close)


    IF (BarIndex > 10+1+N) THEN
    
    ///divergencia bajista
    IF (miMACD[1]>miMACD AND miMACD[1]>miMACD[2]) THEN
    extremum2=miMACD[1]
    extremum1=highest[N](miMACD)
    
    preciomax2=close[1]
    preciomax=Highest[N](close)
    
    IF(extremum2<extremum1 AND preciomax2>preciomax[1]) THEN
    for i=1 to N
    if mimacd[i]=extremum1 then
    zz=i
    
    drawsegment (barindex[1], mimacd[1], barindex[zz], mimacd[zz]) coloured(200,0,0)
    endif
    next
    
    endif
    endif
    
    ///divergencia alcista
    IF (miMACD[1]<miMACD AND miMACD[1]<miMACD[2]) THEN
    extremum22=miMACD[1]
    extremum11=lowest[N](miMACD)
    
    preciomin2=close[1]
    preciomin=lowest[N](close)
    
    IF(extremum22>extremum11 AND preciomin2<preciomin[1]) THEN
    for i2=1 to N
    if mimacd[i2]=extremum11[1] then
    zz2=i2
    
    drawsegment(barindex[1], mimacd[1], barindex[zz2], mimacd[zz2]) coloured(0,200,0)
    endif
    next
    ENDIF
    
    ENDIF
    endif
    
    return mimacd as "MACD", 0 as "0"
    Macd-histogram.png Macd-histogram.png
    #154939 quote
    robertogozzirobertogozzi
    Moderator
    Legend

    The standard histogram is:

    MACDHistoGram = MACD[5,12,9](close)    //histogram    (9 or whatever else)

    which is missing in your code, but you can easily add it at line 12, then return it at line 59.

Viewing 2 posts - 1 through 2 (of 2 total)
  • You must be logged in to reply to this topic.

ProRealAI ProRealAI New

Stuck on this ProBuilder code?

Describe what this topic is trying to build, in plain English, and ProRealAI writes the ProRealTime™ indicator, screener or system for you.

Available in 7 languages
Try ProRealAI

MACD divergence indicator with histogram


ProBuilder: Indicators & Custom Tools

New Reply
Summary

This topic contains 1 reply,
has 2 voices, and was last updated by robertogozzirobertogozzi
5 years, 8 months ago.

Topic Details
Forum: ProBuilder: Indicators & Custom Tools
Language: English
Started: 11/08/2020
Status: Active
Attachments: 1 files
ProRealCode ProRealCode
Loading...