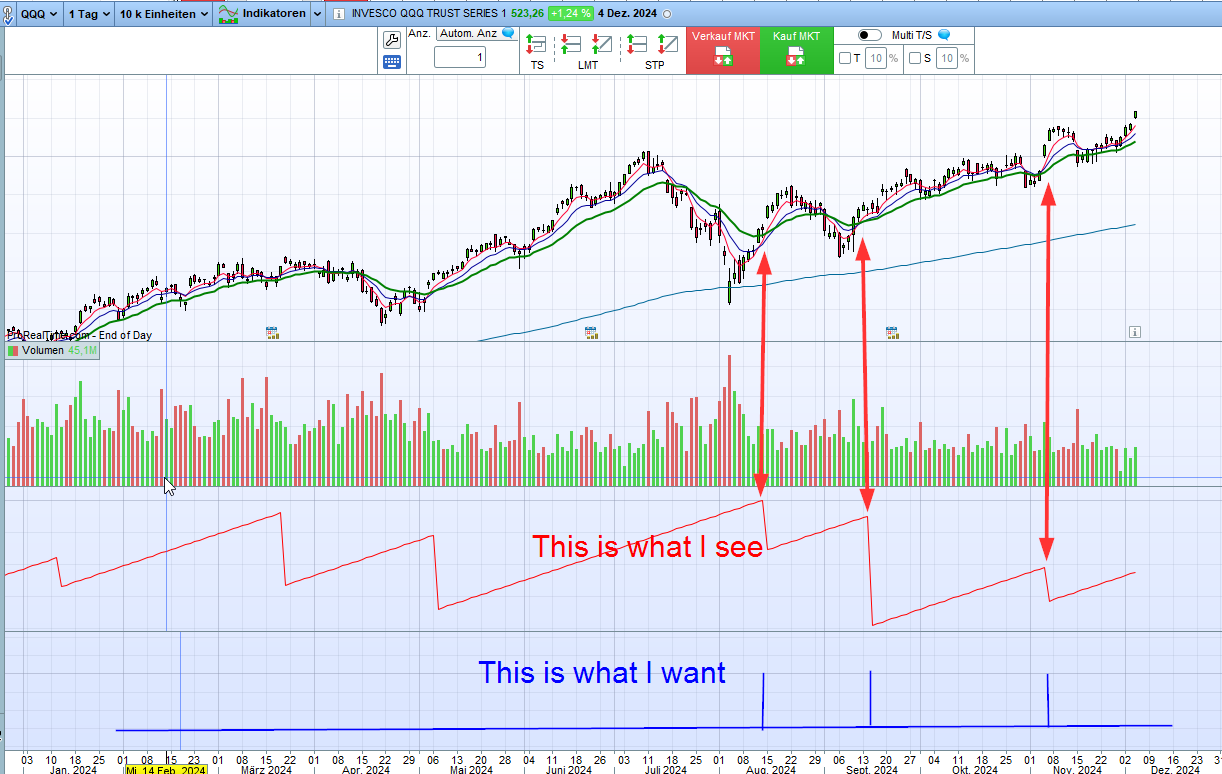
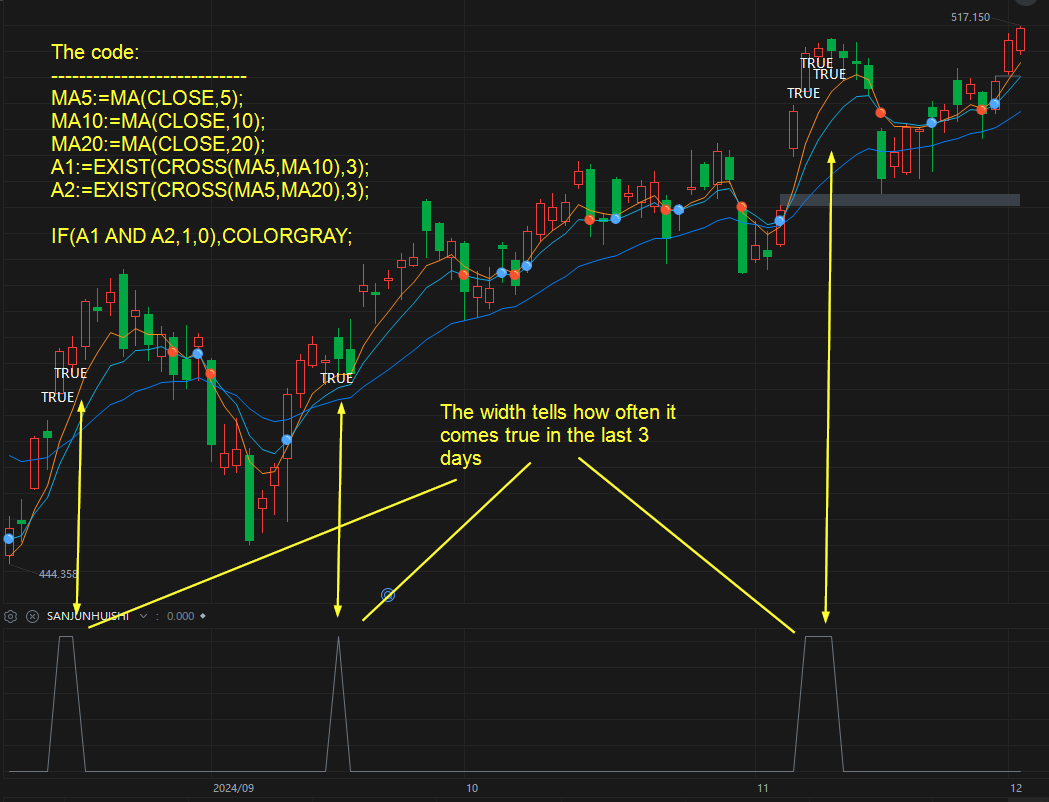
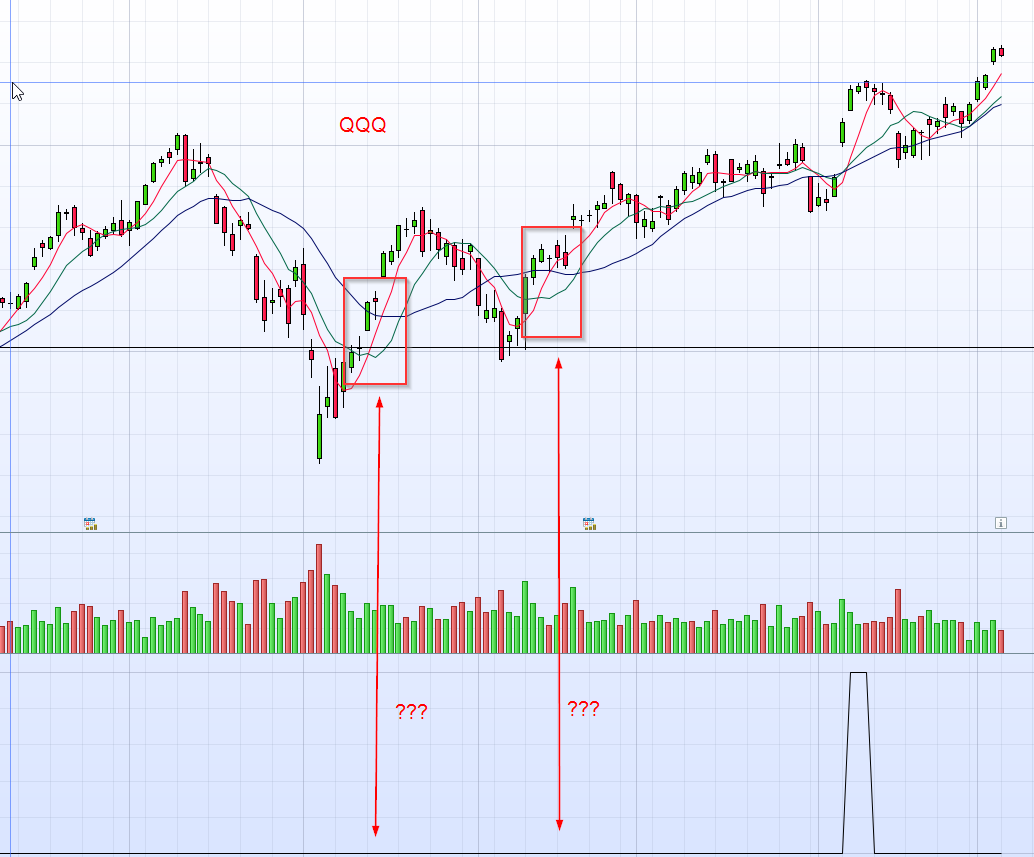
Here’s an example of using BARSSINCE and SUMMATION. This may not be the only way to do this.
defparam drawonlastbaronly = true
//constants
daysBack = 1 // number of days back or maximum bars in chart!
// indicators
sma5 = average[5,0](close)
sma10 = average[10,0](close)
// crossover condition
c = sma5 crosses over sma10
// offset to last crossover
Clast = barssince(c,0)
// crossover bar
Xbar = (barindex-Clast)
//drawtext("#Xbar# crossovers",0,-60)anchor(top,xshift,yshift)
// threshold limit bar
Lbar = barindex - (barssince(day<>day[1],daysBack-1)-1)
//drawtext("#Lbar# threshold limit bar",0,-60)anchor(top,xshift,yshift)
// drawing!
// if theres at least one crossover after threshold limit then display text
if Xbar > Lbar and cLast > -1 then
// draw last crossover line
drawVline(Xbar) coloured("red") style(dottedline,1) // crossover line
// draw text
bi = barindex // as a user variable
dif = Xbar-var // difference between xover offset and threshold
drawtext("Threshold at bar #var# SMA5 last crossed over SMA10 at bar #Xbar# , #dif# bars from threshold ",0,40, dialog,standard,20)anchor(bottom,xshift,yshift)
drawtext("Also, last crossed over is #Clast# bars back from current bar #bi# ",0,20, dialog,standard,20)anchor(bottom,xshift,yshift)
endif
// draw threshold limit line
var = barindex - (barindex - Lbar) // threshold bar
drawVline(var) style(dottedline,1) // threshold line
// number of crossovers sine threhold bar
if barindex > var then
sum = summation[barindex-var](c)
drawtext("#sum# crossovers in range",0,-30)anchor(top,xshift,yshift)
Xover = summation[barindex-var](c) > 0
if Xover = 1 then
drawtext("#Xover# YES! ",0,-60)anchor(top,xshift,yshift)
else
drawtext("#Xover# NO! ",0,-60)anchor(top,xshift,yshift)
endif
endif
return sma5 coloured("red") as"sma5" ,sma10 coloured("lime") as"sma10",close style(dottedline,1)