Salve a tutti,
scrivo per chiedere se gentilmente qualcuno può aiutarmi a trovare il corretto settaggio per individuare le linee si supporto e resistenza sui grafici.
io ho queste impostazioni di default e vorrei chiedere se sono valide o possono essere migliorate. Grazie
DEFPARAM CalculateOnLastBars = 1000 // To calculate the lines swing we take into consideration only the latest X candles
n = 20 // highest and lowest period for support/resistance fetch
tolerance = 5 // should be expressed in points) if there are two (or more) lines that are close to me, then you have to draw a center line
lookback = 10 // period lookback to confirm support and resistance areas
showSupport = 1//(0=false , 1=true)
showResistance = 1 //(0=false , 1=true)
Grazie mille, per la ricerca
DEFPARAM CalculateOnLastBars = 350 // To calculate the lines swing we take into consideration only the latest X candles

n = 20 // highest and lowest period for support/resistance fetch
tolerance = 5 // should be expressed in points) if there are two (or more) lines that are close to me, then you have to draw a center line
lookback = 10 // period lookback to confirm support and resistance areas
showSupport = 1//(0=false , 1=true)
showResistance = 1 //(0=false , 1=true)

once linear = 0
once lineas = 0
once newlinear = 0
once newlineas = 0
once newlinearr = 0
once newlineass = 0

if showResistance then
resistance = highest[n](high) // resistance ( massimi precedenti dove i prezzi sono stati respinti)

if resistance[n-lookback] = resistance[1] then
linear = (resistance[1] + linear) / 2
else
linear = linear
endif

if linear[2] = linear[1] and linear[1] = linear then
newlinear = linear
endif

i = 0
valsup = newlinear + tolerance*pointsize
valinf = newlinear - tolerance*pointsize

while i <> 350 do
if newlinear[i] = 0 then//aiuta ad accorciare il ciclo
break
endif
cond = (newlinear[i] <= valsup and newlinear[i] >= valinf) or (newlineas[i] <= valsup and newlineas[i] >= valinf)
if cond then
newlinearr = (newlinear[i] + newlinear)/2
savedbar = barindex//[i]
endif
i = i+1
wend

drawhline(newlinearr) coloured(0,125,255)
if newlinearr<>oldtextr then
drawtext("▼ #newlinearr#",savedbar,newlinearr)
oldtextr=newlinearr
endif
endif

if showSupport then
support = lowest[n](low) // support ( minimi precedenti dove i prezzi sono stati rimbalzati)

if support[n-lookback] = support[1] then
lineas = (support[1] + lineas) / 2
else
lineas = lineas
endif

if lineas[2] = lineas[1] and lineas[1] = lineas then
newlineas = lineas
endif

i = 0
valsup = newlineas + tolerance*pointsize
valinf = newlineas - tolerance*pointsize

while i <> 350 do
if newlineas[i] = 0 then//aiuta ad accorciare il ciclo
break
endif
cond = (newlineas[i] <= valsup and newlineas[i] >= valinf) or (newlinear[i] <= valsup and newlinear[i] >= valinf)
if cond then
newlineass = (newlineas[i] + newlineas)/2
savedbar = barindex[i]
endif
i = i+1
wend

drawhline(newlineass) coloured(0,125,255)
if newlinearr<>oldtexts then
drawtext("▲ #newlineass#",savedbar,newlineass)
oldtexts=newlineass
endif
endif

RETURN
Ciao Roberto, tra i link che precedentemente hai riportato sopra, ho trovato questo codice che mi piace e vorrei chiederti gentilmente delle informazioni per quanto riguarda queste linee di swing se le utilizzo su dei time frame diversi, ad esempio ad 1 ora o 5 minuti dovrei cambiare il calcolo delle ultime barre che è impostato a 350 o posso lasciarli impostati cosi come sono di default.
Grazie per il supporto e buon giornata.
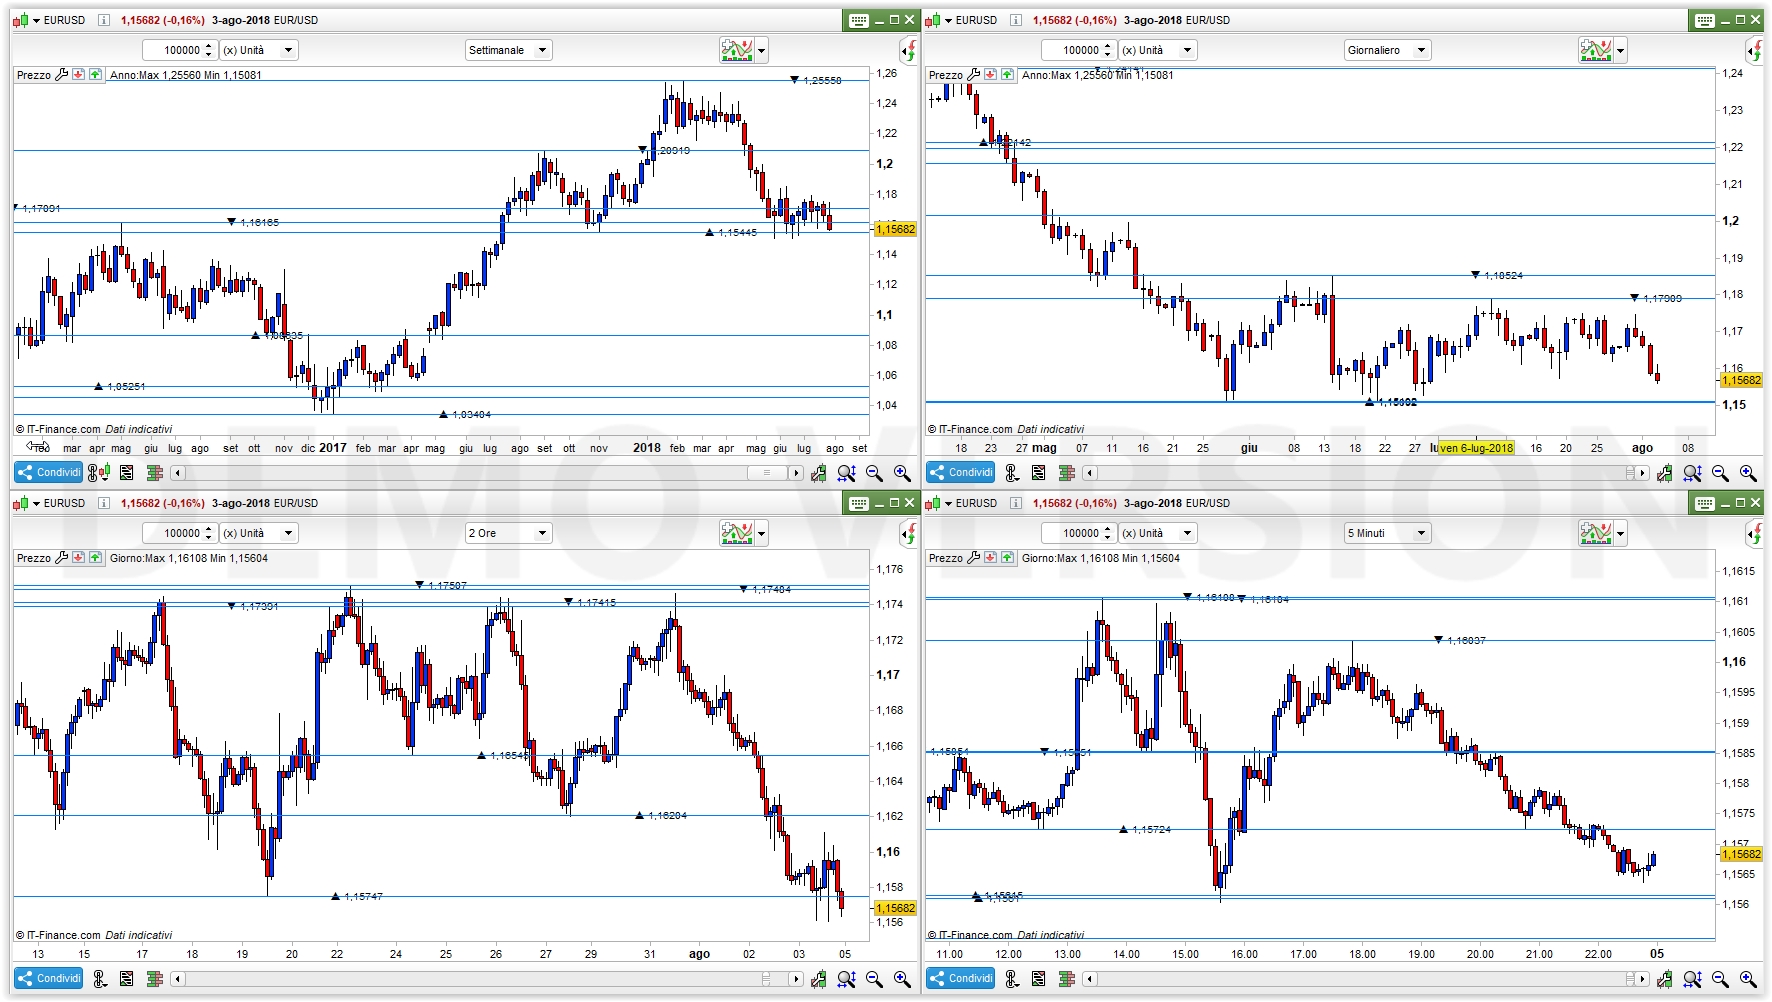
L’ho provato su Eur/Usd, con 4 diversi TF, usando lo stesso identico settaggio, e mi sembra funzioni perfettamente così senza bisogno di adattare settaggi e periodi a ciascun TF.