In the news it is often commented on how many new daily highs or new daily lows a market has made within the last year so I thought I would try to create an indicator to display this. I post it here just in case if it is of any interest to other forum members.
First of all the code works out how many candles there has been in the last calendar year/12 months. It then counts how many new highs or new lows have been made during this calendar year. Each time a new high or a new low is achieved that value is set as the benchmark for checking for future new highs and lows.
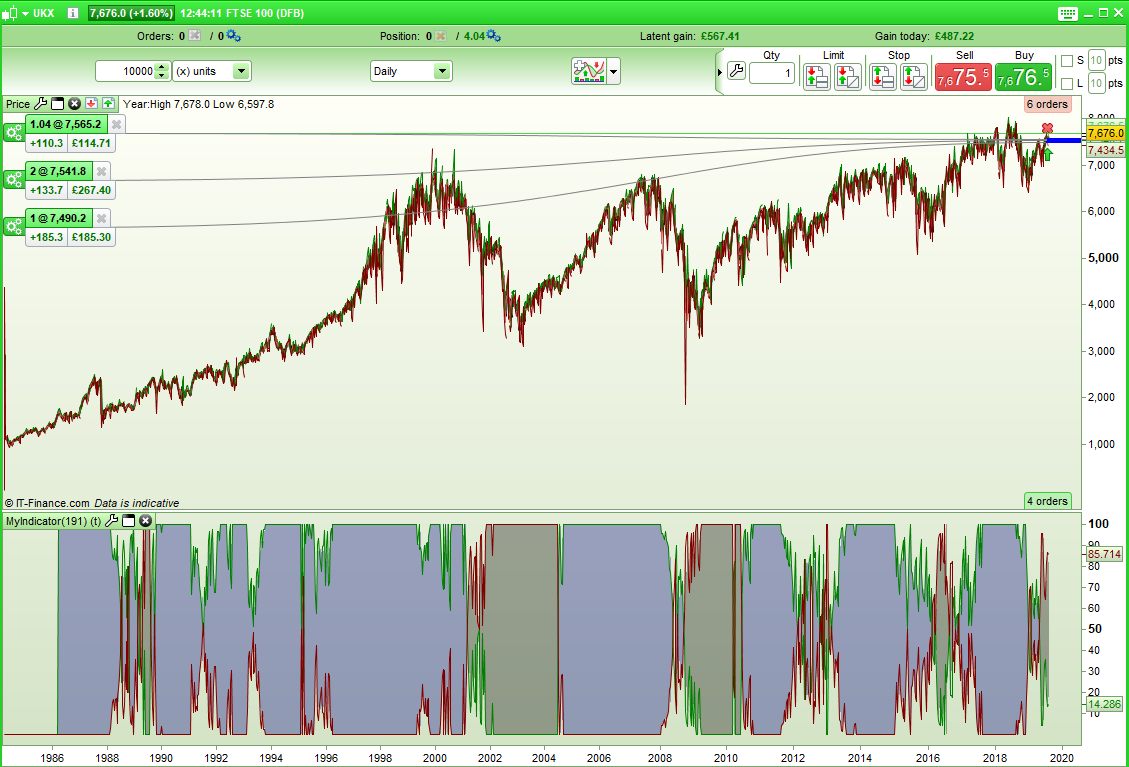
The results can be displayed as just a straight forward count of new highs and new lows or as a percentage. This percentage is calculated as the number of new highs (or new lows) as a percentage of the total combined number of new highs and new lows.
Use the indicator on daily charts. It should work on other time frames but you will obviously need at least one calendar years worth of data and it will output on for example a 1 hour chart the number of 1 hour new highs and new lows and not daily highs and lows. Be warned that it is very, very slow to calculate so set it off and go and make a cup of tea! Perhaps you might consider using the ‘calculateonlastbars’ to reduce the time by only testing on the latest data. There is most likely a much prettier and faster way to achieve the same thing but this version is all I’ve got at the moment!
The results can be analysed in many ways – if new highs represents 100% of new highs and lows then you might consider it to be a strong bull market or alternatively you might consider it to be an overbought market – as ever your interpretation is totally up to you!
//defparam calculateonlastbars = 1000

percentage = 1  //1=display result as a percentage of all new highs and lows. 0=count of new highs and new lows

once chartstart = opendate //get start date of chart

startdate = opendate - 10000 //Date one year ago

//Count how many candles in the last year
if opendate - chartstart >= 10000 then //Check that we have at least one year
for j = 1 to barindex
if opendate[j] <= startdate then
p = j
break
endif
next

//Count the number of new highs and lows in the last year
NewHighs = 0
NewLows = 0
for a = p-1 downto 0

//Set startig high and low values
if a = p-1 then
hh = high[a + p - 1]
ll = low[a + p - 1]
endif

//Check for new high
if high[a] > hh then
NewHighs = NewHighs + 1
hh = high[a] //Set new high as value to compare to
endif

//Check for new low
if low[a] < ll then
NewLows = NewLows + 1
ll = low[a] //Set new low as value to compare to
endif
next

//Calculate result as percentage or count of values
if percentage then
hhResult = (NewHighs / (NewHighs + NewLows)) * 100
llResult = (NewLows / (NewHighs + NewLows)) * 100
else
hhResult = NewHighs
llResult = NewLows
endif
endif

return hhResult coloured(0,128,0) as "New Highs", llResult coloured(128,0,0)as "New Lows"