lastmanstanding indicator
Hello
I was hoping that someone could change the last part of the code in Last Man Standing indicator to be a histogram rather than dots plotted on the screen
So that I could use the prorealtime backtesting software
I have tried but I have failed I was hoping for the Hminor bars and Lminor bars to be plotted as 0.2 – 0.2 and then the Hmajor bar and Lmajor to be plotted as 0.4 -0.4
Thank you
((atr=averagetruerange[14]
if barindex-hhminorbar=PeriodsInMinorSwing then
drawtext(“●”,hhminorbar,hhminorprice,Dialog,Bold,10) coloured(100,149,237)
endif
if barindex-llminorbar=PeriodsInMinorSwing then
drawtext(“●”,llminorbar,llminorprice/1,Dialog,Bold,10) coloured(100,149,237)
endif
if barindex-hhmajorbar=PeriodsInMajorSwing then
drawtext(“●”,hhmajorbar,hhmajorprice+atr/2,Dialog,Bold,20) coloured(128,0,128)
endif
if barindex-llmajorbar=PeriodsInMajorSwing then
drawtext(“●”,llmajorbar,llmajorprice-atr/2,Dialog,Bold,20) coloured(128,0,128)
endif

return EMA coloured(184,134,11) as “EMA”}}
EMA coloured(184,134,11) style(HISTOGRAM) as “EMA”
and here I add style (histogram)
>> For clarity of messages on ProRealCode’s forums, please use the “insert code PRT” button to separate the text of the code part! Thank you! << 🙂
Sorry I can’t get it to work and I don’t need the EMA it’s the bar text part that I wish to change so I have Incorporated the full code could you please change it for me I have tried I just keep running into snytex errors
//PeriodsInMajorSwing=13
//PeriodsInMinorSwing=5
//MovingAverageMethod=1
//MovingAveragePeriods= 55
// --- end of settings

EMA = average[MovingAveragePeriods,MovingAverageMethod](close)

hhminorprice=0
llminorprice=close*1000
for i = 1 to PeriodsInMinorSwing*2 do
if high[i]>hhminorprice then
hhminorbar = barindex[i]
hhminorprice = high[i]
endif
if low[i]<llminorprice then
llminorbar=barindex[i]
llminorprice=low[i]
endif
next

hhmajorprice=0
llmajorprice=close*1000
for i = 1 to PeriodsInMajorSwing*2 do
if high[i]>hhmajorprice then
hhmajorbar = barindex[i]
hhmajorprice = high[i]
endif
if low[i]<llmajorprice then
llmajorbar=barindex[i]
llmajorprice=low[i]
endif
next

atr=averagetruerange[14]
if barindex-hhminorbar=PeriodsInMinorSwing  then
drawtext("●",hhminorbar,hhminorprice,Dialog,Bold,10) coloured(100,149,237)
endif
if barindex-llminorbar=PeriodsInMinorSwing then
drawtext("●",llminorbar,llminorprice/1,Dialog,Bold,10) coloured(100,149,237)
endif
if barindex-hhmajorbar=PeriodsInMajorSwing then
drawtext("●",hhmajorbar,hhmajorprice+atr/2,Dialog,Bold,20) coloured(128,0,128)
endif
if barindex-llmajorbar=PeriodsInMajorSwing then
drawtext("●",llmajorbar,llmajorprice-atr/2,Dialog,Bold,20) coloured(128,0,128)
endif

return EMA coloured(184,134,11) as "EMA"
So you want the dots to be replaced with histogram in an indicator below the price chart?
Yes please that would be great if you could thank you
Here is the code that put the lastmanstanding indicator signals into an histogram below the price chart.
PeriodsInMajorSwing=13
PeriodsInMinorSwing=5
//https://www.prorealcode.com/topic/lastmanstanding-indicator
// --- end of settings


hhminorprice=0
llminorprice=close*1000
for i = 1 to PeriodsInMinorSwing*2 do
if high[i]>hhminorprice then
hhminorbar = barindex[i]
hhminorprice = high[i]
endif
if low[i]<llminorprice then
llminorbar=barindex[i]
llminorprice=low[i]
endif
next

hhmajorprice=0
llmajorprice=close*1000
for i = 1 to PeriodsInMajorSwing*2 do
if high[i]>hhmajorprice then
hhmajorbar = barindex[i]
hhmajorprice = high[i]
endif
if low[i]<llmajorprice then
llmajorbar=barindex[i]
llmajorprice=low[i]
endif
next

signal=0
//atr=averagetruerange[14]
if barindex-hhminorbar=PeriodsInMinorSwing  then
signal=1
r=100
g=149
b=237 //drawtext("●",hhminorbar,hhminorprice,Dialog,Bold,10) coloured(100,149,237)
endif
if barindex-llminorbar=PeriodsInMinorSwing then
signal=-1
r=100
g=149
b=237//drawtext("●",llminorbar,llminorprice/1,Dialog,Bold,10) coloured(100,149,237)
endif
if barindex-hhmajorbar=PeriodsInMajorSwing then
signal=2
r=128
g=0
b=128//drawtext("●",hhmajorbar,hhmajorprice+atr/2,Dialog,Bold,20) coloured(128,0,128)
endif
if barindex-llmajorbar=PeriodsInMajorSwing then
signal=-2
r=128
g=0
b=128//drawtext("●",llmajorbar,llmajorprice-atr/2,Dialog,Bold,20) coloured(128,0,128)
endif

return signal coloured(r,g,b) style(histogram)//EMA coloured(184,134,11) as "EMA"
Hello
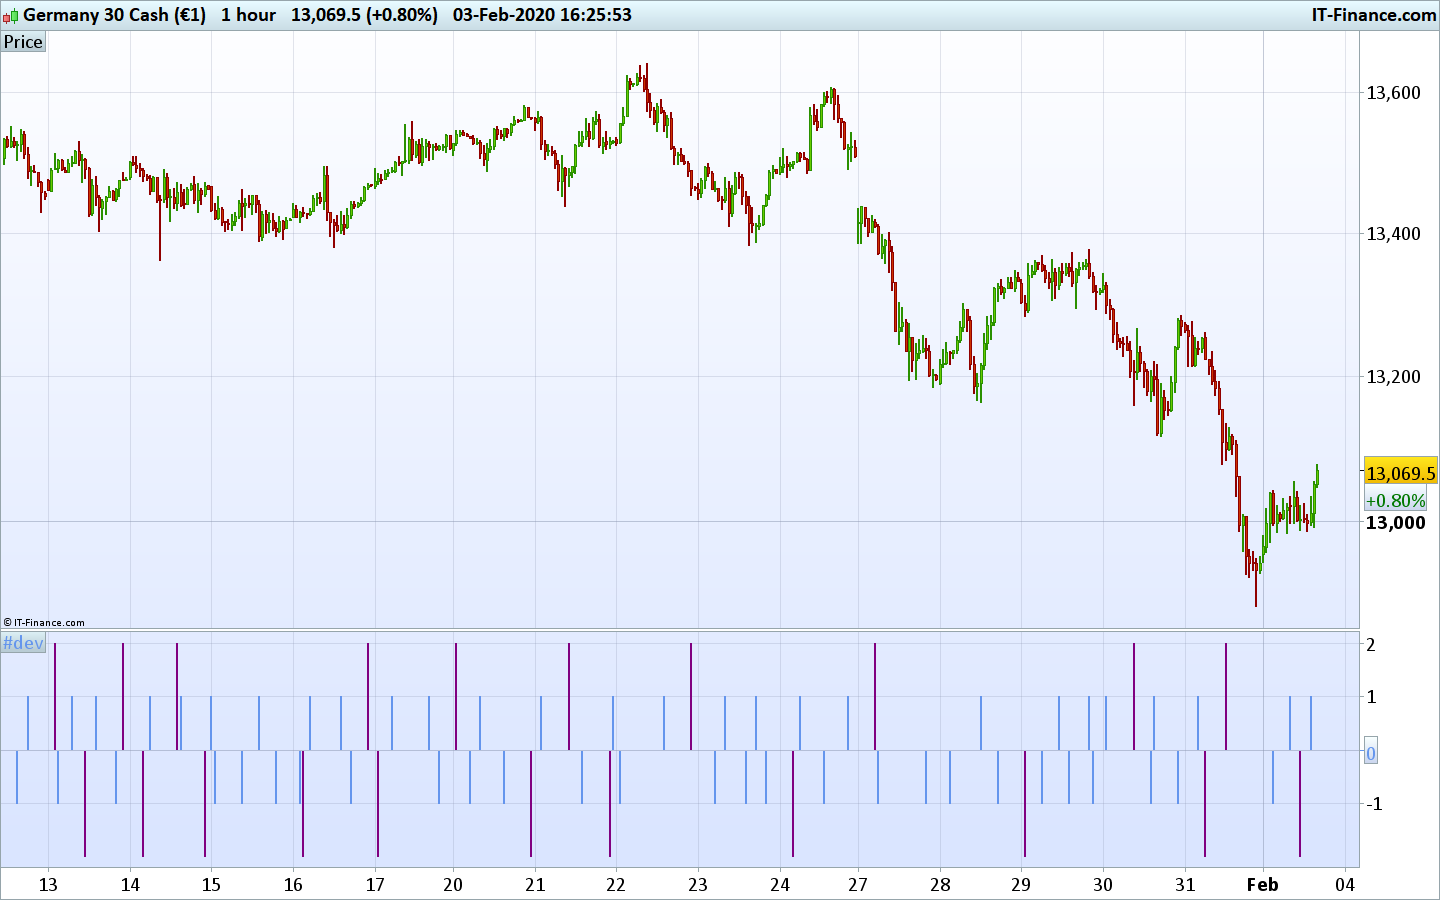
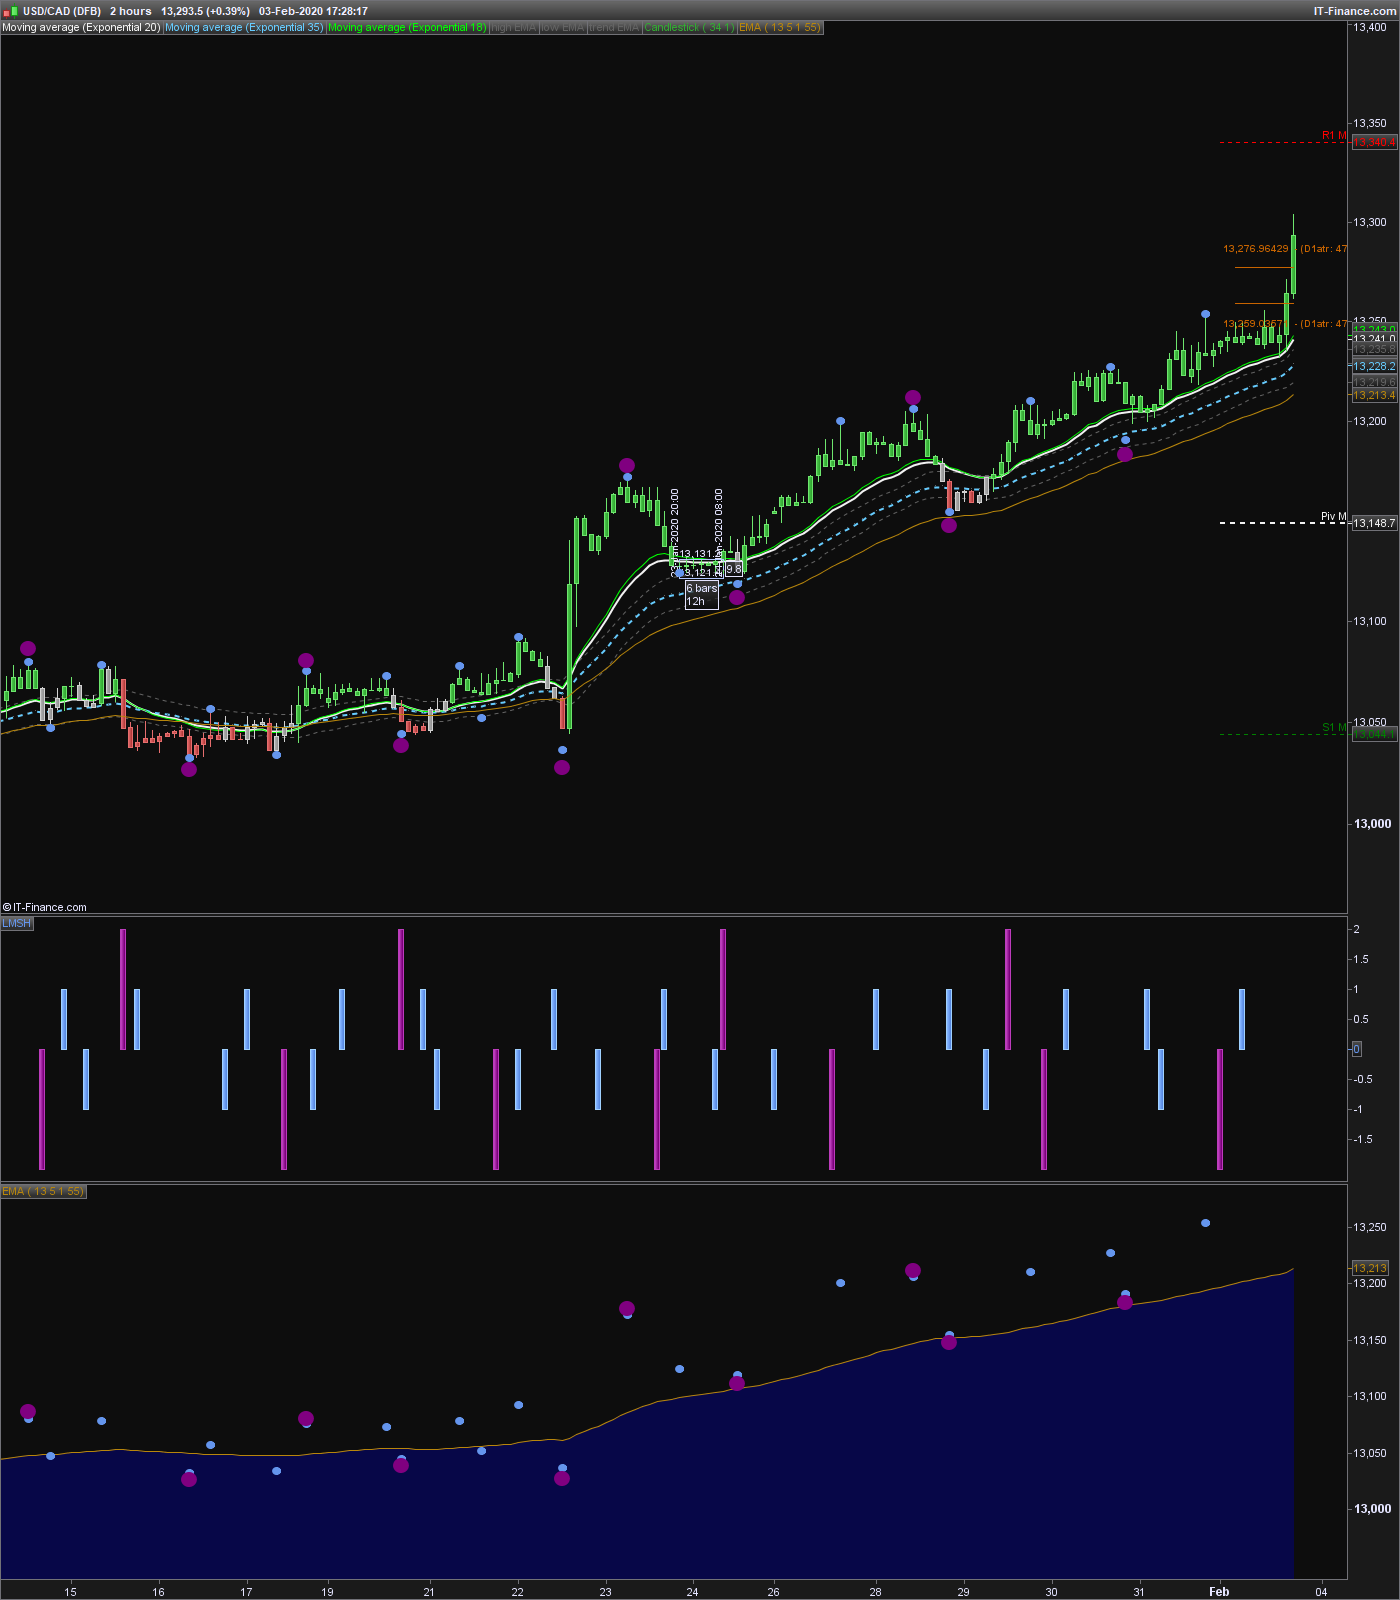
I am afraid that for some reason it’s not lining up correctly with the price bars I can put last man standing in a chart of its own which I’ve done i’ve also put the histogram version on the chart and then price and Last Man Standing and you can see from the picture something’s not right just to remind you you why need it as a histogram was for visual backtesting and programmable backtesting if that makes any sense.
as well do you if could be return as a line then change the line by the drop down menu might be better, But obviously one thing at a time and I do so appreciate all the help thank you
if c1 then
i=0.2
endif

if c2 then
i=-0.2
endif
return i as "LMS"
The result is normal since dots are painted afterwards in the past of the chart. It is indeed not possible to get such precise marks of tops and bottoms in real time 🙂
Good morning Nicolas
Oh right see I didn’t understand the code I tried to,
So it’s just marking the highs and lows in the past and then painting them I actually thought it was a reversal indicator