Please would you be able to convert the below code to prorealcode.
AMIBROKER code but looks like logic can be deduced and some details can be found in
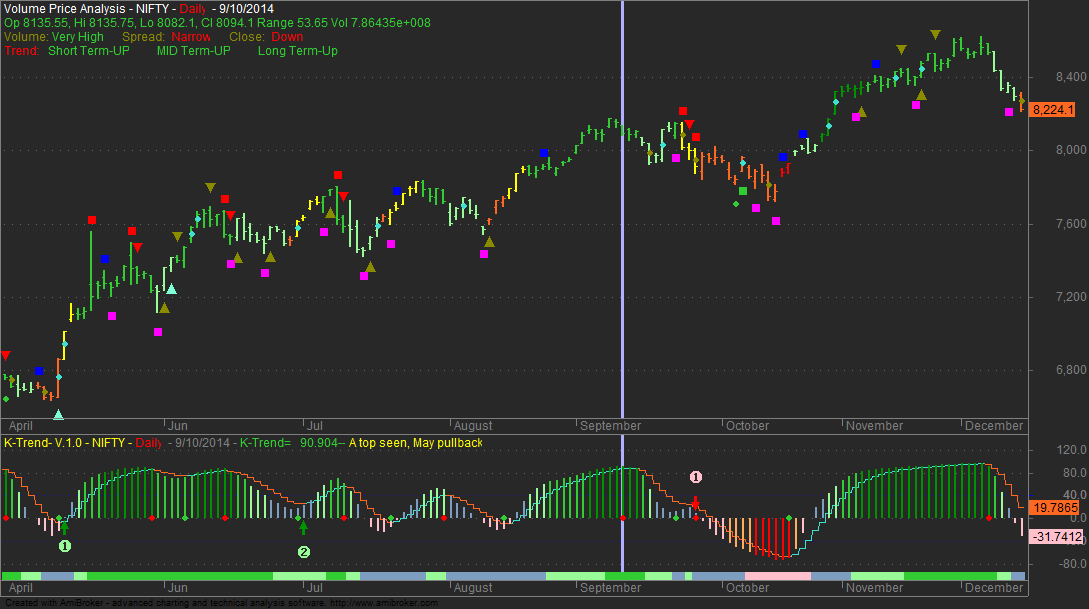
http://karthikmarar.blogspot.com/2015/05/the-k-trend-indicator.html
// Downloaded From https://www.WiseStockTrader.com
//||===================================================================================||
//|| K-Trend - V.1.0 -  by Karthikmarar                                                                                                                ||
//|| www.karthikmarar.blogspot.com                                                                                                                    ||
//|| Public release for personal use only.                                                                                                            ||
//|| Please do not commercialize this indicator in its original or modified form                                                    ||
//||===================================================================================||

_SECTION_BEGIN("KTrend");
SetChartOptions(0,chartShowArrows|chartShowDates);
_N(Title = StrFormat("{{NAME}} - {{INTERVAL}} {{DATE}} Open %g, Hi %g, Lo %g, Close %g (%.1f%%) {{VALUES}}", O, H, L, C, SelectedValue( ROC( C, 1 ) ) ));

T1 = Param("Momentum Period",5,0,100,1);
M1s=Param("1st MA Period short",13,0,30,1);
m1l=Param("1st MA Period long",40,0,100,1);
M2=Param("2nd MA Period",5,0,100,1);
UL= Param("Upper Limit",40,0,100,1);
LL= Param("Lower Limit",-40,-100,100,1);
Type = ParamList("MA Type", "EMA|AMA");
j= C-Ref(C,-T1);
// Ema based calculation
n=EMA(EMA(j,M1s),M2);
d=EMA(EMA( abs(j) ,M1s),M2);
KT1=100*n/d;
kt1s=EMA(kt1,6);
//Ama based calculation
fast = 2/(2+1);
slow = 2/(30+1);
dir=abs(Close-Ref(Close,-10));
vol=Sum(abs(Close-Ref(Close,-1)),10);
ER=dir/vol;
sc =( ER*(fast-slow)+slow)^2;
q1= AMA(j,sc);
q2=AMA(abs(j),sc);
kt2= 100*(EMA(q1,m2)/EMA(q2,m2));
kt2s=EMA(kt2,6);
GraphXSpace=20;
// MA  Selection
kt=IIf(Type=="EMA",kt1,kt2);
kts=IIf(Type=="EMA",kt1s,kt2s);
ktcolor=IIf(KT<-80,colorDarkRed,IIf(KT<-60,colorRed,IIf(KT<-40,colorLightOrange,IIf(KT<0,colorPink,
IIf(KT<40,colorLightBlue,IIf(KT<60,colorPaleGreen,IIf(KT<80,colorLime,colorGreen)))))));
Plot( kt, "KTrend", ktcolor, styleHistogram | styleThick   );
Plot( kts, "Signal line.", IIf(kts>kt,colorOrange,colorTurquoise), 512  | styleThick   );
Plot( kts+1, "", IIf(kts>kt,colorOrange,colorTurquoise), 512  | styleThick   );
PlotGrid(UL,colorBlue);
PlotGrid(LL,colorBlue);
//Long term ribbon
nl=EMA(EMA(j,M1l),M2);
dl=EMA(EMA( abs(j) ,M1l),M2);
KTl=100*nl/dl;
KTl_color=IIf(KTl<-80,colorDarkRed,IIf(KTl<-60,colorRed,IIf(KTl<-40,colorLightOrange,IIf(KTl<0,colorPink,IIf(KTl<40,colorLightBlue,IIf(KTl<60,colorPaleGreen,IIf(KTl<80,colorLime,colorGreen)))))));
Plot( 5,"Ribbon",KTl_color,styleOwnScale|styleArea|styleNoLabel, -0.5,100 );
_SECTION_END();
//------------------------------------------------------------------------------------------
//                     Analysis
//---------------------------------------------------------------------------------------
_SECTION_BEGIN("RAVI");
P1 = Param("Short Period",7,0,100,1);
P2 = Param("Long Period",65,0,100,1);
L1=Param("Threshold",4,2,10,1);
U= MA(C,P1)-MA(C,P2);
R=100*U/MA(C,P2);
// check if RAVI is moving up
Rup=R >Ref(R,-1) AND Ref(R,-1)>Ref(R,-2);
_SECTION_END();
//---------------------------------------------------------------------------------------------
_SECTION_BEGIN("LR Slope");
RPDS=ParamList("R2 Period", "5|10|14|20|25|30|50|60|120" );
R2PDS=IIf(rpds=="5",5,IIf(rpds=="10",10,IIf(rpds=="14",14,IIf(rpds=="20",20,IIf(rpds=="25",25,IIf(rpds=="30",30,IIf(rpds=="50",50,IIf(rpds=="60",60,120))))))));
R2=Correlation(Cum( 1 ),C,r2pds)*Correlation(Cum( 1 ),C,r2pds);
Sp=LinRegSlope(C,r2pds);
rsp=IIf(sp>=Ref(sp,-1) AND Ref(sp,-1)>=Ref(sp,-2),1,0);
fsp=IIf(sp<=Ref(sp,-1) AND Ref(sp,-1)<=Ref(sp,-2),1,0);
Crit=IIf(R2PDS==5,.77,IIf(R2PDS==10,.40,IIf(R2PDS==14,.27,IIf(R2PDS==20,.20,IIf(R2PDS==25,.16,IIf(R2PDS==30,.13,IIf(R2PDS==50,.08,IIf(R2PDS==60,.06,IIf(R2PDS==120,.03,0)))))))));
r2color=IIf(r2>Crit,colorLime,colorRed);
_SECTION_END();
//--------------------------------------------------------------------------
_SECTION_BEGIN("Analysis");
//Tops & Dips
Tp = Ref(KT,-1) == HHV(KT,3);
TpL = Tp AND Ref(KT,-1) >  UL;
Vl = Ref(KT,-1)==LLV(KT,3);
Vly=Ref(KT,-2)==LLV(KT,4);
VlL = Vl AND Ref(KT,-1) < LL;
PlotShapes(IIf(tp ,shapeSmallCircle+ shapePositionAbove,shapeNone),colorRed,kt,0,0);
PlotShapes(IIf(Vl ,shapeSmallCircle+ shapePositionAbove,shapeNone),colorLime,0,0,0);
//-----------------Zeroline Loop - Long - zll----------------------------------
zll= Vly AND Ref(kt,-1)<0 AND Ref(kt,-1)>(-40) AND sp>Ref(sp,-1)AND HHV(KT,8)>30;
PlotShapes(IIf(zll,shapeDigit1 ,Null),colorPaleGreen,0,Min(0,kt)+30,Min(0,kt)-45);
PlotShapes(IIf(zll,shapeUpArrow,Null),colorGreen,0,Min(0,kt),-10);
//------------------Zeroline Bounce - Long - zbl--------------------------------
zbl= Vly AND Ref(kt,-1)<20 AND Ref(kt,-1)>0 AND r>L1 AND HHV(KT,8)>30 ;
PlotShapes(IIf(zbl,shapeDigit2 ,Null),colorPaleGreen,0,Min(0,kt)+20,Min(0,kt)-45);
PlotShapes(IIf(zbl,shapeUpArrow,Null),colorGreen,0,Min(0,kt),-10);
//------------------Pullback Entry Strong-pbes----------------------------------
pbes= Vl AND Ref(kt,-1)>20 AND Ref(kt,-1)<40 AND R2>Crit AND rsp;
PlotShapes(IIf(pbes,shapeDigit3 ,Null),colorPaleGreen,0,Min(0,kt)+20,Min(0,kt)-45);
PlotShapes(IIf(pbes,shapeUpArrow,Null),colorGreen,0,Min(0,kt),-10);
//------------------Pullback Entry Strong-pbel----------------------------------
pbel= Vly AND Ref(kt,-1)>40  AND R2>Crit AND sp>Ref(sp,-1) ;
PlotShapes(IIf(pbel,shapeDigit4 ,Null),colorPaleGreen,0,Min(0,kt)+20,Min(0,kt)-45);
PlotShapes(IIf(pbel,shapeUpArrow,Null),colorGreen,0,Min(0,kt),-10);
//-------------------Zeroline Loop - short - zls---------------------------------
zls= tp AND Ref(kt,-1)>0 AND Ref(kt,-1)<(40) AND R2>Crit ;
PlotShapes(IIf(zls,shapeDigit1 ,Null),colorPink ,0,Max(0,kt)+20,Max(0,kt)+15);
PlotShapes(IIf(zls,shapeDownArrow,Null),colorRed,0,Max(0,kt),-10);
//---------------------- Zeroline Bounce - Short - zbs--------------------------------
zbs= tp AND Ref(kt,-1)<0 AND Ref(kt,-1)>(-20) AND R2>Crit ;
PlotShapes(IIf(zbs,shapeDigit2 ,Null),colorPink ,0,Max(0,kt)+20,Max(0,kt)+15);
PlotShapes(IIf(zbs,shapeDownArrow,Null),colorRed,0,Max(0,kt),-10);
//------------------------Pullup shorthing oppurtunity -pso----------------------
pso= tp AND Ref(kt,-1)>(-40) AND Ref(kt,-1)<(-20) AND R2>Crit ;
PlotShapes(IIf(pso,shapeDigit3 ,Null),colorPink ,0,Max(0,kt)+20,Max(0,kt)+15);
PlotShapes(IIf(pso,shapeDownArrow,Null),colorRed,0,Max(0,kt),-10);
//----------------------Additioal shorting oppurtunity--------------------------
aso= tp AND Ref(kt,-1)<(-40) AND R2>Crit ;
PlotShapes(IIf(aso,shapeDigit4 ,Null),colorPink ,0,Max(0,kt)+20,Max(0,kt)+15);
PlotShapes(IIf(aso,shapeDownArrow,Null),colorRed,0,Max(0,kt),-10);
//-------------------------------------------------------------------------------
_SECTION_END();

Title = EncodeColor(colorYellow)+"K-Trend- V.1.0" + " - " +  Name() + " - " + EncodeColor(colorRed)+ Interval(2) + EncodeColor() + "  - " + Date() +" - " +
EncodeColor(colorLime)+ "K-Trend= "+WriteVal(kt)+"--"+EncodeColor(colorYellow)+WriteIf (tp AND kt>0, " A top seen, May pullback",
WriteIf(Vl AND kt<0,"A Bottom Seen May Pullup",""))+EncodeColor(colorPink)+WriteIf(zll,"Early Entry",WriteIf(zbl,"Zeroline Bounce Long",
WriteIf(pbes,"Pullback Buy Oppurtunity-Strong", WriteIf(pbel,"Pullback Buy Oppurtunity-Light",WriteIf(zls,"Zeroline Loop Short",
WriteIf(zbs,"zeroline Bounce Short",WriteIf(pso,"Shorting Oppurtunity",WriteIf(aso,"Addl. Shorting Oppurtunity"," "))))))));