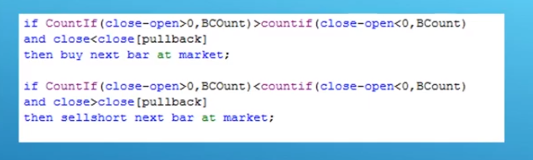
I have coded one basic Kevin Davey price action strategy which is basically to count the number of up bars versus the number of down bars over a certain period and exit after a number of bars.
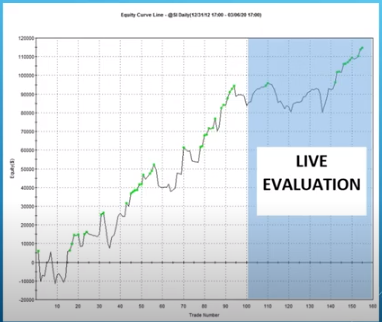
K Davey code on tradestation is attached together with an example of the equity curve (over the period 2013 to 2017) for Silver.
You can find more details about the trading strategy at https://www.youtube.com/watch?v=qVnSgpn-yo8&t=326s
defparam PRELOADBARs=200
DEFPARAM CUMULATEORDERS=false
c1 = close - open > 0
c2 = close - open < 0
totalup=summation[numbars](c1)
totaldown=summation[numbars](c2)
if totalup > totaldown and close < close[pullback] and not onmarket then
buy 1 share at market
entrylongbar = barindex
endif
if barindex = entrylongbar+5 and longonmarket then
sell 1 share at market
endif
if totaldown > totalup and close > close[pullback] and not onmarket then
sellshort 1 share at market
entryshortbar = barindex
endif
if barindex = entryshortbar+5 and shortonmarket then
exitshort 1 share at market
endif
//set stop loss sl
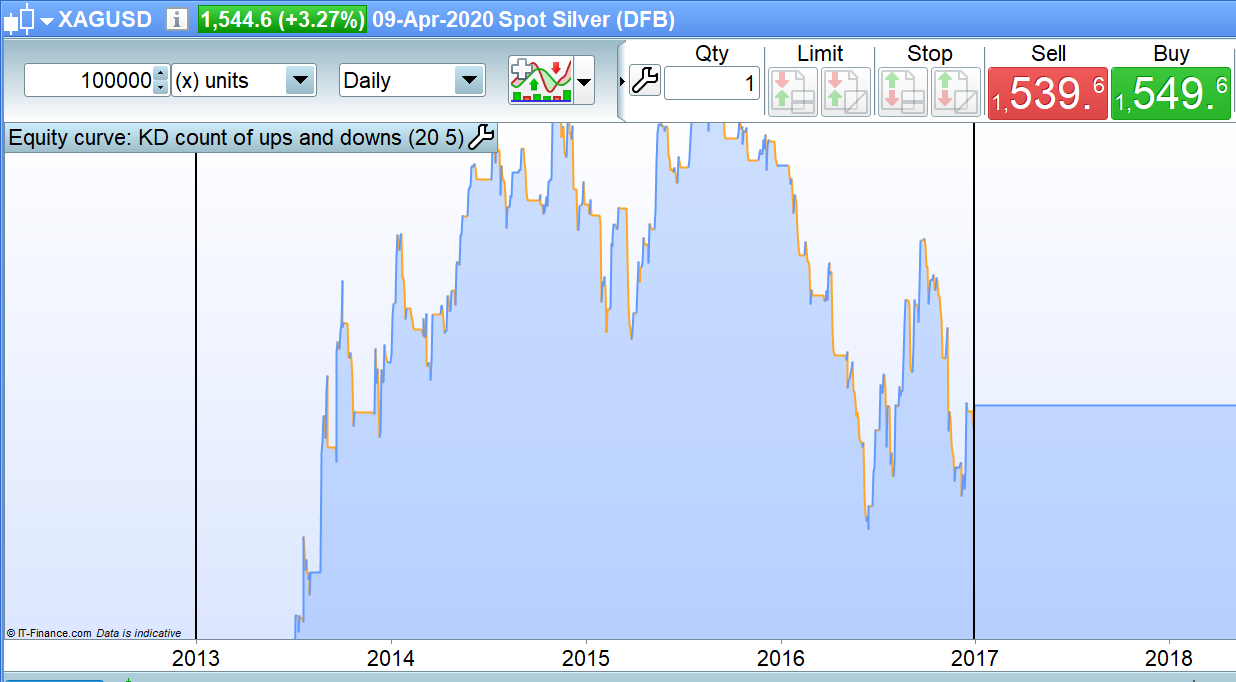
I believe my code is correct, however my equity curve for the same period 2013 to 2017 (for the best parameters 20 and 5) does not look at all like the one from Kevin.
I have changed the timezone to be CME timezone, to ensure the “daily” data were the same, but it makes no difference.
Has anyone got any idea what the difference could be ? My understanding is that if you run the above tradestation code on tradestation you will get the Kevin’s equity curve.Can someone check ?
jmf125 –
There are some simple rules that everyone using the forums is expected to follow. Your post has broken one or more of these rules.
The forum rules are as follows. I have highlighted in bold the rule/rules that you have not followed:
Post your topic in the correct forum.
ProRealTime Platform Support only platform related issues.
ProOrder only strategy topics.
ProBuilder only indicator topics.
ProScreener only screener topics
General Discussion any other topics.
Welcome New Members for new forum members to introduce themselves.
Only post in the language of the forum that you are posting in. For example English only in the English speaking forums and French only in the French speaking forums.
Always use the ‘Insert PRT Code’ button when putting code in your posts to make it easier for others to read.
Do not double post. Ask your question only once and only in one forum. All double posts will be deleted anyway so posting the same question multiple times will just be wasting your own time and will not get you an answer any quicker. Double posting just creates confusion in the forums.
Be careful when quoting others in your posts. Only use the quote option when you need to highlight a particular bit of text that you are referring to or to highlight that you are replying to a particular member if there are several involved in a conversation. Do not include large amounts of code in your quotes. Just highlight the text you want to quote and then click on ‘Quote’.
Give your topic a meaningful title. Describe your question or your subject in your title. Do not use meaningless titles such as ‘Coding Help Needed’.
Do not include personal information such as email addresses or telephone numbers in your posts. If you would like to contact another forum member directly outside of the forums then contact the forums administrator via ‘Contact Us’ and they will pass your details on to the member that you wish to contact.
Always be polite and courteous to others.
Have fun.
I have edited your post where required. Please ensure that your future posts meet these few simple forum rules. 🙂
The code looks like it should do what you describe. I’m guessing that Kevin Davey”s equity curve is for every possible trade that could ever be taken whereas with your version whilst you have a long position open you cannot open either a short position or any more long positions so you are missing trades. The equity curve you get will be completely dependent on which candle you start on.
I would suggest running separate long and short strategies and also consider a ‘robustness test’ (Use the search box to find my topic on that) to shake things up a bit and see what sort of equity curves you get with more random trading.
Coding your strategy to work by opening every possible trade is a bit laborious in v10.3 but would be easier in v11 thanks to arrays. However it is not possible to partially close positions using PRT at the moment so it would be a rather fruitless exercise.
Apologies for posting in the wrong forum.
I don’t believe Kevin’s strategy includes every possible trades, as his number of trades is already lower than the ones I obtain in PRT.
In theory I fully agree that it is highly dependent on the first candle, however in practise it does not influence the results much. I have started on any day in the first week of January 2013 and the results are very similar. In any case I would not recommend the strategy, I was just trying to understand why the results are so different. I believe the results Kevin presents in the youtube video are correct, so trying to find out what differs.
Thank you for the tip on robustness, I will have a look.
You also have to consider that different data will give you different results. You and Kevin are not using the same data source and so do not have the same candles. IG for example have 6 candle weeks but did the data Kevin was using on his TradeStation have 6 day weeks?
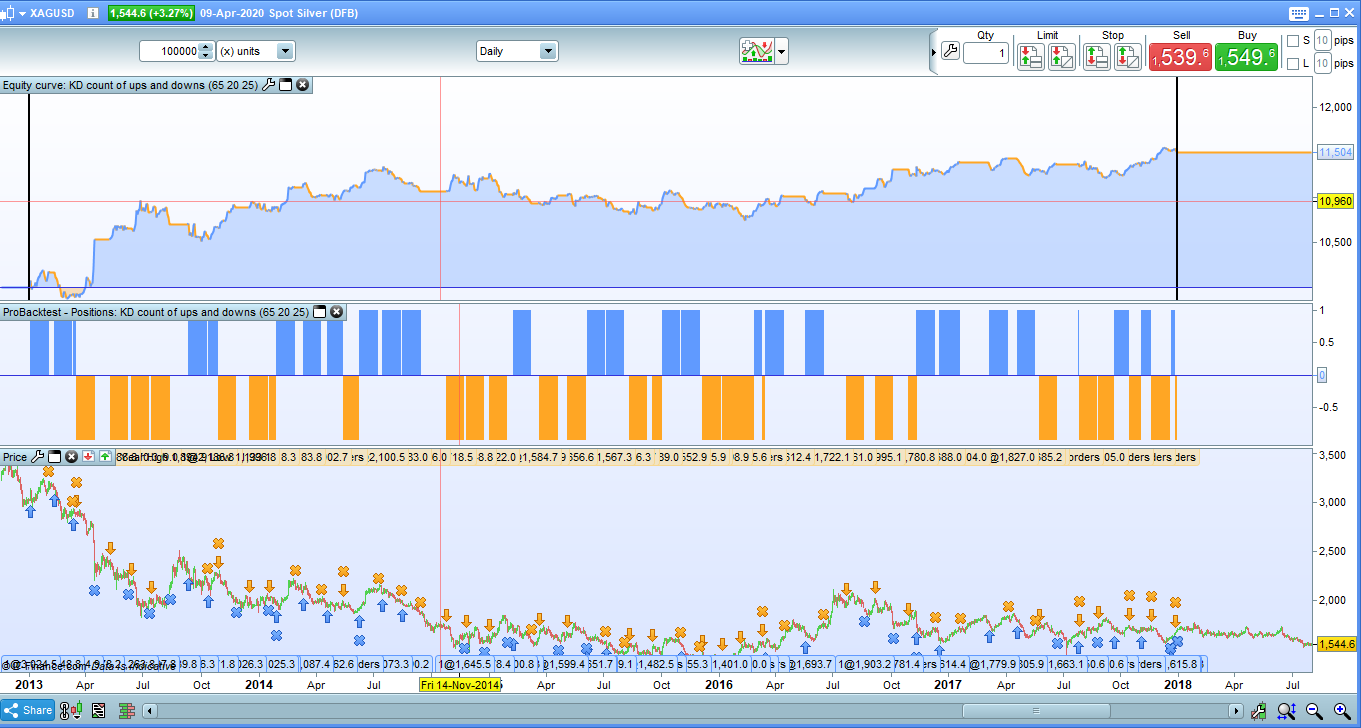
I have used 5 days candle (I have excluding week ends). Kevin does not have accumulated positions, but has reversal positions. So I have changed to code to take this into account. It is getting better but still not there.
defparam PRELOADBARs=200
DEFPARAM CUMULATEORDERS=false
c1 = close - open > 0
c2 = close - open < 0
totalup=summation[numbars](c1)
totaldown=summation[numbars](c2)
if totalup > totaldown and close < close[pullback] and not longonmarket then
buy 1 share at market
entrylongbar = barindex
endif
if barindex = entrylongbar+exitbars and longonmarket then
sell 1 share at market
endif
if totaldown > totalup and close > close[pullback] and not shortonmarket then
sellshort 1 share at market
entryshortbar = barindex
endif
if barindex = entryshortbar+exitbars and shortonmarket then
exitshort 1 share at market
endif
//set stop loss sl
I have attached the equity curve for the same period shown in the video (although I do not know the exact parameters used in the video).
It would be good to be able to transport strategies from genuine guys onto PRT.
I have used 5 days candle (I have excluding week ends)
The data is still not likely to be the same. By excluding Sunday candles you are in reality just chopping off a bit of data that other data sources might include in their first day of the week candle. Plus you have not hard coded avoiding Sundays into your code and I believe that changing your chart settings to exclude Sundays does not exclude them from indicator calculations.
@jmf125 ive seen similar results coding up Kevin Daveys work. I cant really get the same results.. my guess is the same as Vonasi is talking about: Different data = different results. Only way to make sure the strategy “works” is to get a tradestation (which is what KD is using i think) account and try it out there.
I think the best points on KD’s work is the simplicity of his systems, and how he makes it work for his portfolio. many different OK-super-simple robust-looking algos is better than spending 5 years creating a holy grail that dosnt exist. This was my philosophy even before reading his books, and now that ive read them i would say that this belief is stronger then ever for me.
Yet to see a simple but robust strategy that still works now..
but indeed it comes first with having the good data, or good proxy.
so for exemple, if you have cfd and not future data, first thing is to replicate the same trading hours on your cfd graph…,
Hi Stefou102 How do you suggest to replicate future data on CFD ?
I believe I did adjust the trading hours by changing the timezone. But I think the data themselves might be different. I agree with Vonassi, the most probable cause is that the data set is likely to be different.
The only way to find out would be to compare Tradestation and PRT. Which I might do at some point in the future.
Thanks I couldn’t agree more.