VN
VNParticipant
Average
Hi I am using the KAMA code which Nicolas has shared https://www.prorealcode.com/prorealtime-indicators/kaufman-adaptive-moving-average-kama/ here on a 1 min chart for S&P 500.
Something in the code does not appear to be working correctly as shown in the attached image when plotting the indicator for some reason after 12th Feb 21 ( I am using 10000 units at 1 min ), the average returned just stays constant for the remainder of the period. Interestingly, if I switch to a greater period, say 2 mins, the problem goes away.
I am using exactly the same settings as per Nicolas’s code i.e. Period = 10, FastPeriod=2, SlowPeriod=30.
Any assistance in fixing this would be appriciated!
Period = 10
FastPeriod = 2
SlowPeriod = 30

Fastest = 2 / (FastPeriod + 1)
Slowest = 2 / (SlowPeriod + 1)
if barindex < Period+1 then
Kama=close
else
Num = abs(close-close[Period])
Den = summation[Period](abs(close-close[1]))
ER = Num / Den
Alpha = SQUARE(ER *(Fastest - Slowest )+ Slowest)
KAMA = (Alpha * Close) + ((1 -Alpha)* Kama[1])
endif

return kama
VNParticipant
Average
attaching file again as it looks like it hasnt worked first time
I’ll try to spot what it is all about.
VNParticipant
Average
Thanks for looking Roberto!
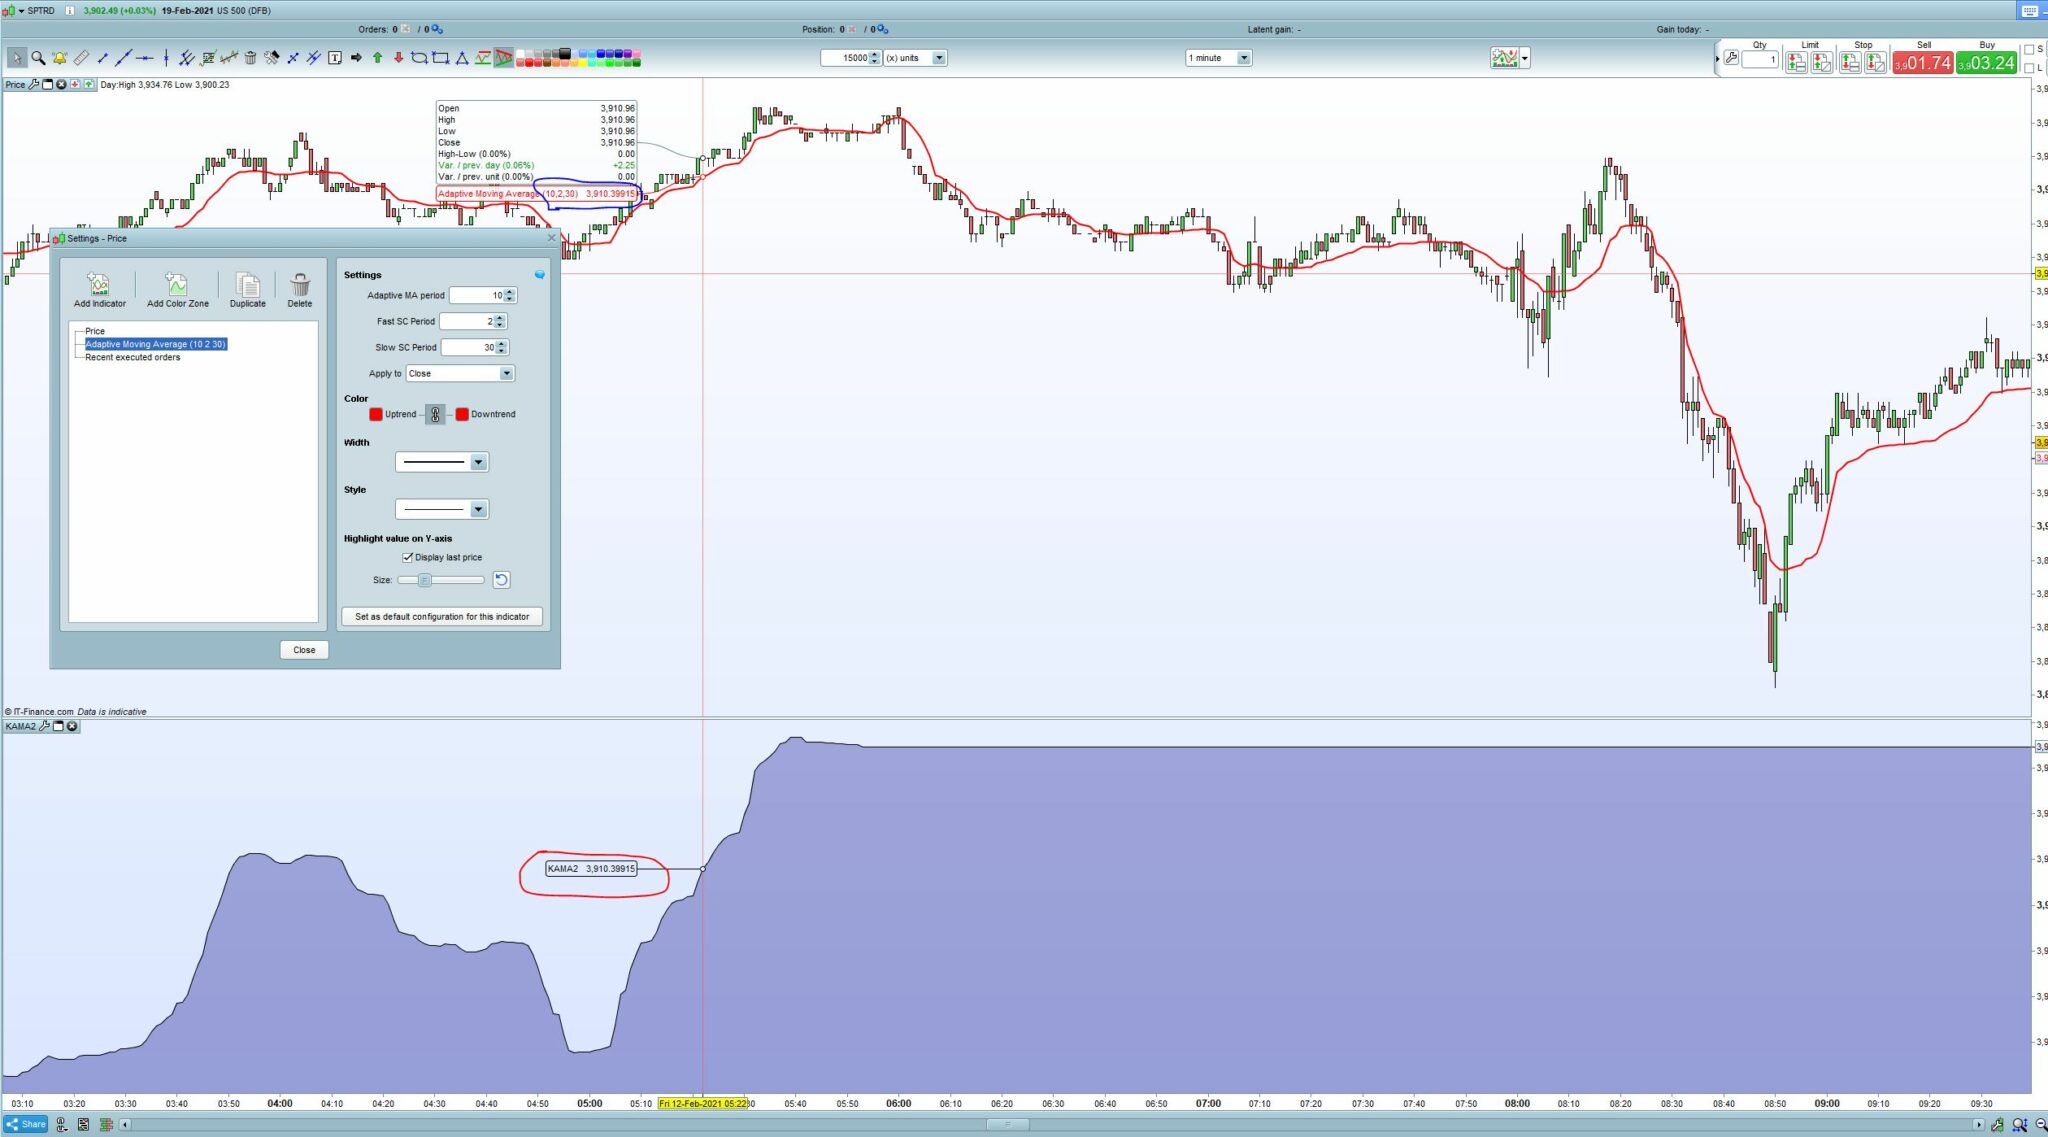
I just noticed that if I load the pre-loaded Adaptive MA indicator straight into the price chart (red line of the image) and i keep the same parameters, it works and it matches exactly the indicator using Nicolas’s code e.g. at the snapshot i have taken on 12/02/21 @ 05:22 the KAMA is at 3,910.39915 on Nicolas’s code (circled in red) and also on the pre-loaded indicator (circled blue).
But then you can see that from about 6:00 the KAMA from Nicolas’s code starts to be a constant where as the pre-loaded KAMA continues to move as the price changes.
Very odd.
It returns wrong values up to 69-second TF.
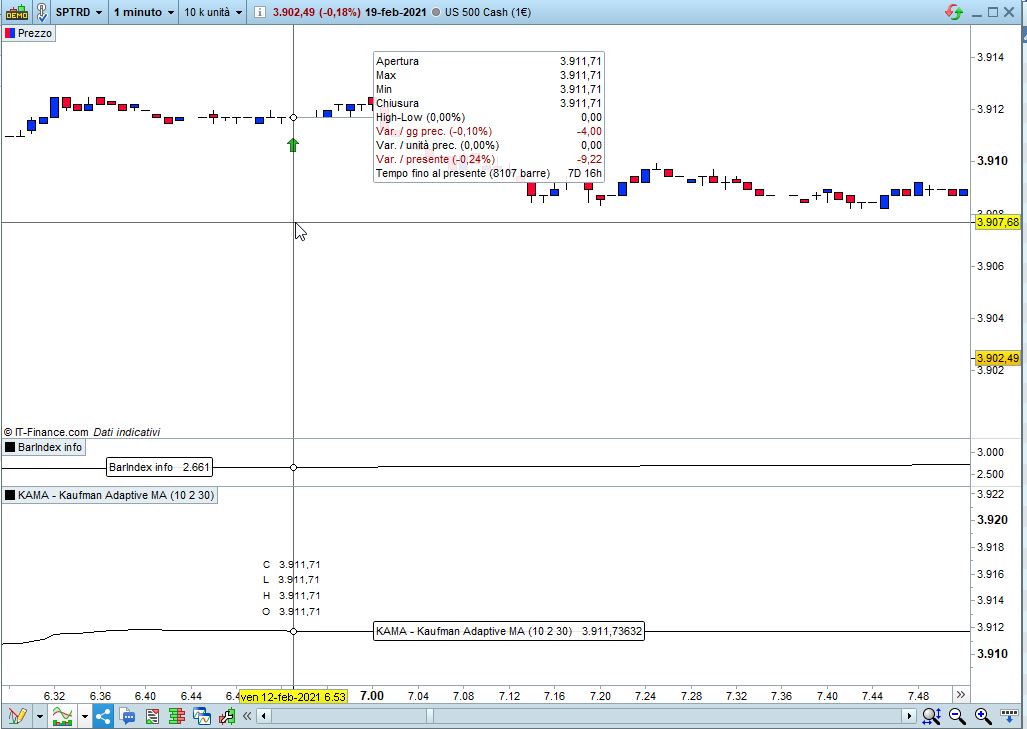
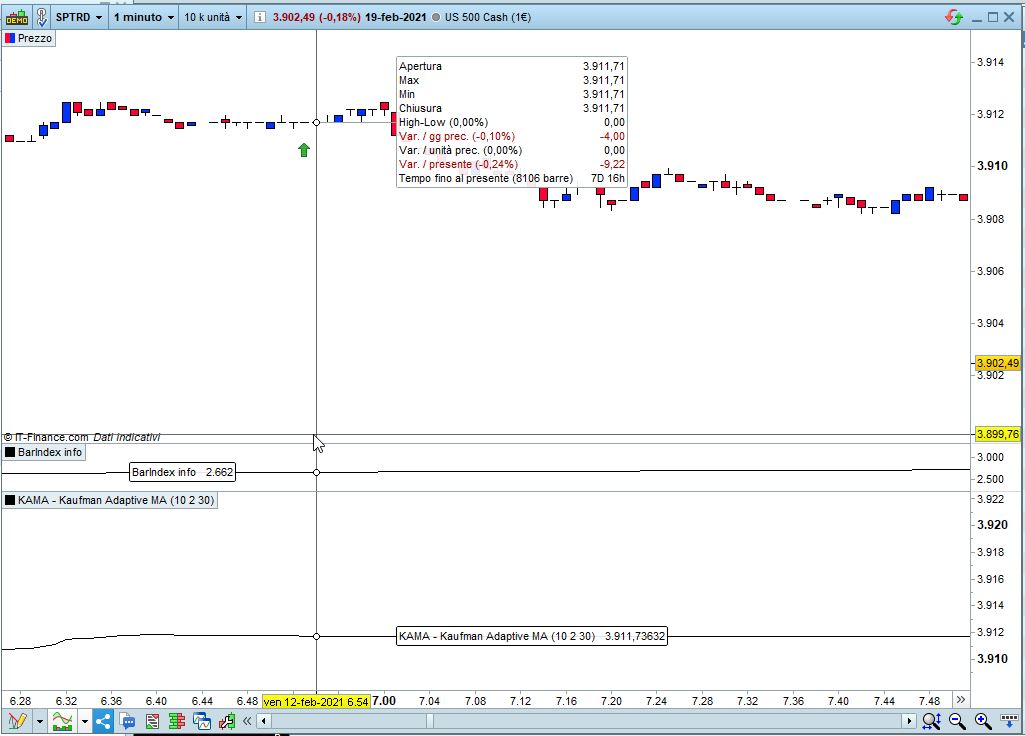
It seems that up to (and including) OpenMinute 06.53am (Utc+1 or CET) OHLC data are reported and candlesticks plotted on the chart, while AFTER that time candlesticks are plotted but OHLC data are NOT plotted with the following code:
defparam drawonlastbaronly=true
Period     = 10
FastPeriod = 2
SlowPeriod = 30
Fastest    = 2 / (FastPeriod + 1)
Slowest    = 2 / (SlowPeriod + 1)
if barindex < (Period + 1) then
   Kama   = close
else
   Num    = abs(close-close[Period])
   Den    = summation[Period](abs(close - close[1]))
   ER     = Num / Den
   Alpha  = SQUARE(ER *(Fastest - Slowest ) + Slowest)
   Kama   = (Alpha * Close) + ((1 - Alpha) * Kama[1])
endif
y=2662                      //I used this indicator:     RETURN BARINDEX
IF BarIndex > 8000 then
   x =(barindex - y)
   z =3913//kama[x]
   z1=open[x]
   z2=high[x]
   z3=low[x]
   z4=close[x]
   drawtext("O   #z1#"      ,y,z*1.0004)
   drawtext("H   #z2#"      ,y,z*1.0007)
   drawtext("L   #z3#"      ,y,z*1.0010)
   drawtext("C   #z4#"      ,y,z*1.0013)
   drawtext("x   #x#"       ,y,z*1.0016)
   j=kama[7838]//
   drawtext("j   #j#"       ,y,z*1.0019)
endif
return Kama
something happened on Friday Feb. 12th, 2021 at 06:54 (Utc+1, or CET) on TF’s lower than 70 seconds.
I forgot to attach a couple of screenshots.
VNParticipant
Average
Hi Roberto, thank you for the explanation, but how is it that the built in Kama indicator (adaptive moving average in the PRT platform) is working fine but the code version is not. I attached a screenshot in my last post which shows the comparison between the the two indicators in action. At around the 6am time point the code version from Nicolas starts to break down and stay at constant value, but the built in indicator continues to follow the price action. I don’t know if you saw my post 162128?
I couldn’t find the reason, but I found out that up to 7K units it works like a charm even on a 1-minute TF, while with 10K or 15K units it doesn’t!
I read your posts and I don’t know why PRT’s works (despite it is slightly different), and Nicolas’ doesn’t (I also tried the same formula in a slightly different way, but didn’t work either).
VNParticipant
Average
thanks Roberto for looking again. At least we both see the same issue.
Do you think some fail-safe code can be put in place to circumvent this given what you have found about the OHLC?
I tried inserting in something like, IF KAMA = KAMA[1] then set KAMA = KAMA[2] in the hope that it will by pass the bad market data, but this did not work.
Can something like this be done that you think could get round the problem?
No, it’s something unpredictable. Maybe next time it happens on a 10-minute TF on CAC40, who knows?
It’s much better if you open a ticket with PRT (key combination Ctrl+M on your keyboard). There must be a reason which is better to find out.
If you do, please share any answer you might receive, no matter when.
VNParticipant
Average
I have just raised the issue as you suggested, but I am not getting my hopes high as who knows when they will look at it..
if it’s bad market data at one specific point in time, then why is it not possible to do a tactical error handler, at least whilst the developers look at fixing it?
surely by saying something like, if the current price close is a “bad one” then calculate the KAMA on the prior (or whichever one is a good one from past) close and then continue?
i will wait until someone from PRT responds but just need something in the meantime. Thanks again!