Hi @nicolas @juanj, Thanks very much for your help, it’s much appreciated.
I’ve moved the topic on Kase Dev Stops discussion here.
I was wondering if you could post your SAR code here Juanj?, (using the insert PRT code button above). I couldn’t get it to load.
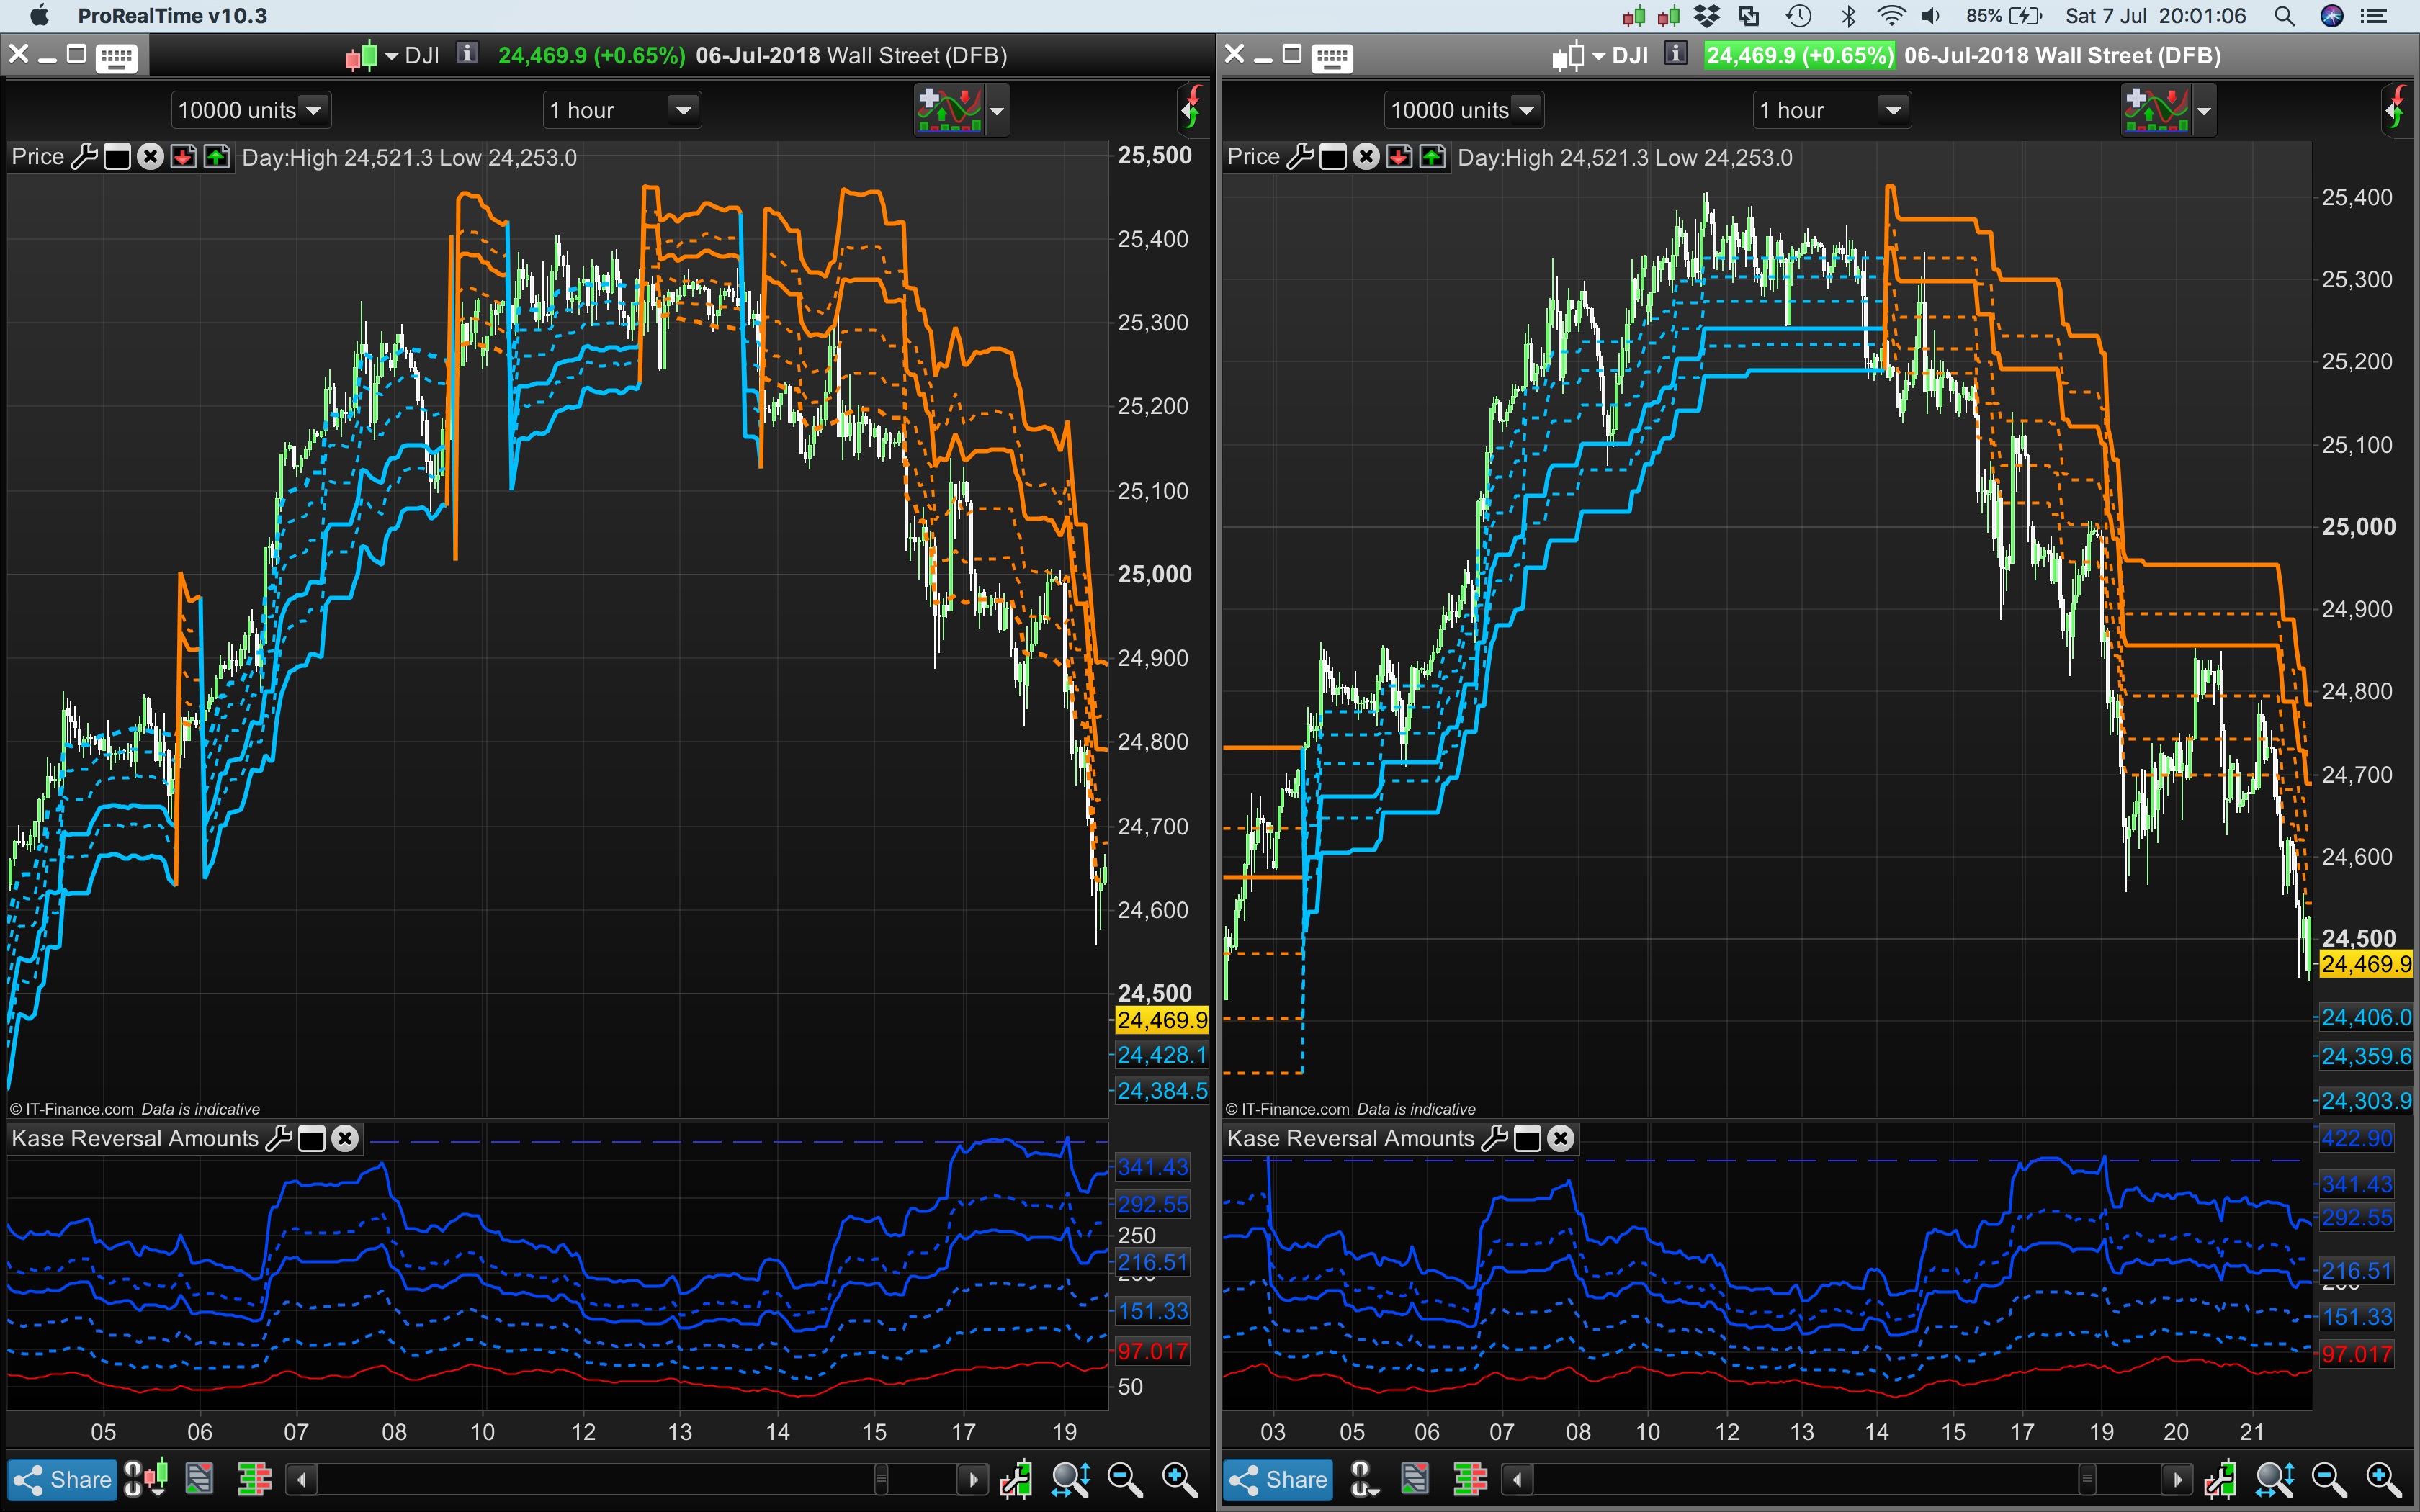
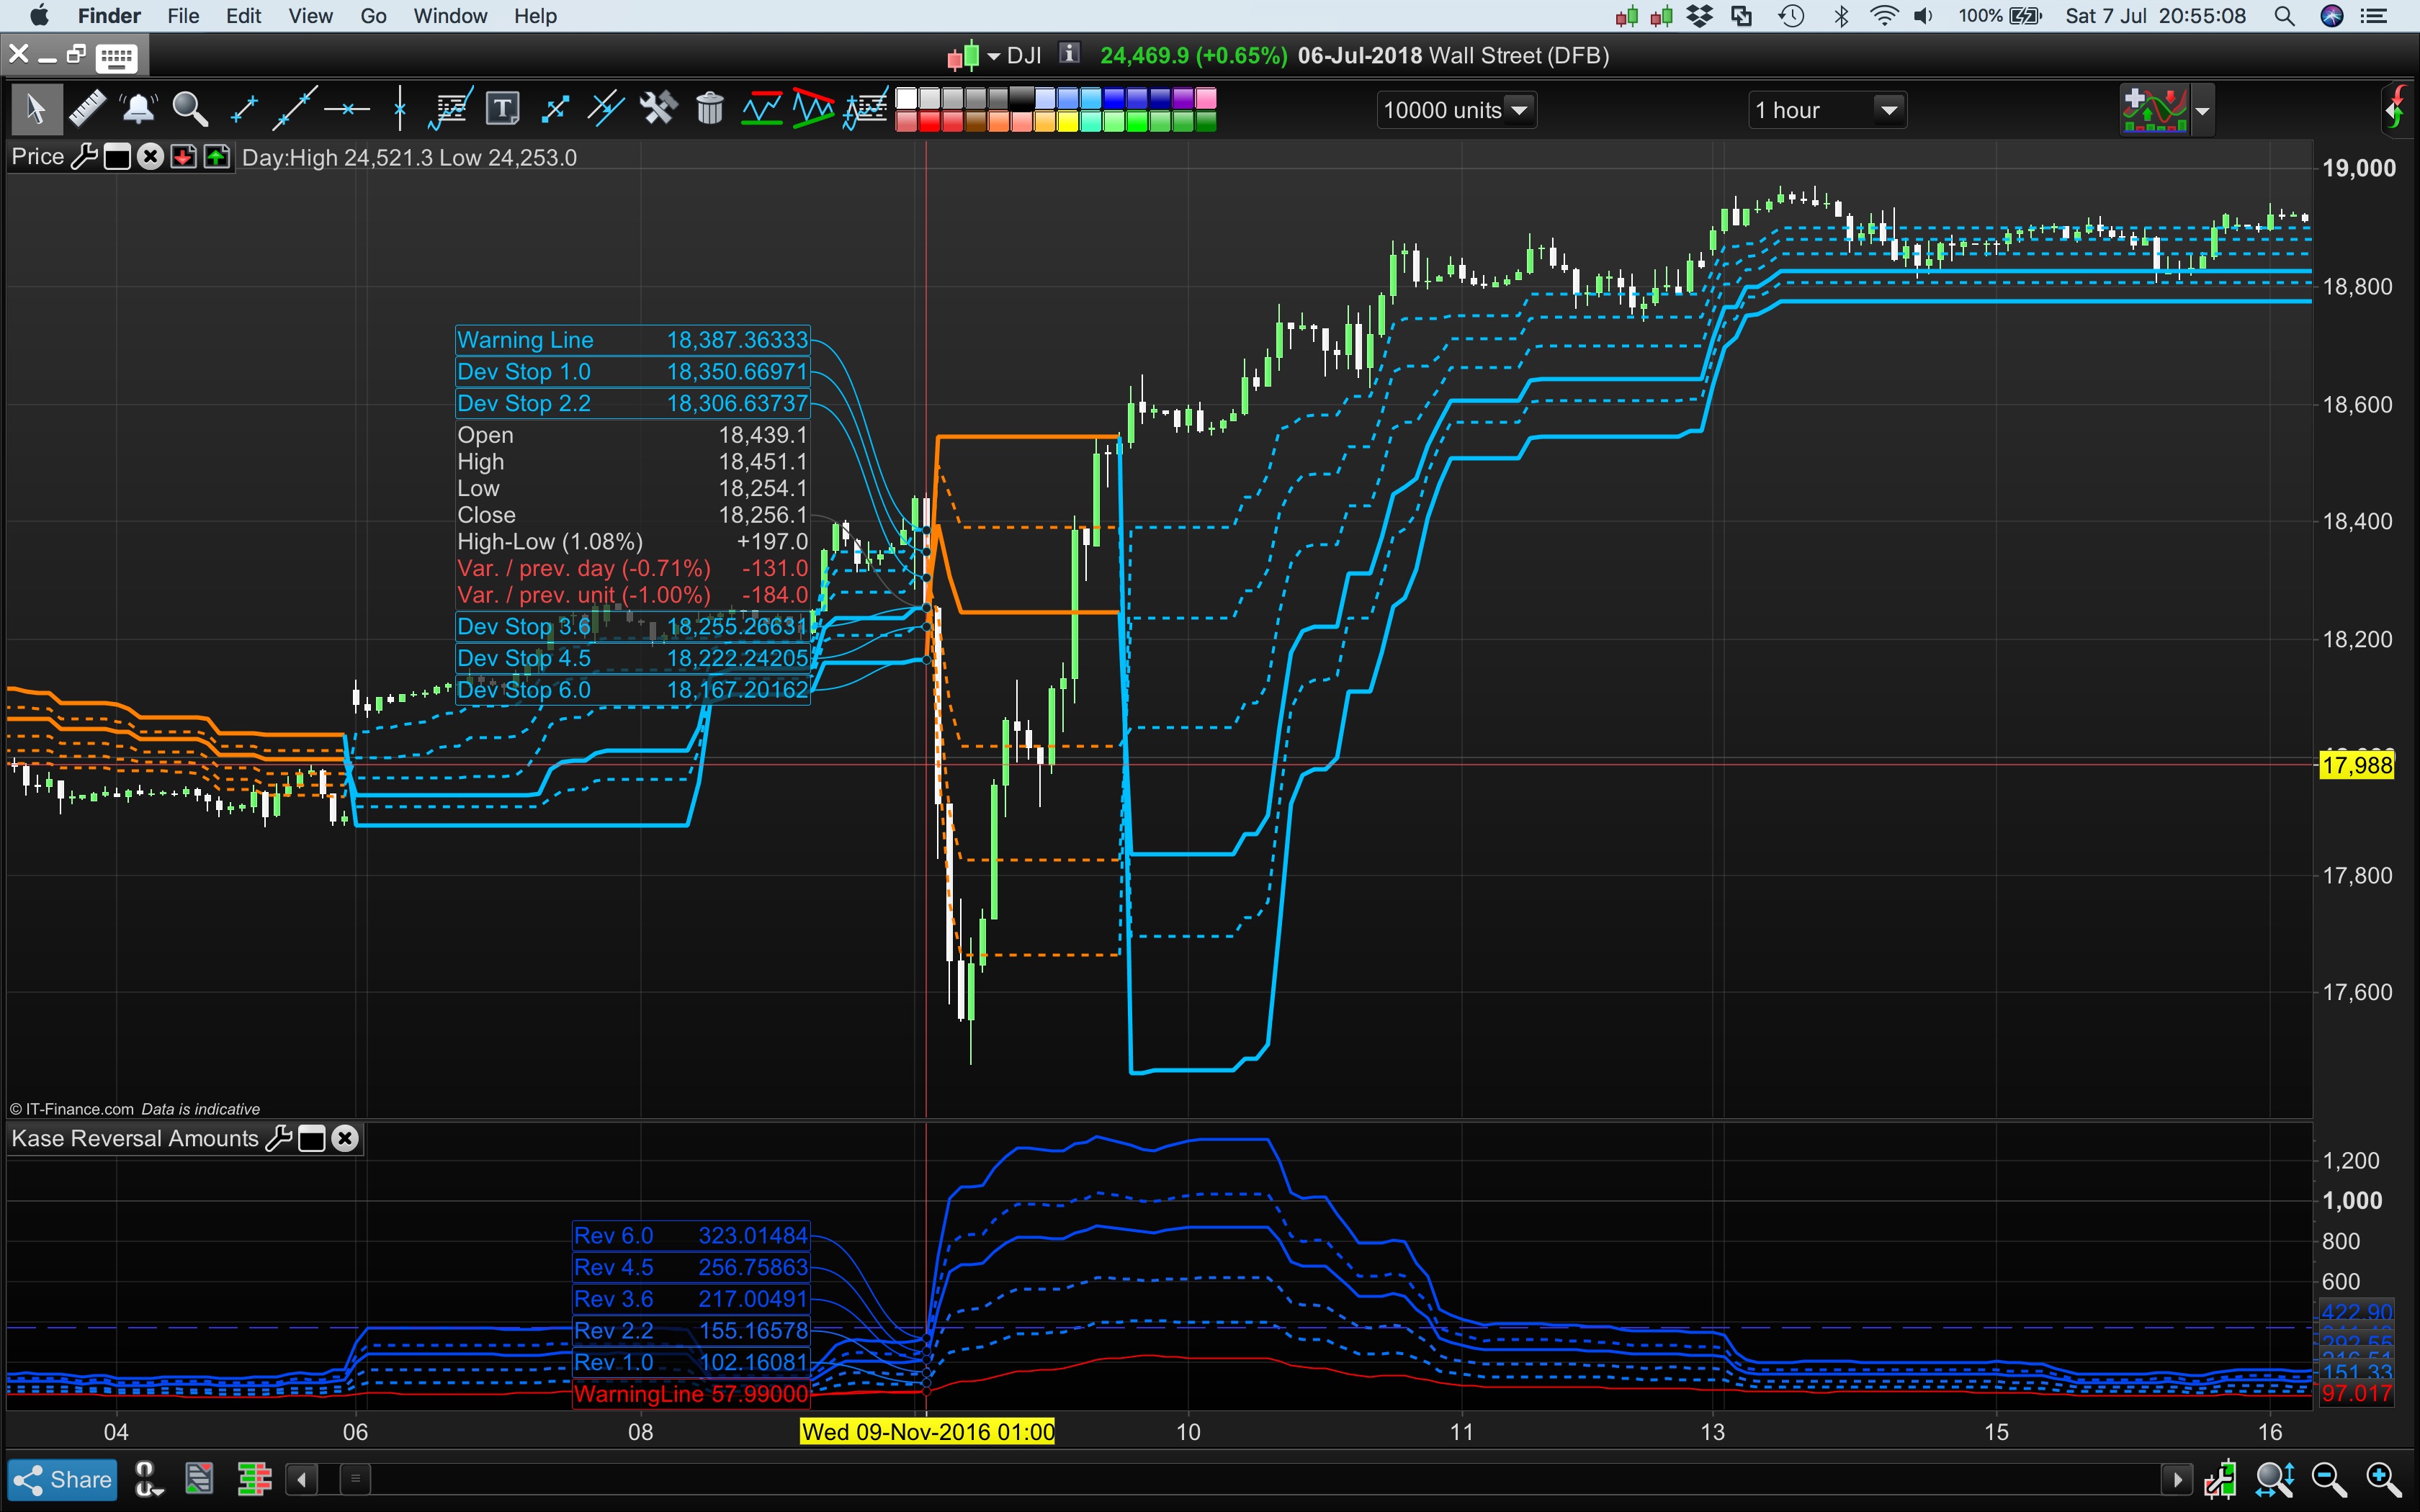
It’d be interesting to compare your SAR version with this one I modified: Screenshot shows the Dev Stops with Devs 4.5 and 6.0 added using a MVG on the left (21/34 period Kase also uses) and the SAR version on the right.
The Period should be set to 30 to make it statistically significant. Depending on which MVG’s you use it will hit Devs earlier or later. Setting period to 20 will mean price will hit the Devs earlier.
I’ve also built the Dev Stops to include Dev Stops 4.5, and 6.0 that Kase uses. Which method of flipping the Stops isn’t relevant, the Stops weren’t designed as a system: There is the KPO an KCD for that – which I have reposted for coding help.
Just to confirm this code is the double true range Kase used?:
mmax=max(max(high,high[1]),pricc[2])

mmin=min(min(low,low[1]),pricc[2])

rrange=mmax-mmin

avg=rrange

for n=1 to inpDesPeriod-1 do

avg=(avg+rrange[n])

next

avg=avg/n


//Double True Range

DTR = max(max(High - Low[2], abs(High - Close[2])),max(abs(Low - Close[2]),(abs(Low - Close[2]))))

(its the pricc = customclose, I’m not familiar with).
Re: Long index prices hitting Dev 3 and a long trend not reversing — i.e. price continues to go up yet Dev 3 is an exit Stop to get out,… well, apart from putting the period to 30, I suspect it is the long bias of Indexes that will mean that when the price hits Dev Stop 3 it can reverse back up to new highs within a long trend.
This is particularly true during a strong trend (check the ADX indicator). The odds are against your position:
The Dev 3 is generally a 99.75% “point of no return” Stop as was tested and determined by Kase & Co (using Bell Curve distributions + Standard Deviation skew studies on masses of data).
I seem to recall that the probability “Dev Stop Follow Through” studies they did – that I’ve seen and posted in the Kase PO/ CD and Permissions forum post – were never just classified to particular assets, like non mean reverting indexes or mean reverting currencies etc, but to all asset classes. Some of their studies refer to 13 years of data tested per instrument but the results in their “Dev Stop Follow Through” tables always generalised results for all asset classes. I think they will work better on mean reverting assets like currencies or cyclical oil markets. (Kase was an energy trader and worked for Aramco consulting as a Director of Technical Analysis and Director of Risk Management).
Cynthia A. Kase, CMT: “It was found that of the 157,206 bars of data, the average stop was hit a total of 14,582 times, or about nine percent of the time, approximately once every 11 bars. Once the average stop was hit, the follow through to the remaining stops was evaluated.” Source: “How Well Do Traditional Momentum Indicators Work?”
This is a very interesting video of Kase talking about the Dev Stops and KRev risk amounts:
I have no excuse now, nor does any other trader reading this, for not knowing what their true financial risk is when entering any market, lol. — particularly now as there are the Kase Reversal Amounts in the indicator library.
Cheers
Bard
//Settings
n=30

p1=1.0
p2=2.2
p3=3.6
p4=4.5
p5=6.0

difference=0
Hg=highest[2](high)
Lw=lowest[2](low)
DTR=max(max(Hg-Lw,abs(Hg-close[2])),abs(Lw-close[2]))
aDTR=average[n](DTR)
for i=0 to n-1 do
difference=difference+square(DTR[i]-aDTR)
next
difference=difference/n
sdev=sqrt(difference)

dev0=close-aDTR
dev1=close-aDTR-p1*sdev
dev2=close-aDTR-p2*sdev
dev3=close-aDTR-p3*sdev
dev4=close-aDTR-p4*sdev
dev5=close-aDTR-p5*sdev

if dev0<dev0[1] and close>dev5[1] then
dev0=dev0[1]
endif
if dev1<dev1[1] and close>dev5[1] then
dev1=dev1[1]
endif
if dev2<dev2[1] and close>dev5[1] then
dev2=dev2[1]
endif
if dev3<dev3[1] and close>dev5[1] then
dev3=dev3[1]
endif
if dev4<dev4[1] and close>dev5[1] then
dev4=dev4[1]
endif
if dev5<dev5[1] and close>dev5[1] then
dev5=dev5[1]
endif

dev6=close+aDTR
dev7=close+aDTR+p1*sdev
dev8=close+aDTR+p2*sdev
dev9=close+aDTR+p3*sdev
dev10=close+aDTR+p4*sdev
dev11=close+aDTR+p5*sdev

if dev6>dev6[1] and close<dev11[1] then
dev6=dev6[1]
endif
if dev7>dev7[1] and close<dev11[1] then
dev7=dev7[1]
endif
if dev8>dev8[1] and close<dev11[1] then
dev8=dev8[1]
endif
if dev9>dev9[1] and close<dev11[1] then
dev9=dev9[1]
endif
if dev10>dev10[1] and close<dev11[1] then
dev10=dev10[1]
endif
if dev11>dev11[1] and close<dev11[1] then
dev11=dev11[1]
endif

if close>dev11[1] then
flag=-1
else
if close<dev5[1] then
flag=1
endif
endif

if flag=-1 then
ind0=dev0
ind1=dev1
ind2=dev2
ind3=dev3
ind4=dev4
ind5=dev5
//k=1
r=0
g=191
b=255
else
ind0=dev6
ind1=dev7
ind2=dev8
ind3=dev9
ind4=dev10
ind5=dev11
//k=-1
r=255
g=128
b=0
endif

//ORANGE AND LIGHT BLUE
return ind0 coloured(r,g,b) style(dottedline,2) as "Warning Line", ind1 coloured(r,g,b) style(dottedline,2) as "Dev Stop 1.0", ind2 coloured(r,g,b) style(dottedline,2) as "Dev Stop 2.2", ind3 coloured(r,g,b) style(line,3) as "Dev Stop 3.6", ind4 coloured(r,g,b) style(dottedline,2) as "Dev Stop 4.5", ind5 coloured(r,g,b) style(line,3) as "Dev Stop 6.0"

//NO CHANGE OF COLUR FOR TREND CHANGE return ind0 coloured(2, 118, 253) style(dottedline,2) as "Warning Line" ,ind1 coloured(2, 118, 253) style(dottedline,2) as "Dev Stop 1.0", ind2 coloured(2, 118, 253) style(dottedline,2) as "Dev Stop 2.2", ind3 coloured(2, 118, 253) style(line,3) as "Dev Stop 3.6", ind4 coloured(2, 118, 253) style(dottedline,2) as "Dev Stop 4.5", ind5 coloured(2, 118, 253) style(line,3) as "Dev Stop 6.0"