Hi
I want to display the bollinger bands of the 5000 ticks time frame in my current time frame (500ticks).
At each close after startup everything shifts, I tried to search on the forum to change the mode but nothing, anyone have an idea ?
Kind regards
TIMEFRAME(5000ticks,UPDATEONCLOSE)
s=2
p1=18
p2=19
p3=20
p4=21
p5=22


//p1
moyenneBollinger1 = AVERAGE[p1](CLOSE)
IF BARINDEX >= p1-1 THEN
sumy21 = 0
sumy1 = 0
FOR i = 0 TO p1-1
sumy21 = sumy21 + SQUARE(CLOSE[i])
sumy1 = sumy1 + CLOSE[i]
NEXT
ecartType1 = SQRT(sumy21 / p1 - SQUARE(sumy1 / p1))
ELSE
ecartType1 = UNDEFINED
ENDIF
bollSup1 = moyenneBollinger1 + s * ecartType1
bollInf1 = moyenneBollinger1 - s * ecartType1
//p2
moyenneBollinger2 = AVERAGE[p2](CLOSE)
IF BARINDEX >= p2-1 THEN
sumy22 = 0
sumy2 = 0
FOR i = 0 TO p2-1
sumy22 = sumy22 + SQUARE(CLOSE[i])
sumy2 = sumy2 + CLOSE[i]
NEXT
ecartType2 = SQRT(sumy22 / p2 - SQUARE(sumy2 / p2))
ELSE
ecartType2 = UNDEFINED
ENDIF
bollSup2 = moyenneBollinger2 + s * ecartType2
bollInf2 = moyenneBollinger2 - s * ecartType2
//p3
moyenneBollinger3 = AVERAGE[p3](CLOSE)
IF BARINDEX >= p3-1 THEN
sumy23 = 0
sumy3 = 0
FOR i = 0 TO p3-1
sumy23 = sumy23 + SQUARE(CLOSE[i])
sumy3 = sumy3 + CLOSE[i]
NEXT
ecartType3 = SQRT(sumy23 / p3 - SQUARE(sumy3 / p3))
ELSE
ecartType3 = UNDEFINED
ENDIF
bollSup3 = moyenneBollinger3 + s * ecartType3
bollInf3 = moyenneBollinger3 - s * ecartType3
//p4
moyenneBollinger4 = AVERAGE[p4](CLOSE)
IF BARINDEX >= p4-1 THEN
sumy24 = 0
sumy4 = 0
FOR i = 0 TO p4-1
sumy24 = sumy24 + SQUARE(CLOSE[i])
sumy4 = sumy4 + CLOSE[i]
NEXT
ecartType4 = SQRT(sumy24 / p4 - SQUARE(sumy4 / p4))
ELSE
ecartType4 = UNDEFINED
ENDIF
bollSup4 = moyenneBollinger4 + s * ecartType4
bollInf4 = moyenneBollinger4 - s * ecartType4
//p5
moyenneBollinger5 = AVERAGE[p5](CLOSE)
IF BARINDEX >= p5-1 THEN
sumy25 = 0
sumy5 = 0
FOR i = 0 TO p5-1
sumy25 = sumy25 + SQUARE(CLOSE[i])
sumy5 = sumy5 + CLOSE[i]
NEXT
ecartType5 = SQRT(sumy25 / p5 - SQUARE(sumy5 / p5))
ELSE
ecartType5 = UNDEFINED
ENDIF
bollSup5 = moyenneBollinger5 + s * ecartType5
bollInf5 = moyenneBollinger5 - s * ecartType5

return bollSup1 AS "Boll1+", bollInf1 AS "Boll1-", bollSup2 AS "Boll2+", bollInf2 AS "Boll2-", bollSup3 AS "Boll3+", bollInf3 AS "Boll3-", bollSup4 AS "Boll4+", bollInf4 AS "Boll4-", bollSup5 AS "Boll5+", bollInf5 AS "Boll5-"
When using “UPDATEONCLOSE”, the data of the selected timeframe update once at each new Close (so you get the last period value until a new period has closed).
To get the real time value, remove the word “UPDDATEONCLOSE”.
I have the same result, no matter the mode, same shifts.
Thx for the help
Even try on version 12, and with other maket (DJ30, NASDAQ)
Even with this simple code i got this shifts.
TIMEFRAME(5000ticks)

//p1
bollSup1=BollingerUp[20](close)
bollInf1=BollingerDown[20](close)


return bollSup1 AS "Boll1+", bollInf1 AS "Boll1-"
So it’s working when you are using this with min and not tick, so just buged I think ?
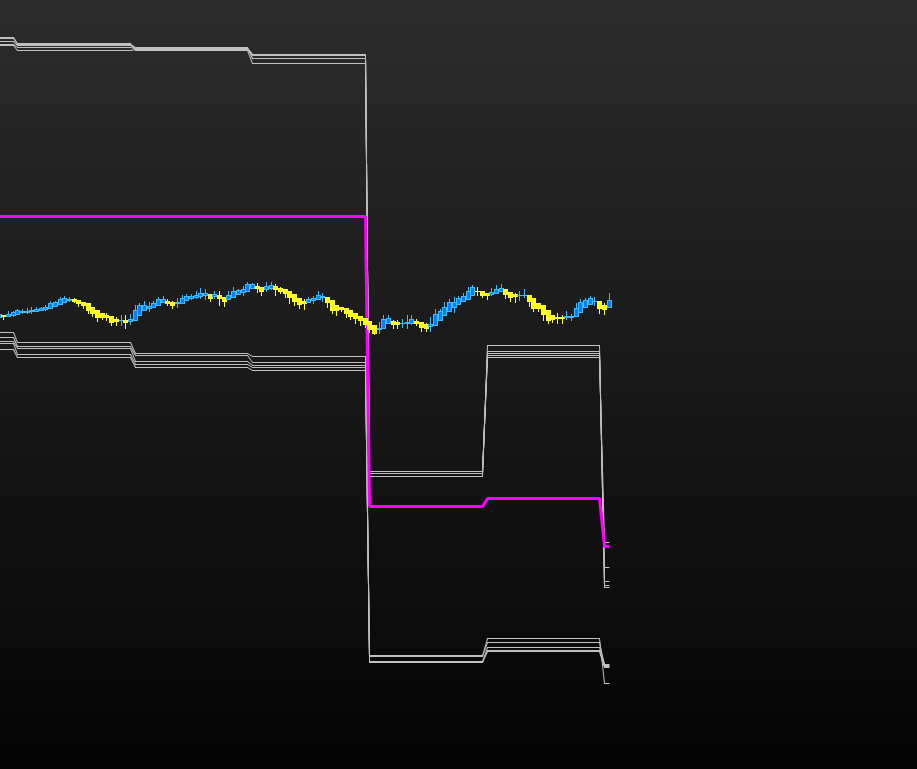
The big “shift” that you observe is normal in the history. Indeed, if we calculate a data with the help of X candles (period = X), then as soon as a new candlestick is opened (here the 5000-ticks), we remove the candlestick 1 to replace it by the new candlestick that is created in real time, so according to the price difference we can observe big steps.
On the other hand, in real time, on the time-decorrelated charts, there is a problem on the current candlestick, this problem is known and is being solved. Note that this problem exists only for charts not correlated to time (like ticks, or volume candlesticks for example).
I understood, so no solution.
I thought the 5000 ticks was streamer on the 200 for example. But if it is recalculated with the current candle it is logical that I have large gaps, I thought the updateonclose would solve this problem but no.
Do you know if this is something that is taken into account quickly? because even on version 12 it is the same. To summarize, the “timeframe” just doesn’t work with ticks and volume.
Any way to get around this ?
Thx you for your help
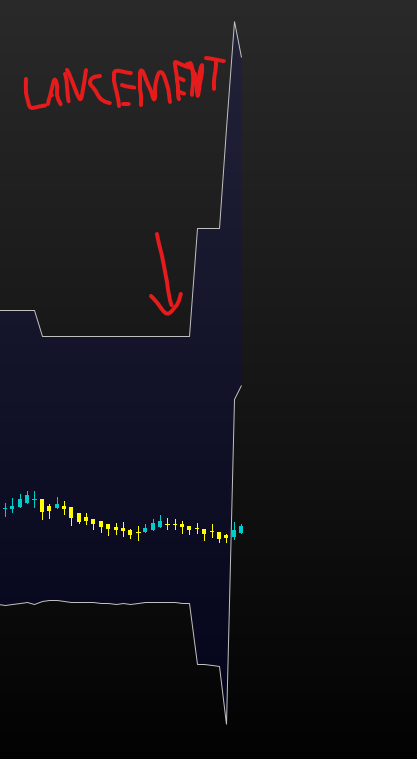
The big “shift” that you observe is normal in the history. Indeed, if we calculate a data with the help of X candles (period = X), then as soon as a new candlestick is opened (here the 5000-ticks), we remove the candlestick 1 to replace it by the new candlestick that is created in real time, so according to the price difference we can observe big steps.
What I describe above is the normal behavior (understand logical) and it is not an issue. When you calculate a 20-period moving average, when a new candle open, the first candlestick close of the serie is removed and replace with the new one in order to get only the 20 last (including current one) candlesticks values. You cannot spot any difference (gap) when applying the MA on a chart, but by observing its calculation in an smaller timeframe that difference is easily spottable. Hope I’m clear.. 🙂
On the other hand, in real time, on the time-decorrelated charts, there is a problem on the current candlestick, this problem is known and is being solved. Note that this problem exists only for charts not correlated to time (like ticks, or volume candlesticks for example).
Even with UPDATEONCLOSE, there is indeed a problem on current candlestick only, I have no ETA about the fix but should be soon.