hello,
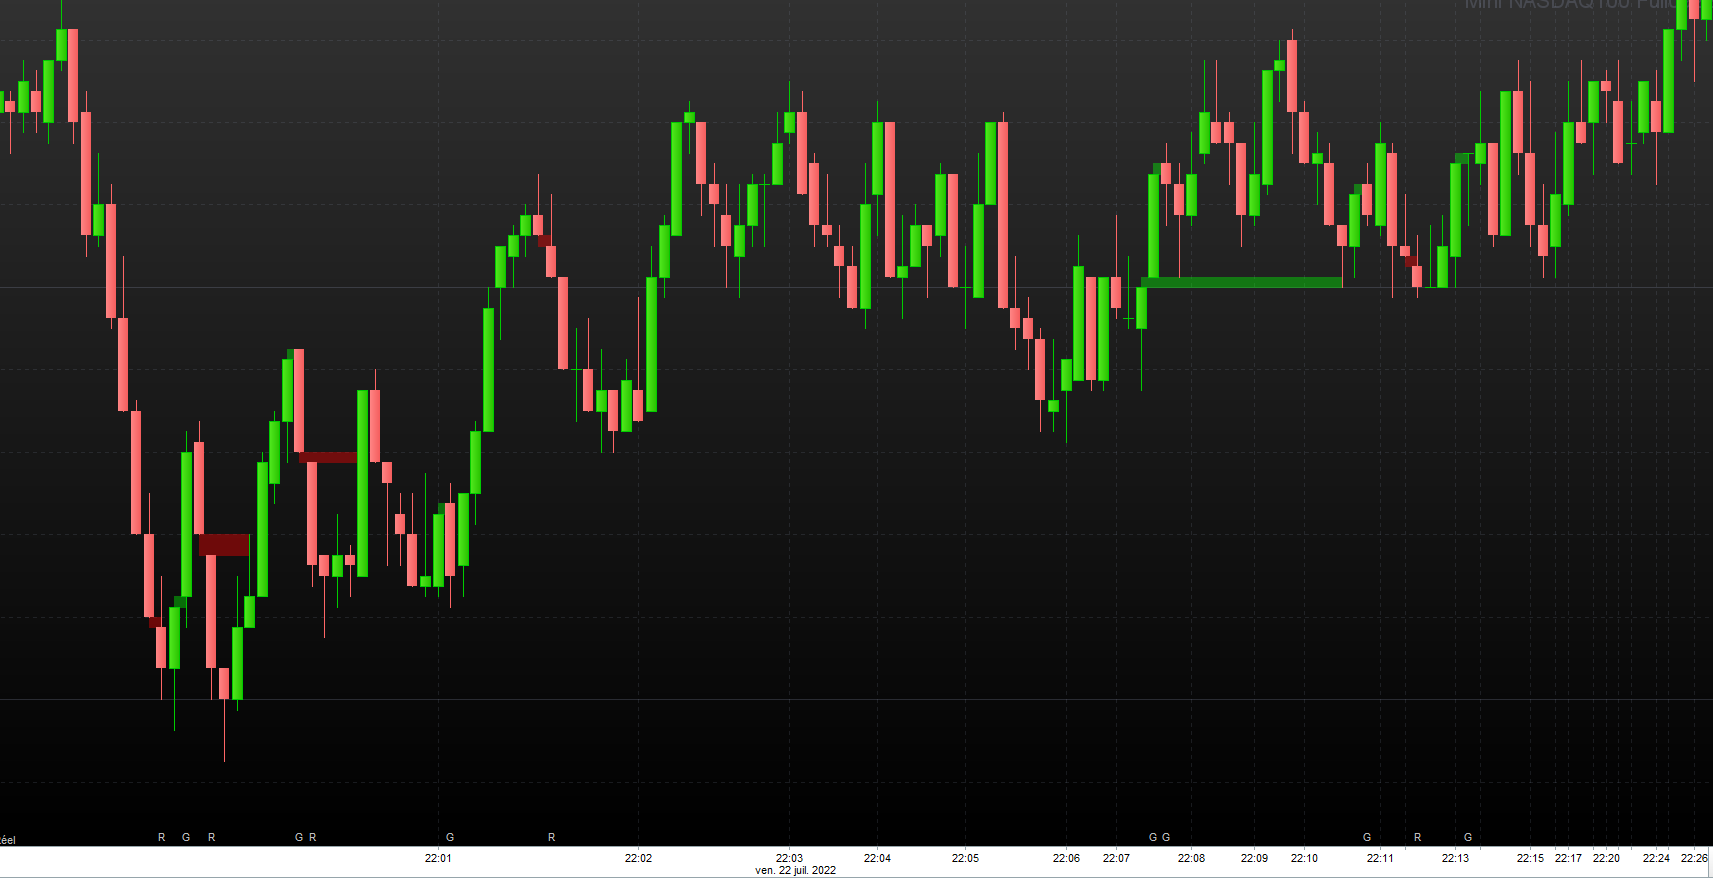
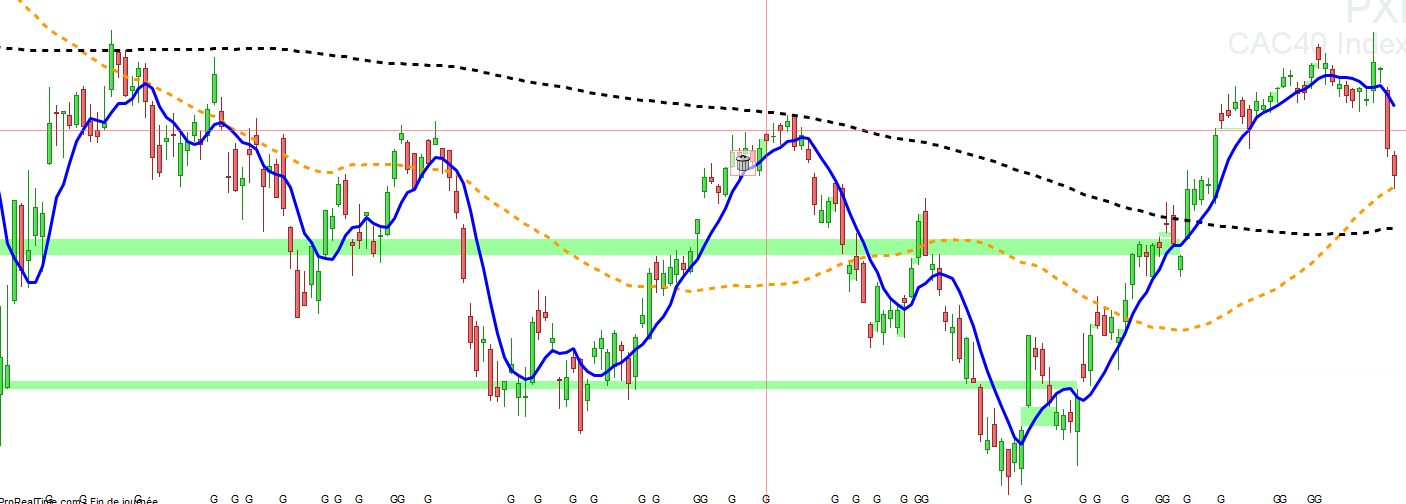
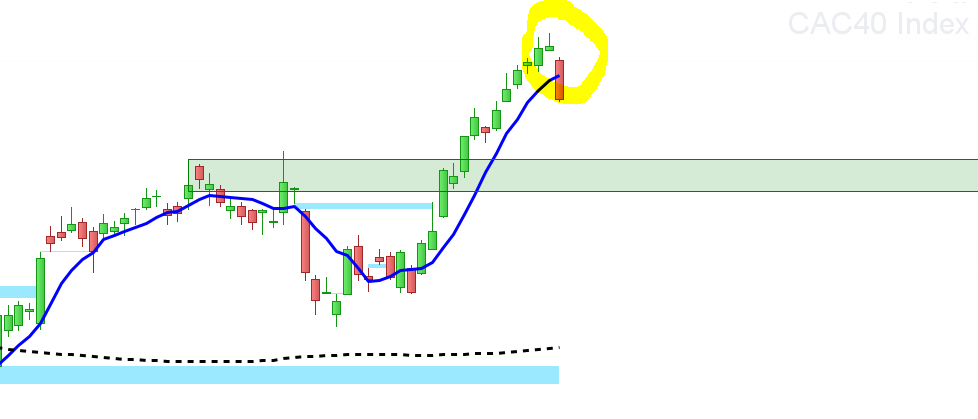
les rectangles s affichent jusqu’à un comblement complet. Plus la variable X est grande, plus on remonte dans le temps pour détecter des vieux gaps. C’était l’idée de base 🙂
il y a des améliorations à faire, parfois, il y a un phénomène de delay dans l affichage.
voici les deux scripts originaux. Un script rouge et un script vert, gap rouge = baisse et gap vert = hausse
// original creators: druby & sharteel from prorealcode forum on 2022
//defparam drawonlastbaronly=true
once count=-1 // arr[count]
X = 500 // lookback/search scope
// on injecte les datas dans les tableaux // we inject the data into the arrays
// red gap
if open<low[1] then // condition
count = count+1 // count for array index on true condition
toto=1
$x1[count]=barindex[1] // data set = [ $x1, $y1, $y2, later $x2 ]
$y1[count]=low[1]
$y2[count]=open
r=255
g=0
b=0
endif
if islastbarupdate then
if barindex > X then // reduce search to within scope
z=barindex-X
endif
for i = 0 to lastset($x1) // loop through each data set index
if $x1[i] < z then // shorten loop, test if x1 is within X lookback scope
continue // jump to next loop iteration, dont do this data set, out of 'X' scope
else
for j = $x1[i]+1 to barindex // loop forward though each data set in scope
if high[barindex[j]] >= $y1[i] then // compare indexed high with y1
$x2[i] = barindex-barindex[j] // if true store in arr $x2
break
endif // break out of loop, if x2 found
next
endif
next
// on lit les tableaux
for i = 1 to lastset($x1) do
if $x1[i] < z then // limit drawing to scope X
continue // miss iteration if out of scope
else
if $x2[i]>0 then
drawrectangle($x1[i],$y1[i],$x2[i],$y2[i]) coloured(r,g,b,100) bordercolor(0,0,0,0)
else
drawrectangle($x1[i],$y1[i],barindex,$y2[i]) coloured(r,g,b,100) bordercolor(0,0,0,0)
endif
endif
next
// end of islastbarupdate
endif
// control
if open<low[1] then
drawtext("R",barindex,10)anchor(bottom,index,yShift) // R for red gap
endif/*
if open>High[1] then
drawtext("G",barindex,10)anchor(bottom,index,yShift) // G for green gap
endif*/
return
// original creators: druby & sharteel from prorealcode forum on 2022
//defparam drawonlastbaronly=true
once count=-1  // arr[count]

X = 500  // lookback/search scope

// on injecte les datas dans les tableaux  // we inject the data into the arrays

// green gap
if open>high[1] then  // condition
count = count+1  // count for array index on true condition

$x1[count]=barindex[1]  // data set = [ $x1, $y1, $y2, later  $x2 ]
$y1[count]=high[1]
$y2[count]=open
r=0
g=255
b=0

endif

if islastbarupdate then

if barindex > X then  // reduce  search to within scope
z=barindex-X
endif

for i = 0 to lastset($x1)           // loop through each data set index
if $x1[i] <  z then              // shorten loop, test if x1 is within X lookback scope
continue                      // jump to next loop iteration, dont do this data set, out of 'X' scope
else
for j = $x1[i]+1 to barindex    // loop forward though each data set in scope

if low[barindex[j]] <= $y1[i]  then  // compare indexed high with y1
$x2[i] = barindex-barindex[j]     // if true store in arr $x2
break                             // break out of loop, if x2 found
endif

next

endif
next

// on lit les tableaux
for i = 1 to lastset($x1) do
if $x1[i] < z then  // limit drawing to scope X
continue // miss iteration if out of scope
else
if $x2[i]>0 then
drawrectangle($x1[i],$y1[i],$x2[i],$y2[i]) coloured(r,g,b,100) bordercolor(0,0,0,0)
else
drawrectangle($x1[i],$y1[i],barindex,$y2[i]) coloured(r,g,b,100) bordercolor(0,0,0,0)
endif
endif
next

// end of islastbarupdate
endif

// control
if open>High[1] then
drawtext("G",barindex,10)anchor(bottom,index,yShift) // G for green gap
endif
return
+++