


EMA based on price and 3 ATR (Keltner) channels above and below the EMA

Viewing 8 posts - 1 through 8 (of 8 total)
  • Author
    Posts
  • #130424 quote
    rassomrassom
    Participant
    New

    Hi  all,

    Is it possible to make the following indicator/screener in PRT in some way?

    It’s a little bit like Percent Of Stocks Above X-Day Average, i.e. https://www.barchart.com/stocks/quotes/$MMTW/technical-chart, but with ATR instead.

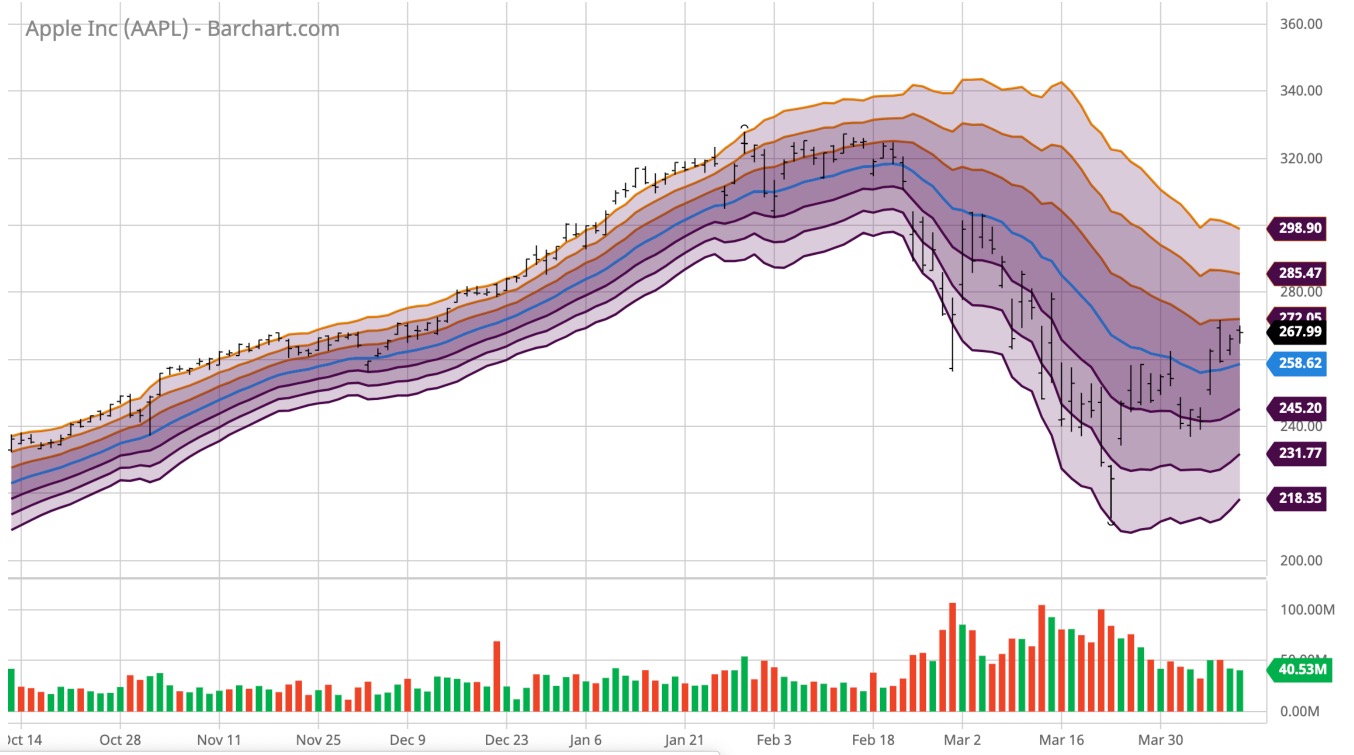
    Please see attached screenshot: As you can see in the chart, I have an EMA based on price and 3 ATR (Keltner) channels above and below the EMA, so 6 ATR channel lines in total.

    What I want is this:
    Have a screener or – preferably a chart indicator, i.e. a line chart – showing the % of all US stocks (the around 4,600 “normal” stocks that are not ETFs and not OTC stocks) that are currently above or below their X ATR channel, i.e. above +2 ATR. It should be on a weekly and/or daily chart, i.e. close values, live prices not necessary.

    If it’s possible in PRT, who can program it and what will the cost be?

    Best regards,
    Rasmus

    111.jpeg 111.jpeg
    #130437 quote
    NicolasNicolas
    Keymaster
    Legend

    Assistance is free on our forums. You can download an ATR channel indicator here: Multiple ATR bands or maybe this one? https://www.prorealcode.com/topic/keltner-channel-2/#post-47879

    #130439 quote
    rassomrassom
    Participant
    New

    Thanks, Nicolas.

    Unfortunately I’m not just looking to see ATR channels on a single stock. That would be pretty simple.

    Rather, I’m looking for an indicator that can display the % of i.e. 5000 different stocks that are above/below their X ATR from an EMA.

    #130440 quote
    rassomrassom
    Participant
    New

    PS. Would you please change the title of the topic accordingly? I can see it has been changed from my original title and is now not explanatory of what I want to achieve.

    #130450 quote
    NicolasNicolas
    Keymaster
    Legend

    Sorry but that’s not possible to get other instrument data than the one actually displayed, by code.

    #130454 quote
    rassomrassom
    Participant
    New

    Ok, thanks. Would it be possible to create a scanner that gauges the % of stocks over/below a certain ATR from an EMA?

    #130483 quote
    NicolasNicolas
    Keymaster
    Legend

    No, because a screener code only check 1 stock at once and therefore cannot cumulate results over the complete list.

    #130524 quote
    rassomrassom
    Participant
    New

    Ok, I must look elsewhere than PRT then.

    Thanks for helping out! 🙂

Viewing 8 posts - 1 through 8 (of 8 total)

  • You must be logged in to reply to this topic.

ProRealAI ProRealAI New

Stuck on this ProBuilder code?

Describe what this topic is trying to build, in plain English, and ProRealAI writes the ProRealTime™ indicator, screener or system for you.

Available in 7 languages
Try ProRealAI

EMA based on price and 3 ATR (Keltner) channels above and below the EMA


ProBuilder: Indicators & Custom Tools

New Reply
Author
author-avatar
rassom @rassom Participant
Summary

This topic contains 7 replies,
has 2 voices, and was last updated by rassomrassom

6 years, 4 months ago.

Topic Details
Forum: ProBuilder: Indicators & Custom Tools
Language: English
Started: 05/07/2020
Status: Active
Attachments: 1 files
ProRealCode ProRealCode
Loading...

