Hi everyone:
Is this look good to you guys?
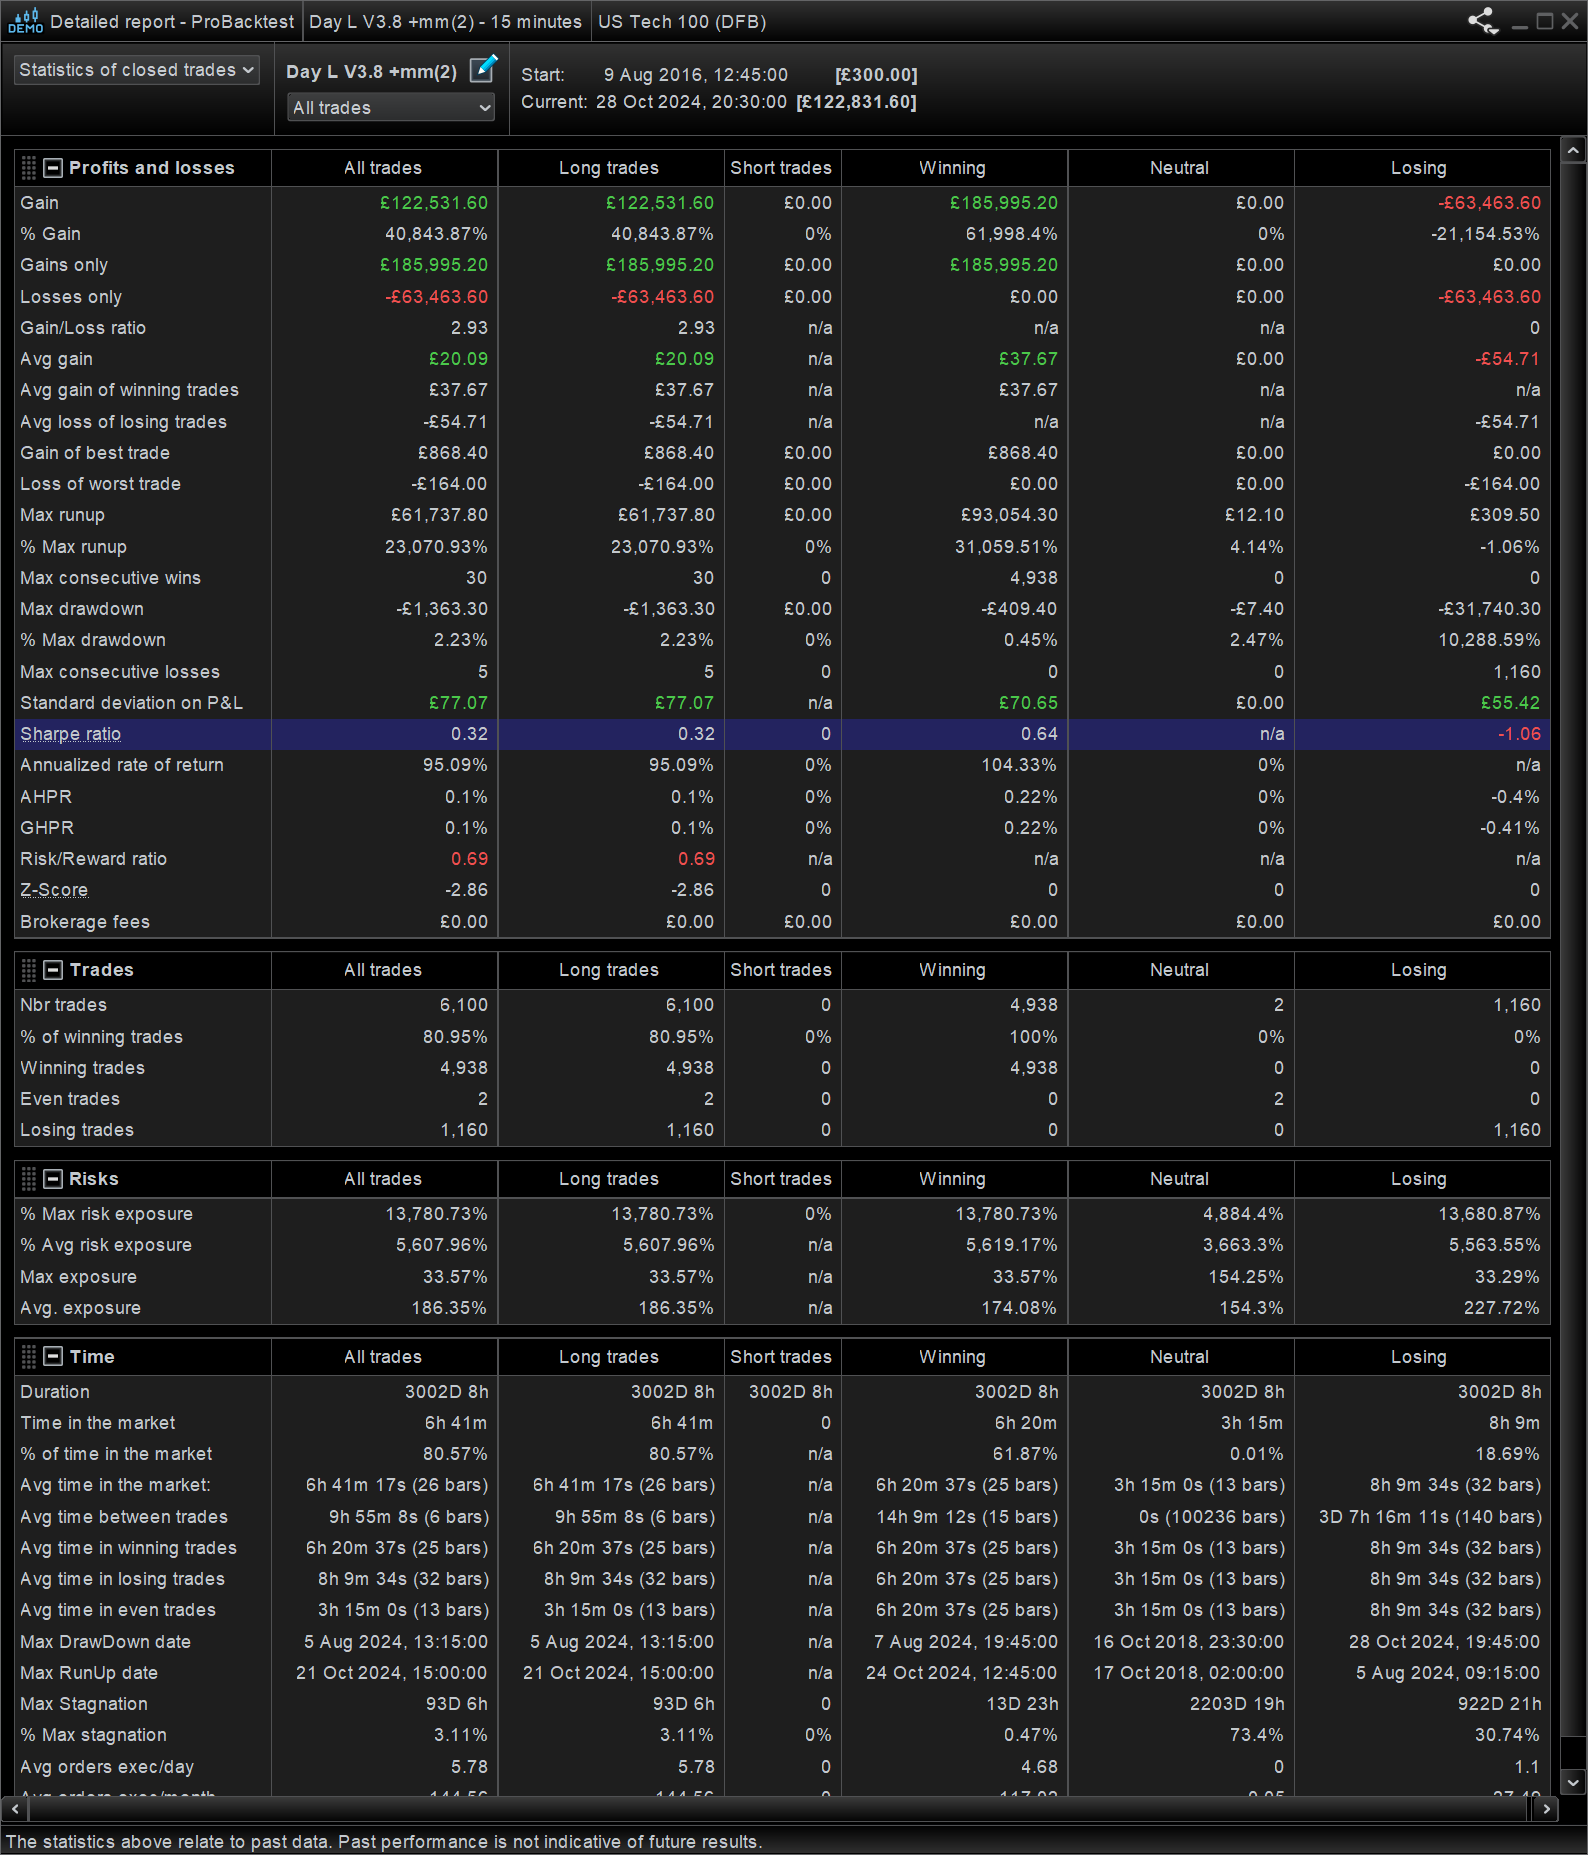
Hows time in market?
Would u like to share the code?
Always hard to judge from just a backtest. On how much data have it been developed? How much is OOS (out of sample)? Are spread included?
What is position size?
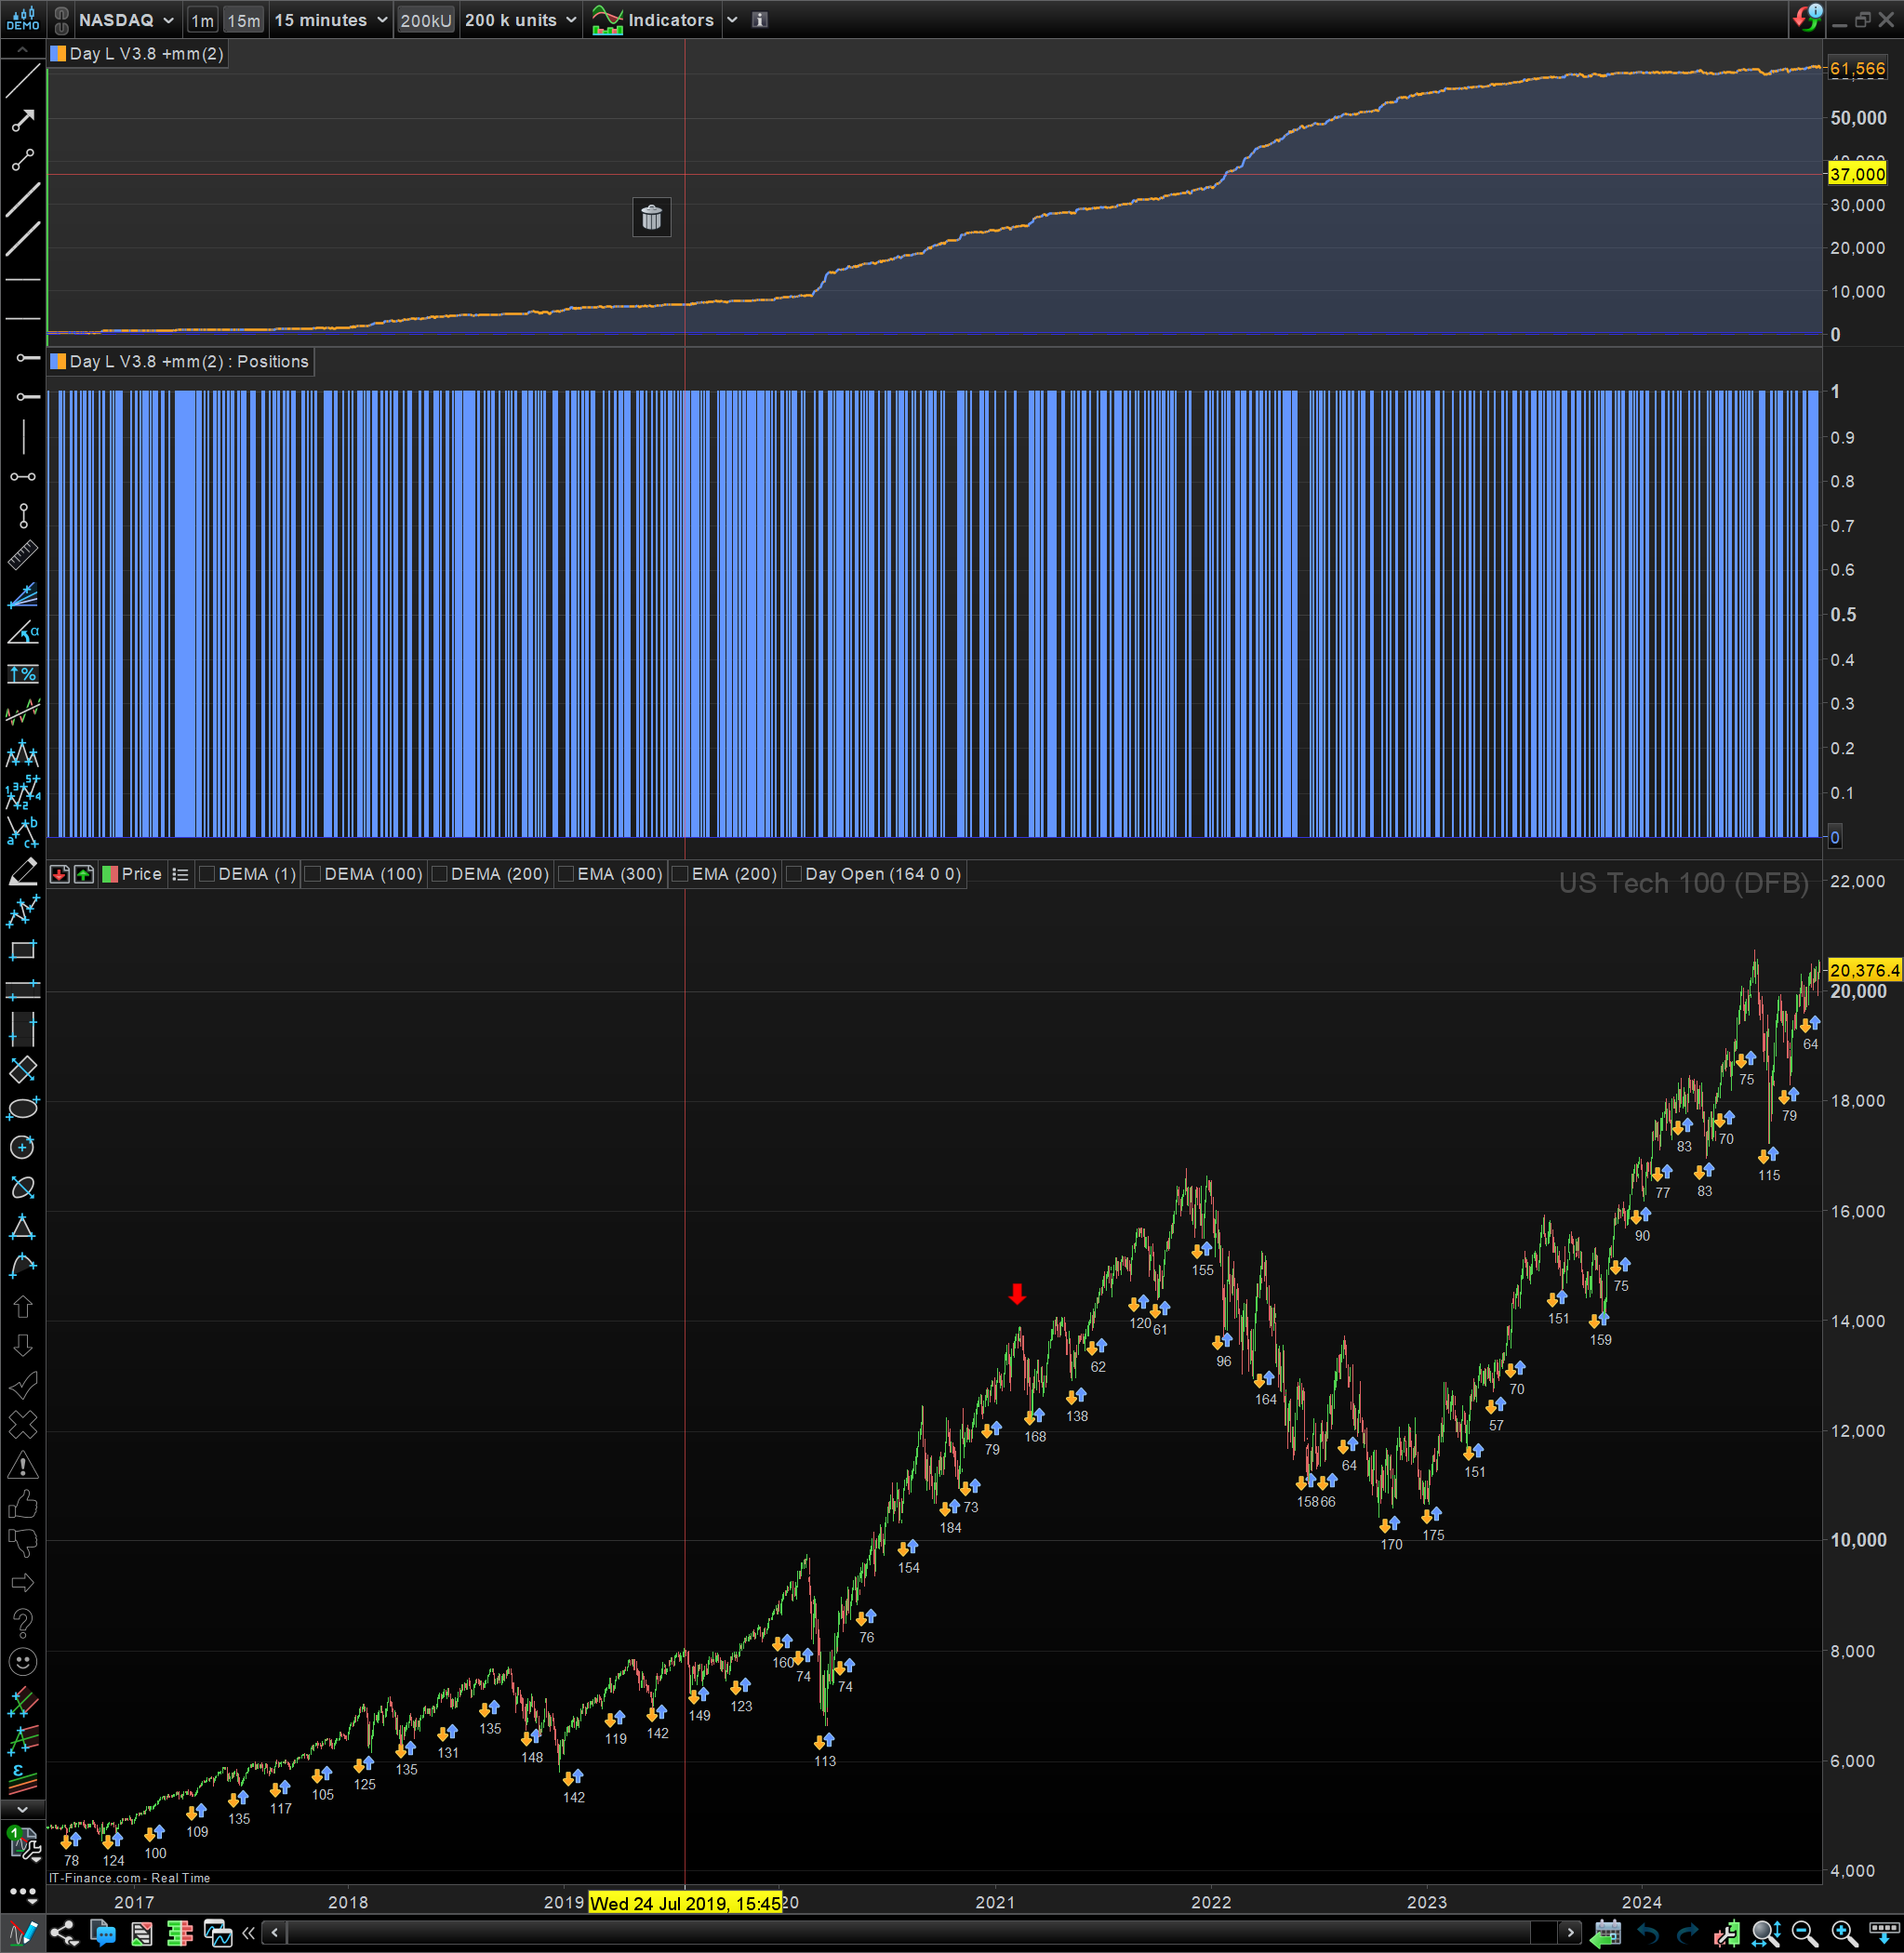
Please could you show the price curve below positions below equity curve?
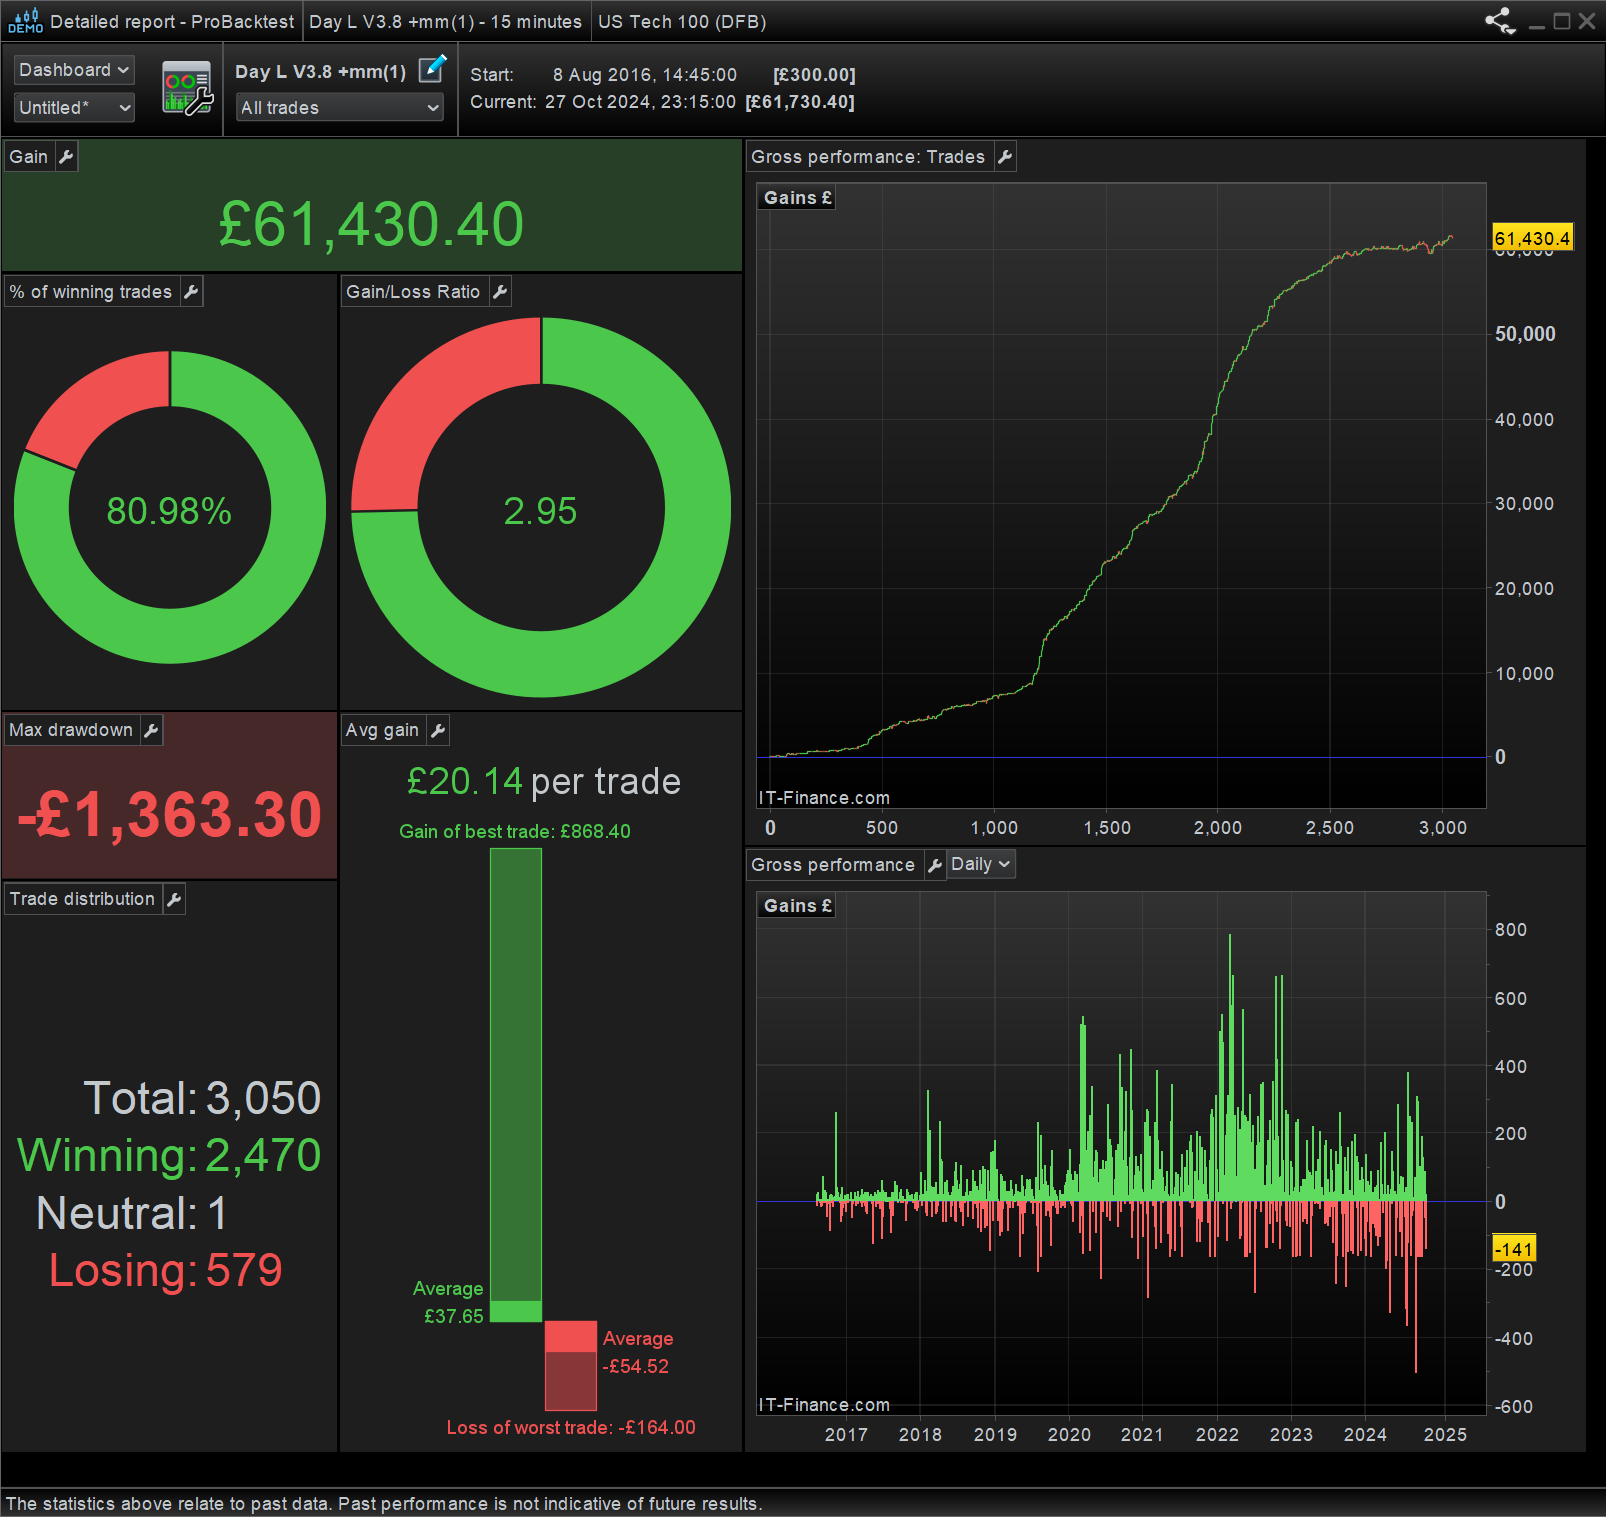
Seems from my point of view very good results.
From the duration, I conclue that the number of bars for the backtest is ok
You have a high number of trades, the spread used could highly impact the result.
I always run backtest with a slightly pessimistic spread to be on the safe side for the results.
If you do not want to share the code, but appreciate our comments, please give more details on the conditions of the backtest
hi all
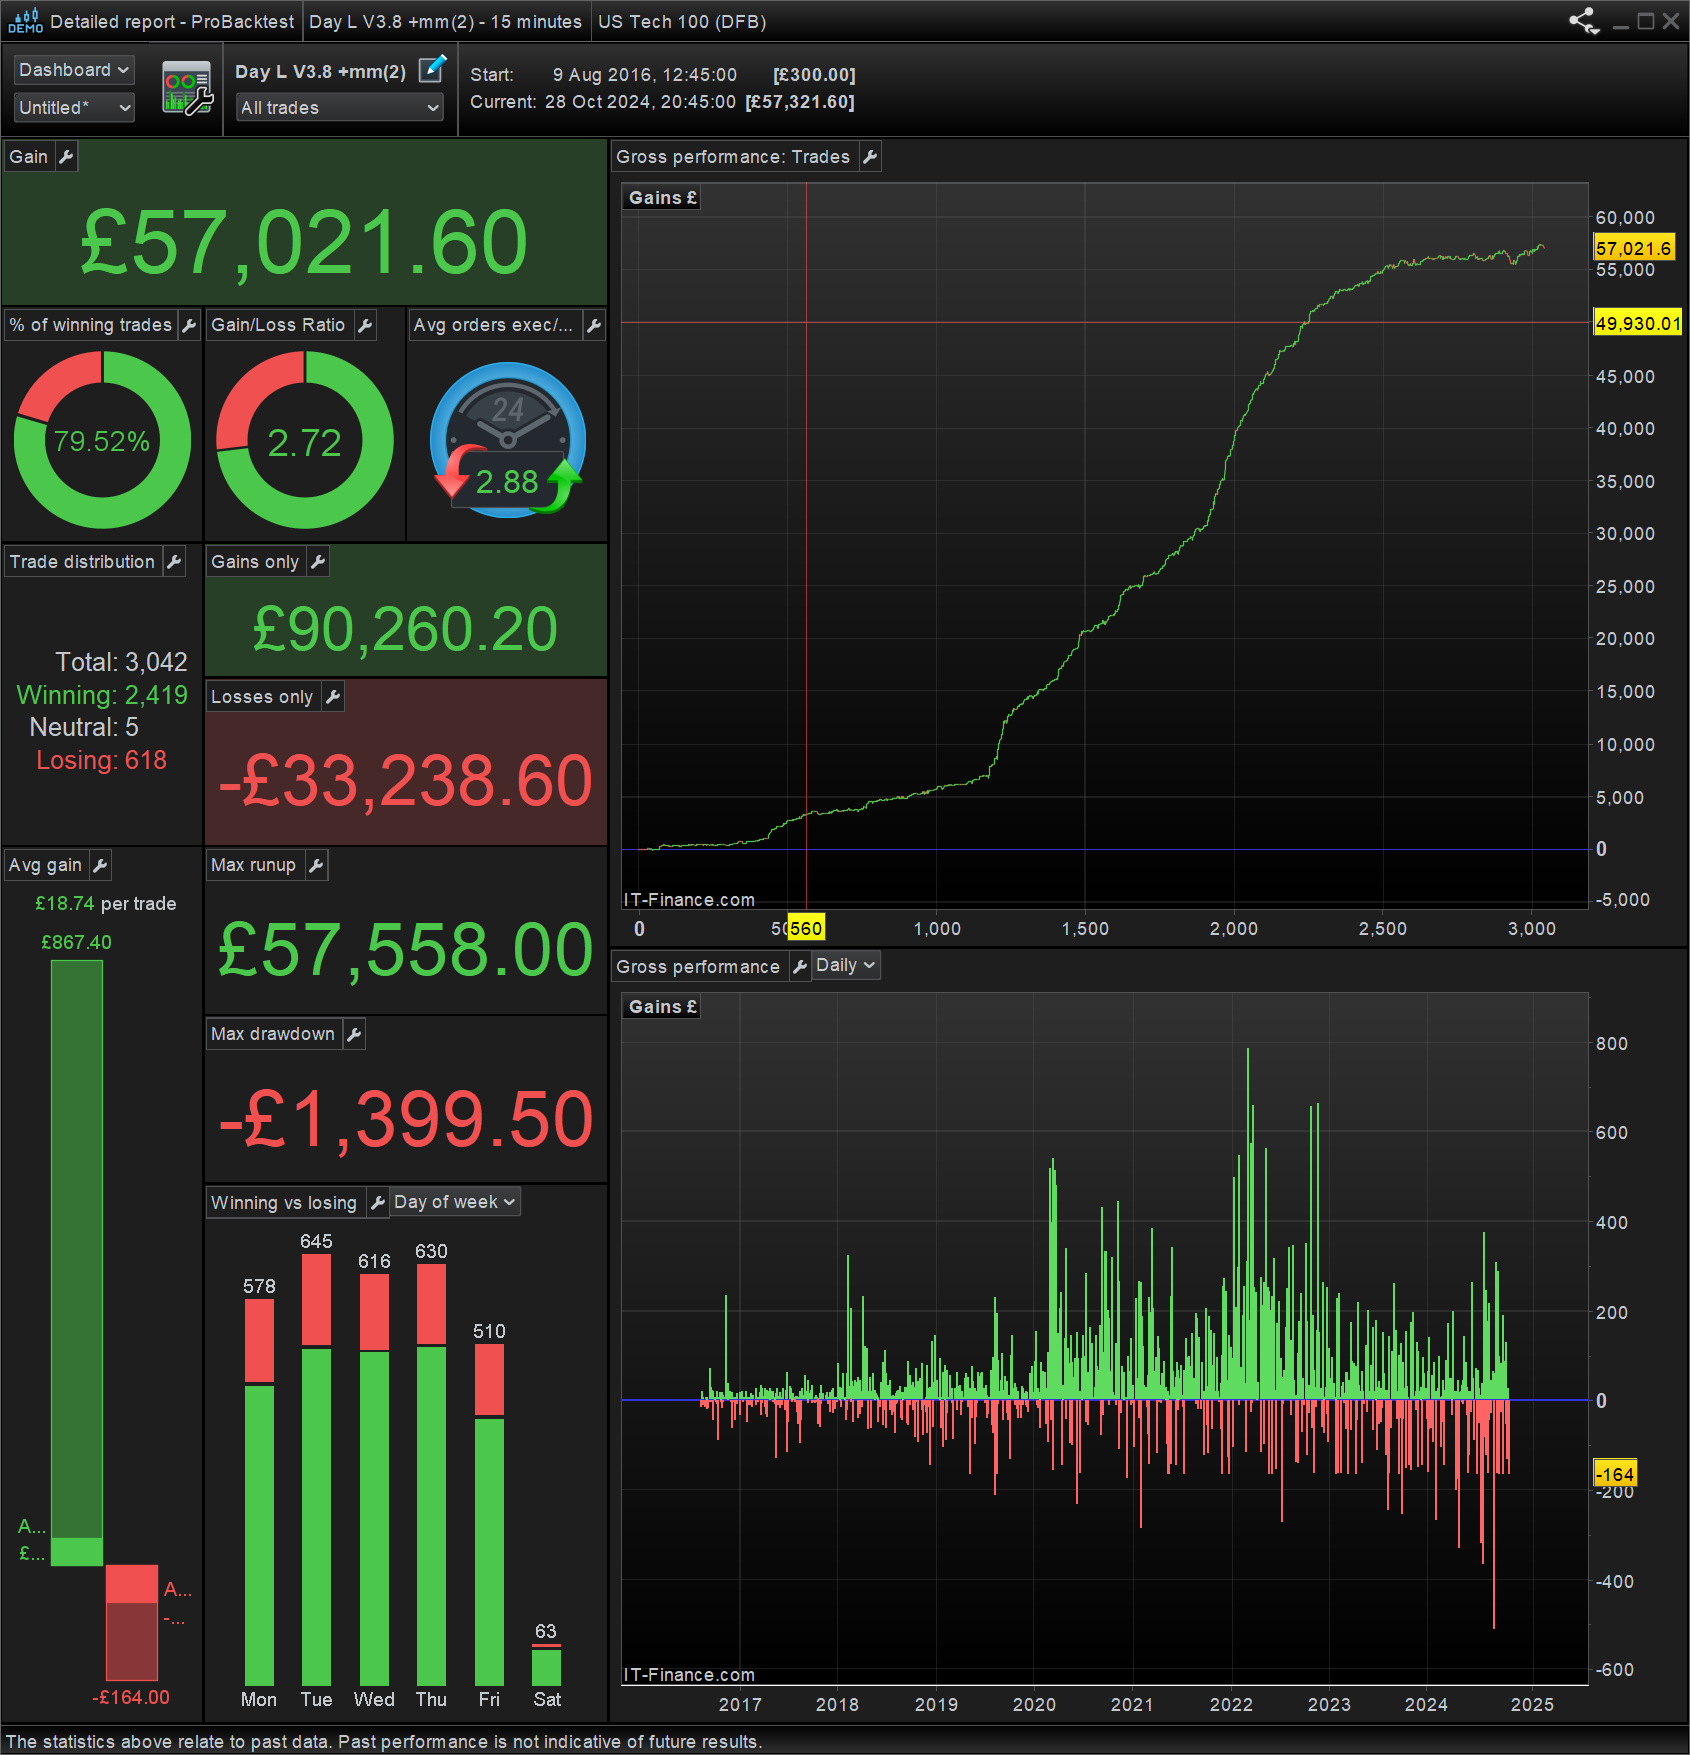
this is only for NASDAQ, the position size is 1 and the spread is 2, it is 15min, buy long only.
it is not tested with OOS (out of sample) or walk forward, as it sell each day at the end of the trade day (214500) no matter it is winning or lose, and it started again the next trade day, this way (I believe) It would have enough (OOS) and not over optimization as it close each day therefore it use each day trade as different data for almost 8 years, that is why it has this many trade though the 8 years timeframe.
not sure what you mean by the price curve below positions below equity curve? see attached
Thanks
hi all
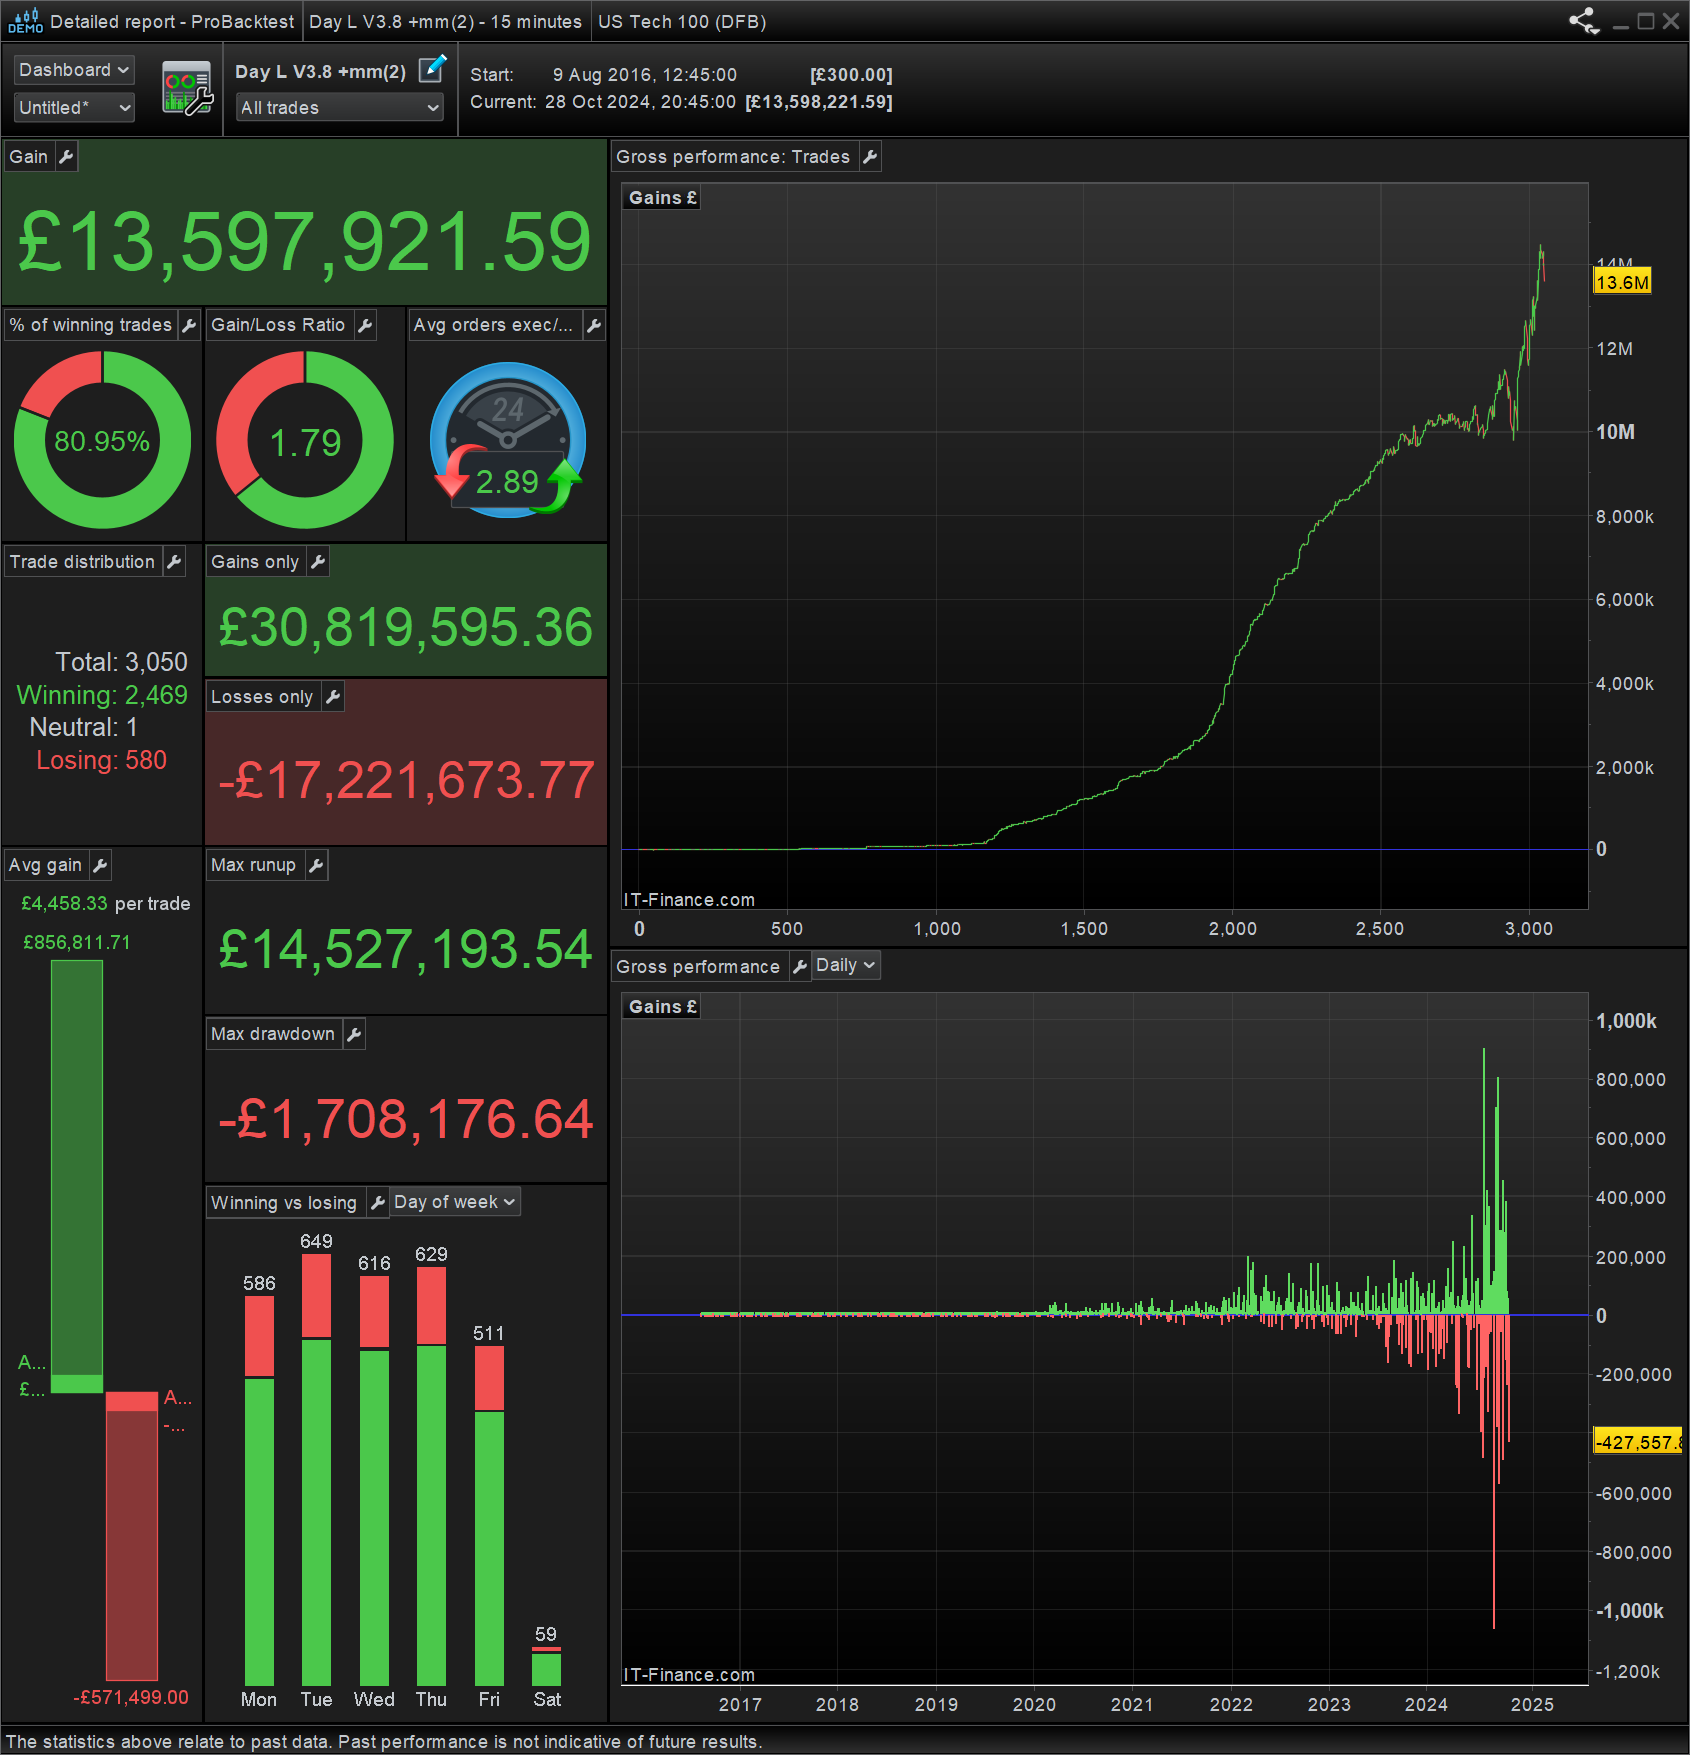
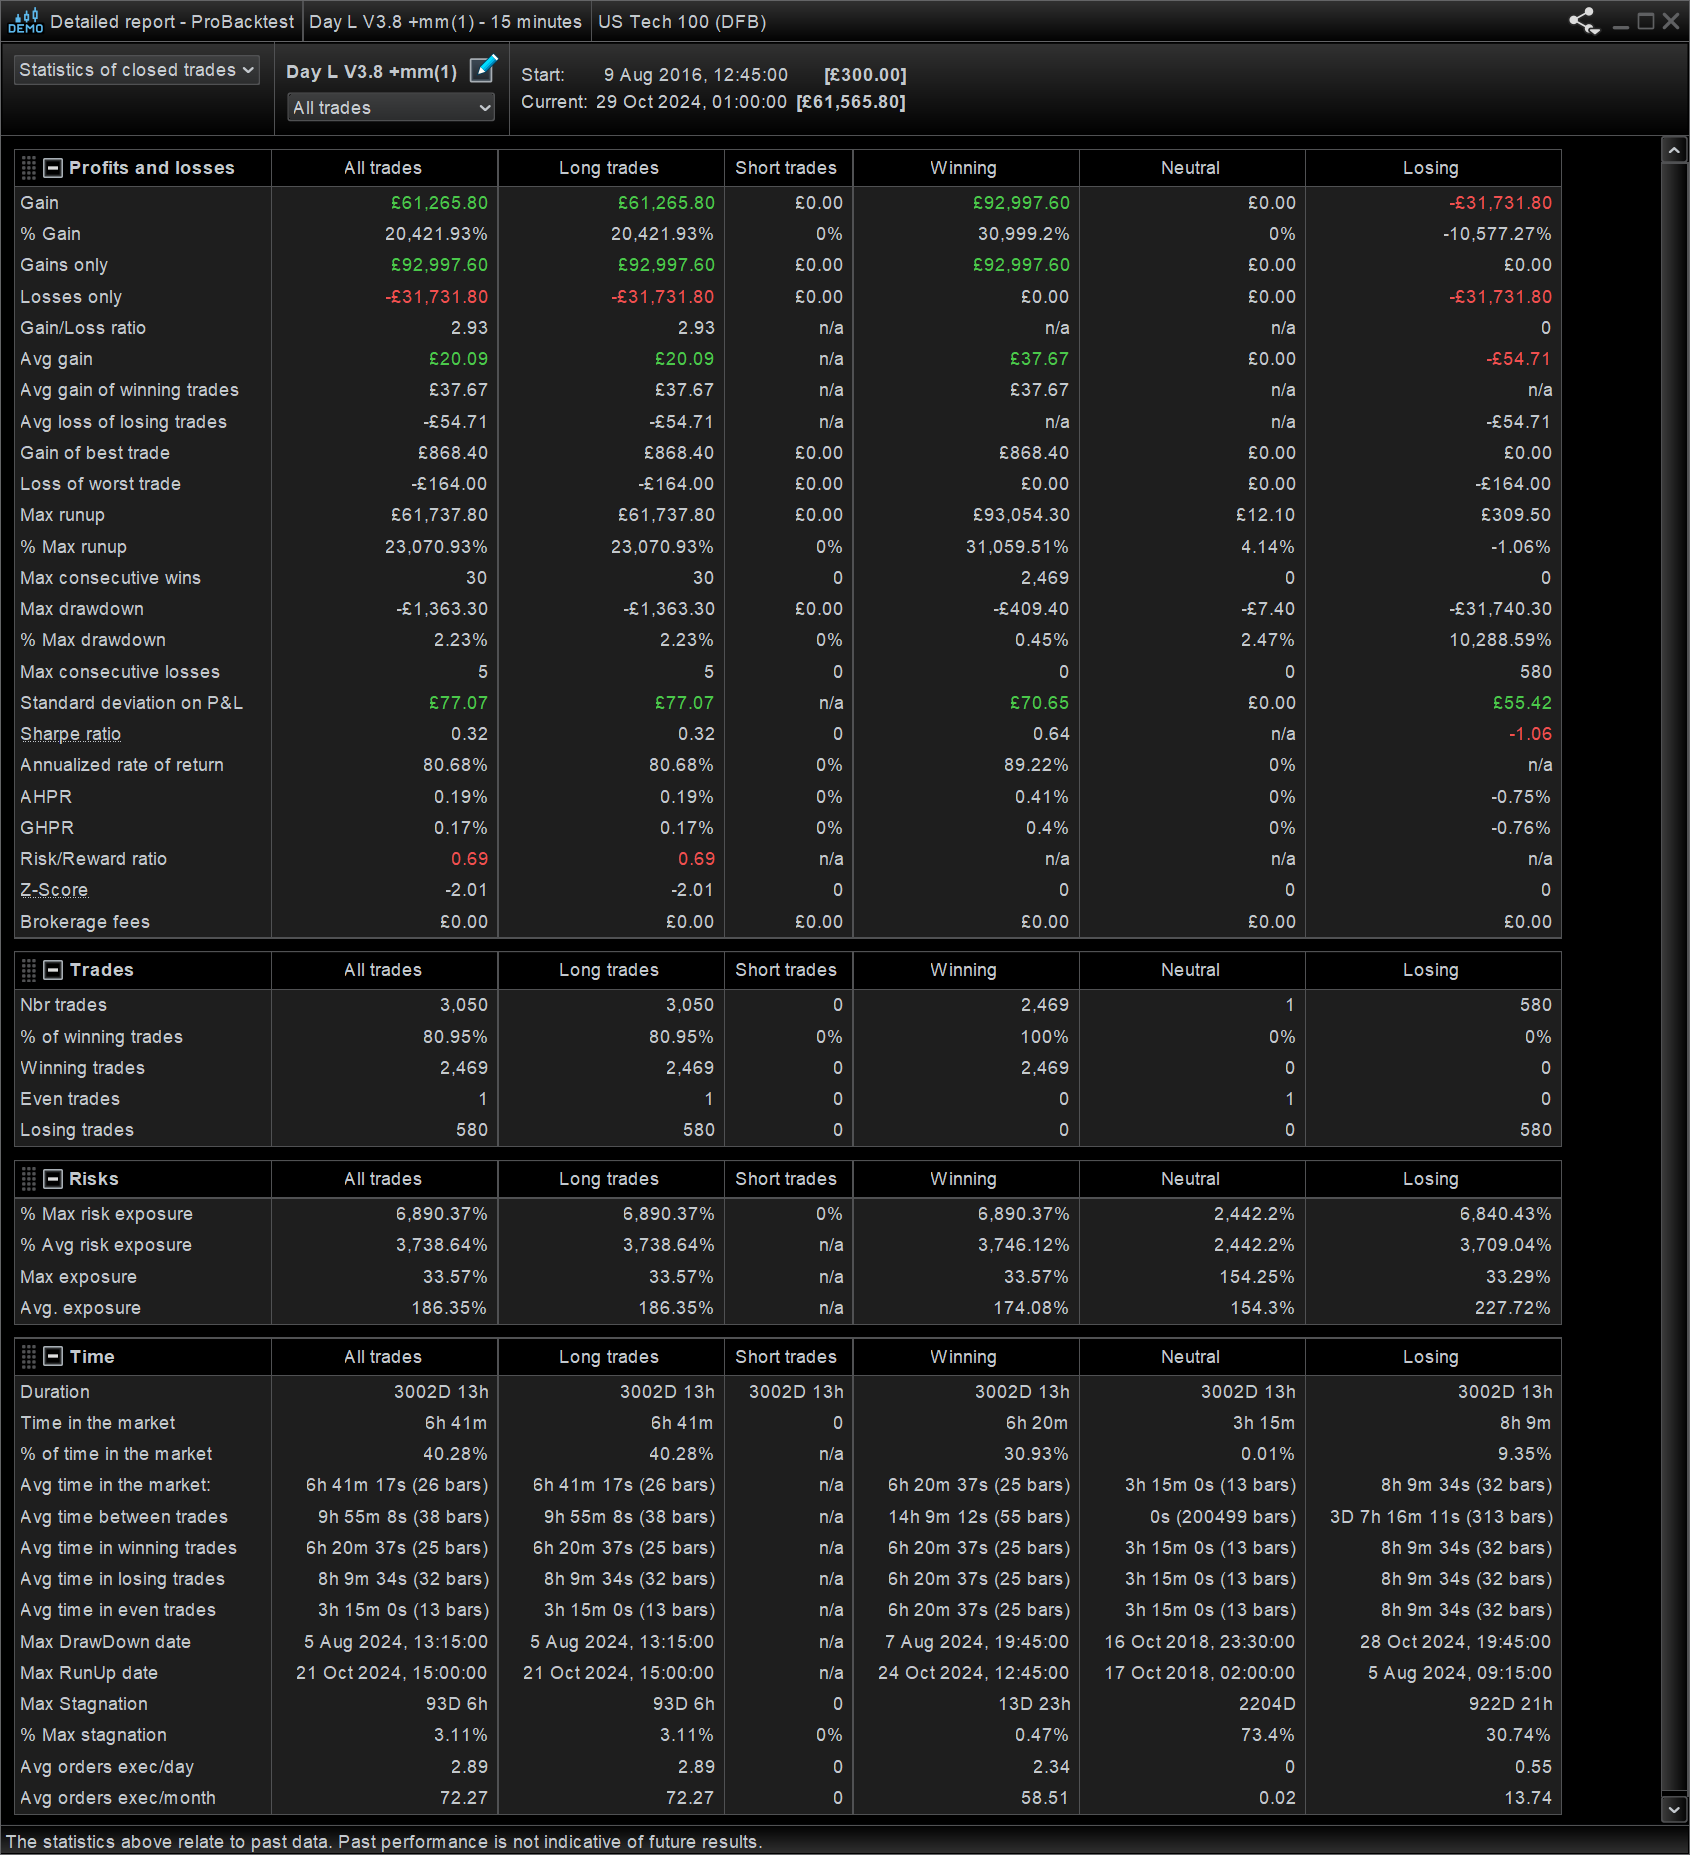
they are all started with position size is 1, same code with spread 3 and same code with spread 4 and same code with spread 2 with money management, I do think spread 2 is most suitable for the NASDAQ, you can see the trad number are all the same, it is just the result is a bit different with different spread.
Thanks
Hi All
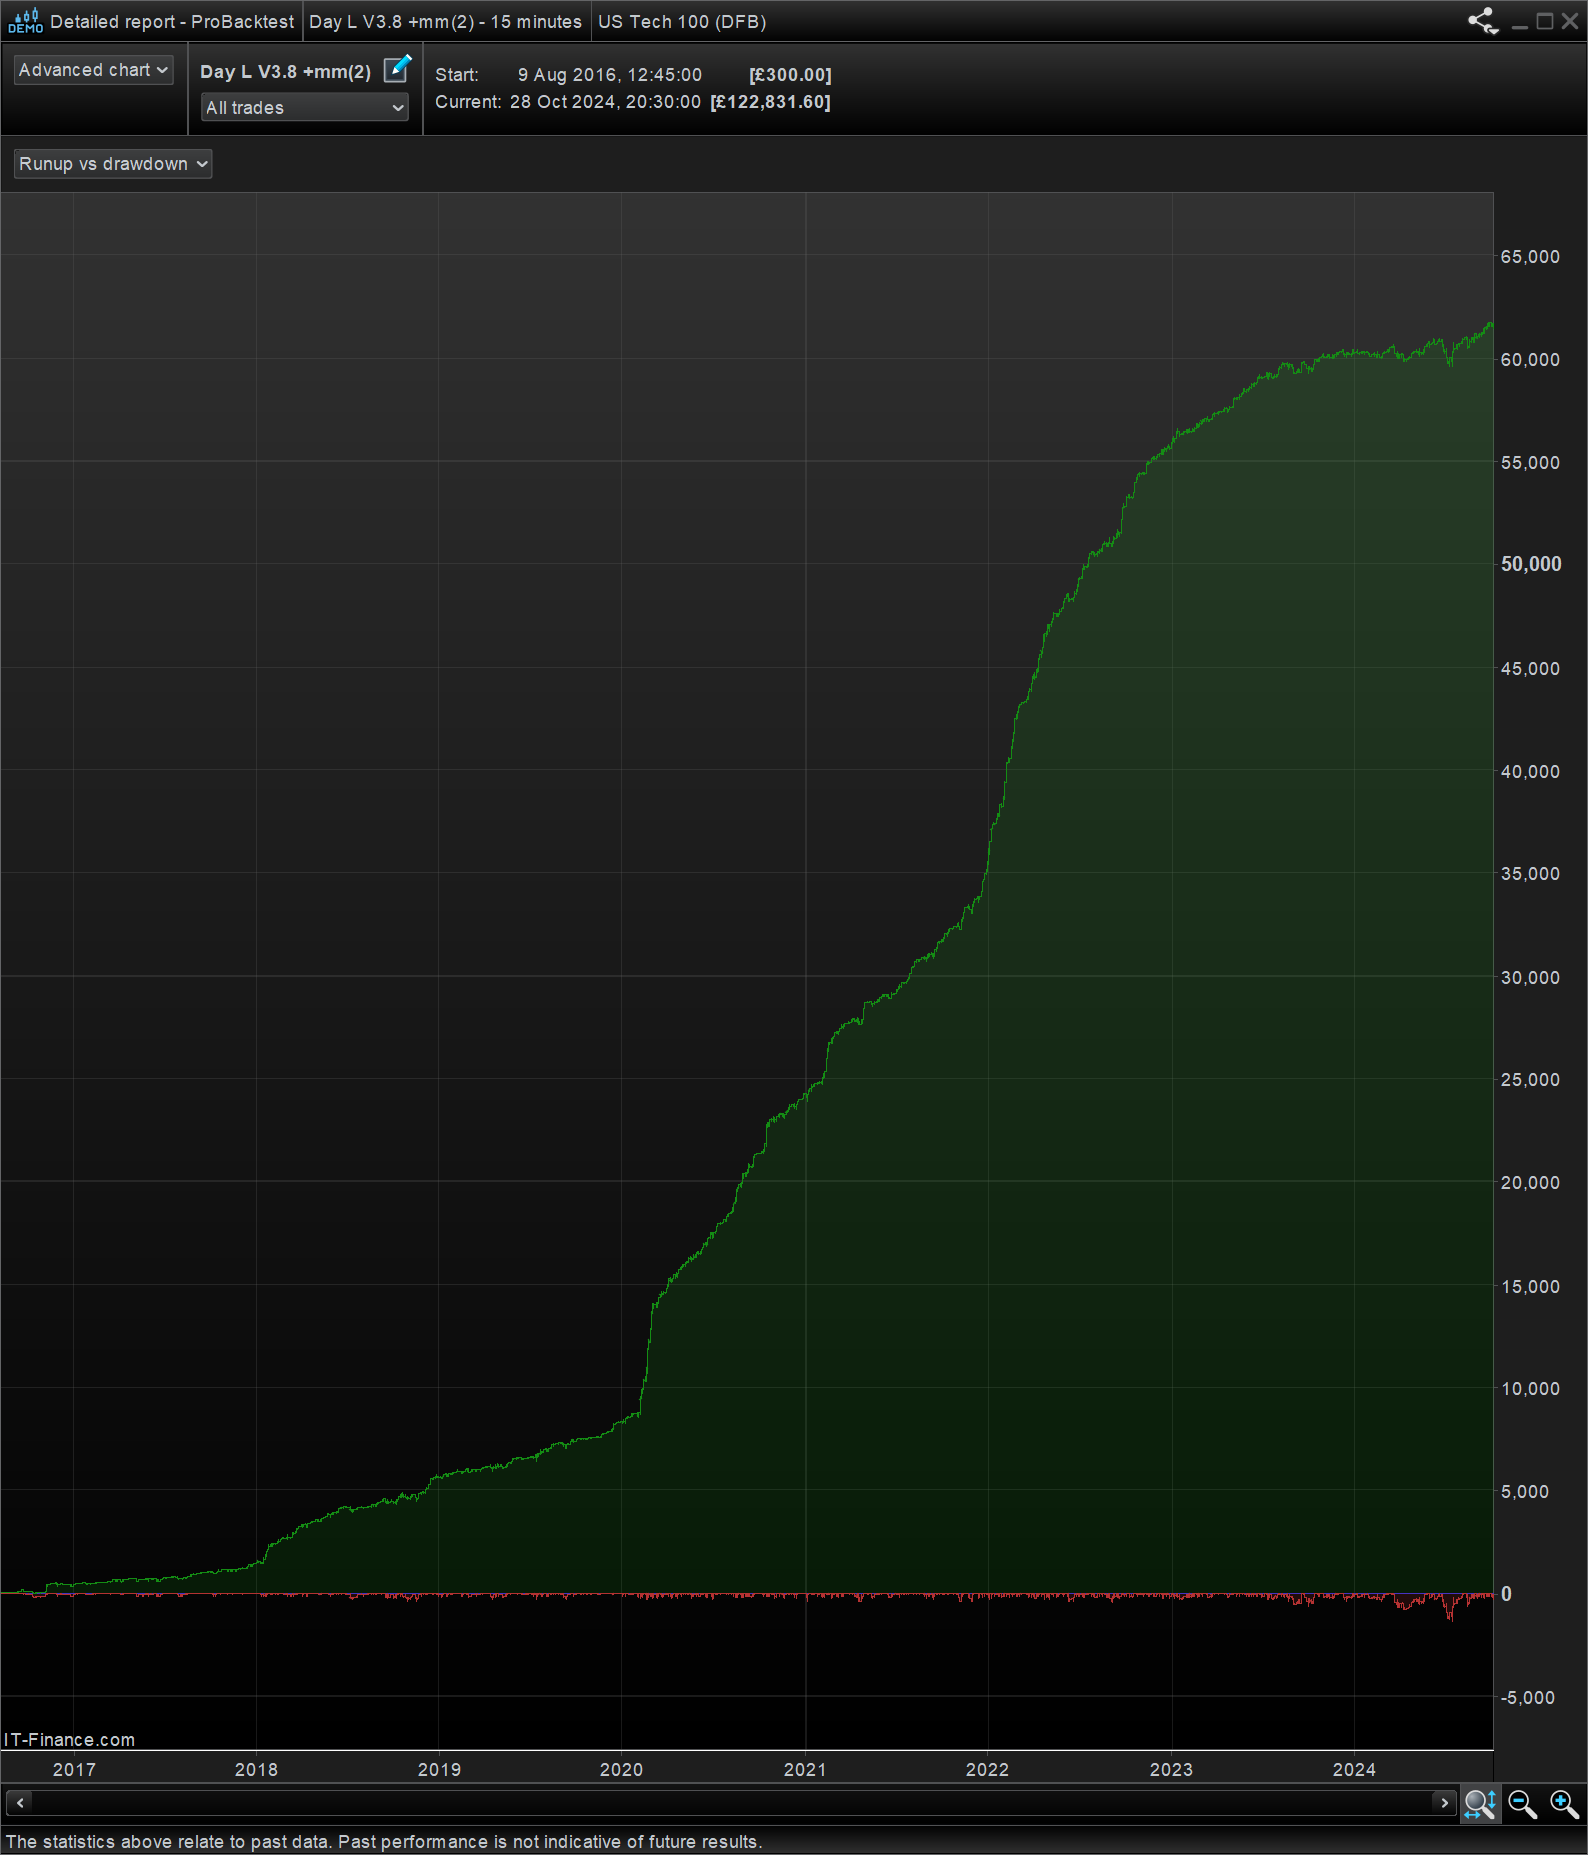
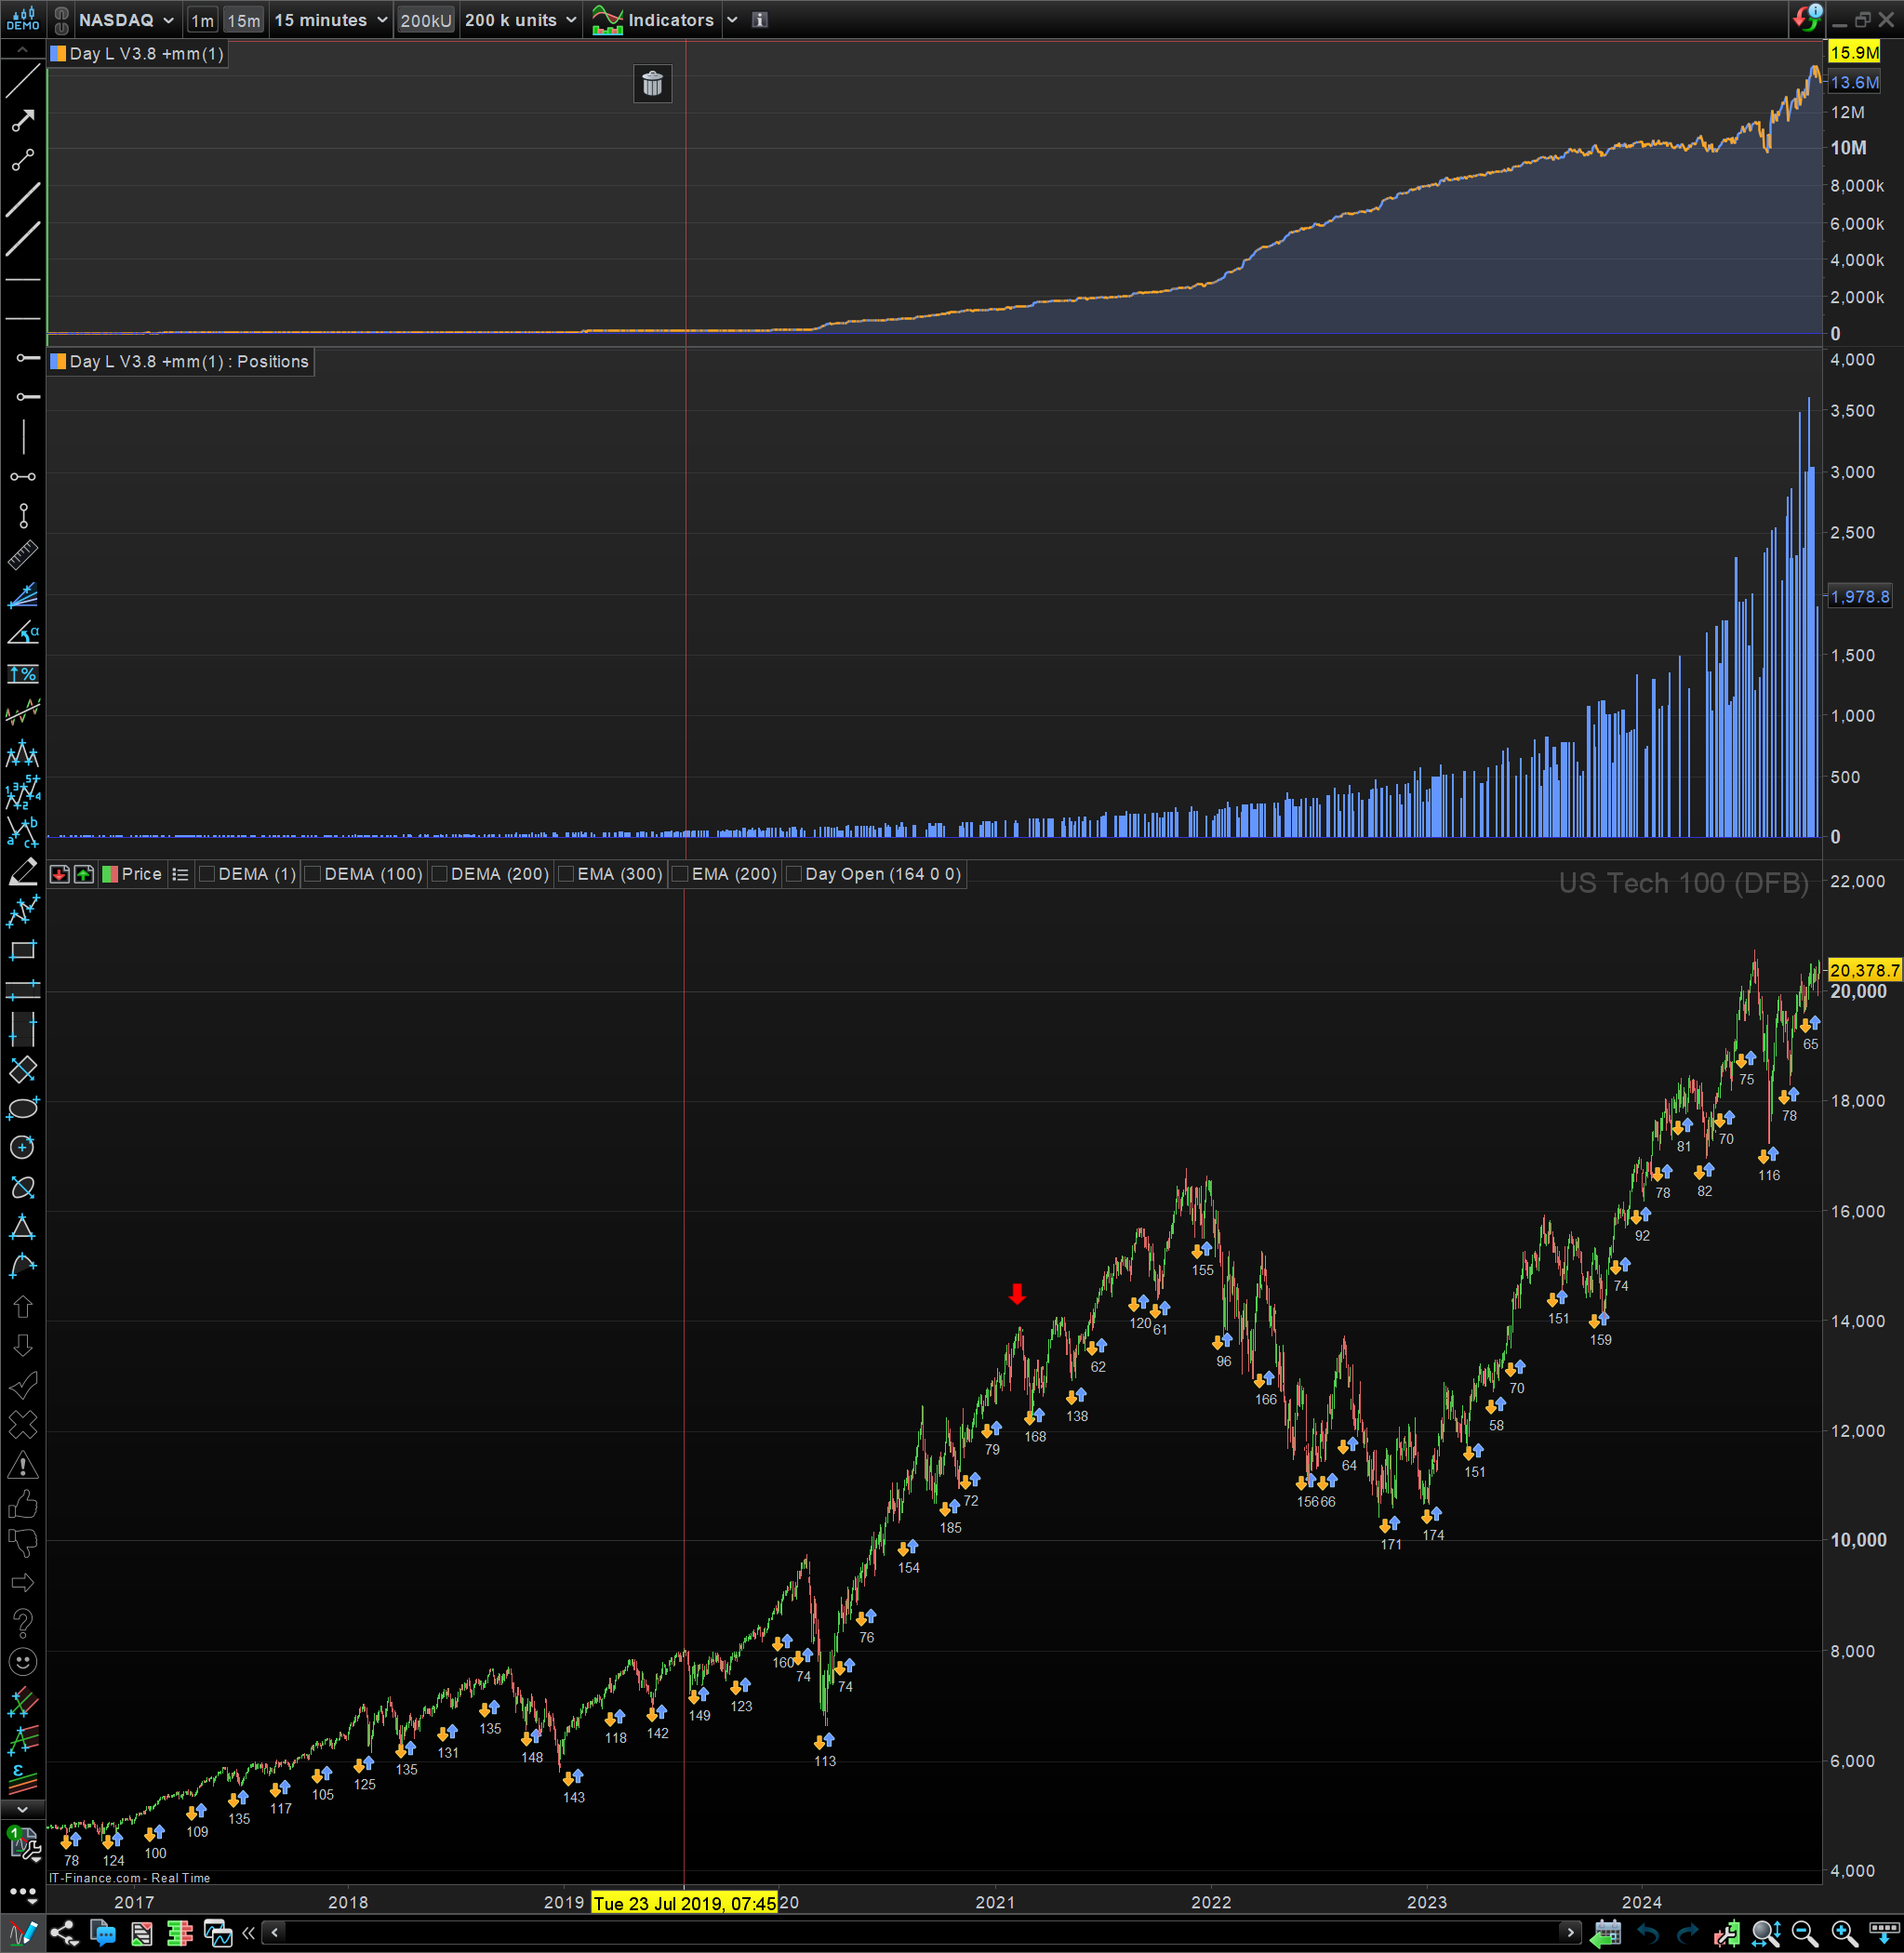
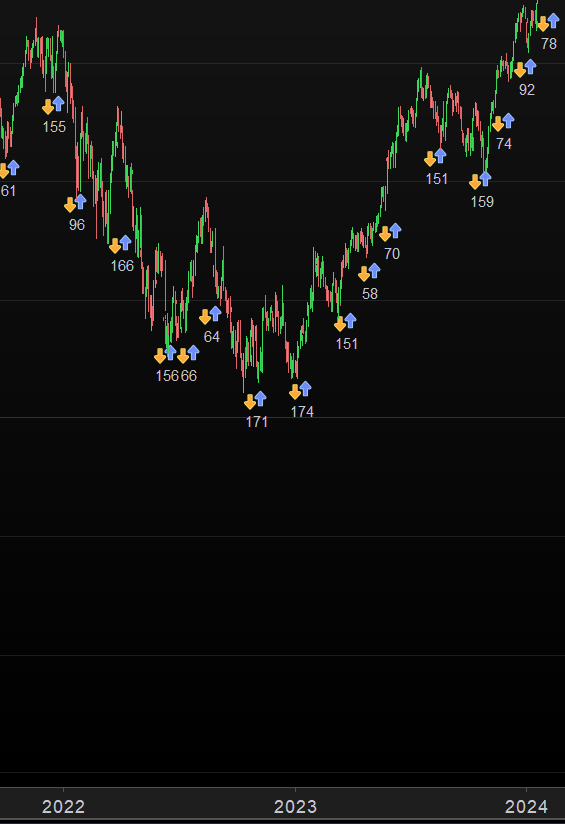
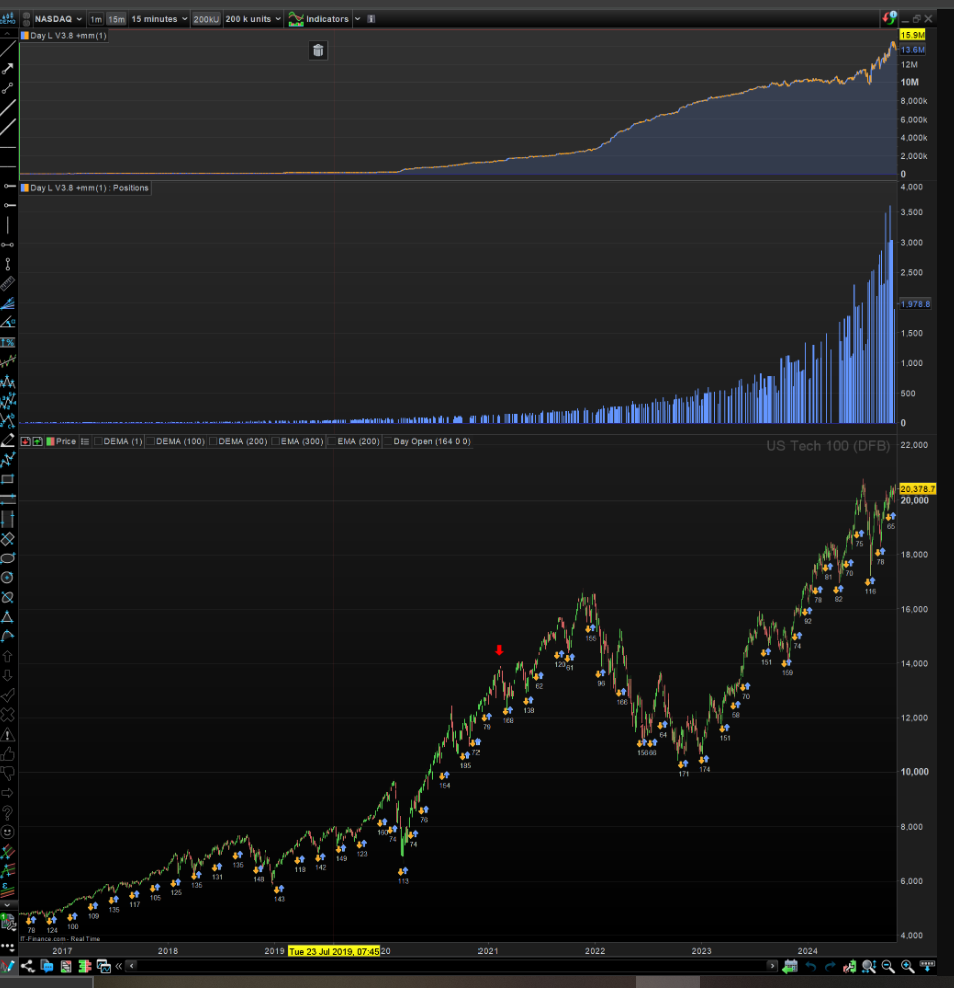
not a problem, see attached the price curve below positions below equity curve.
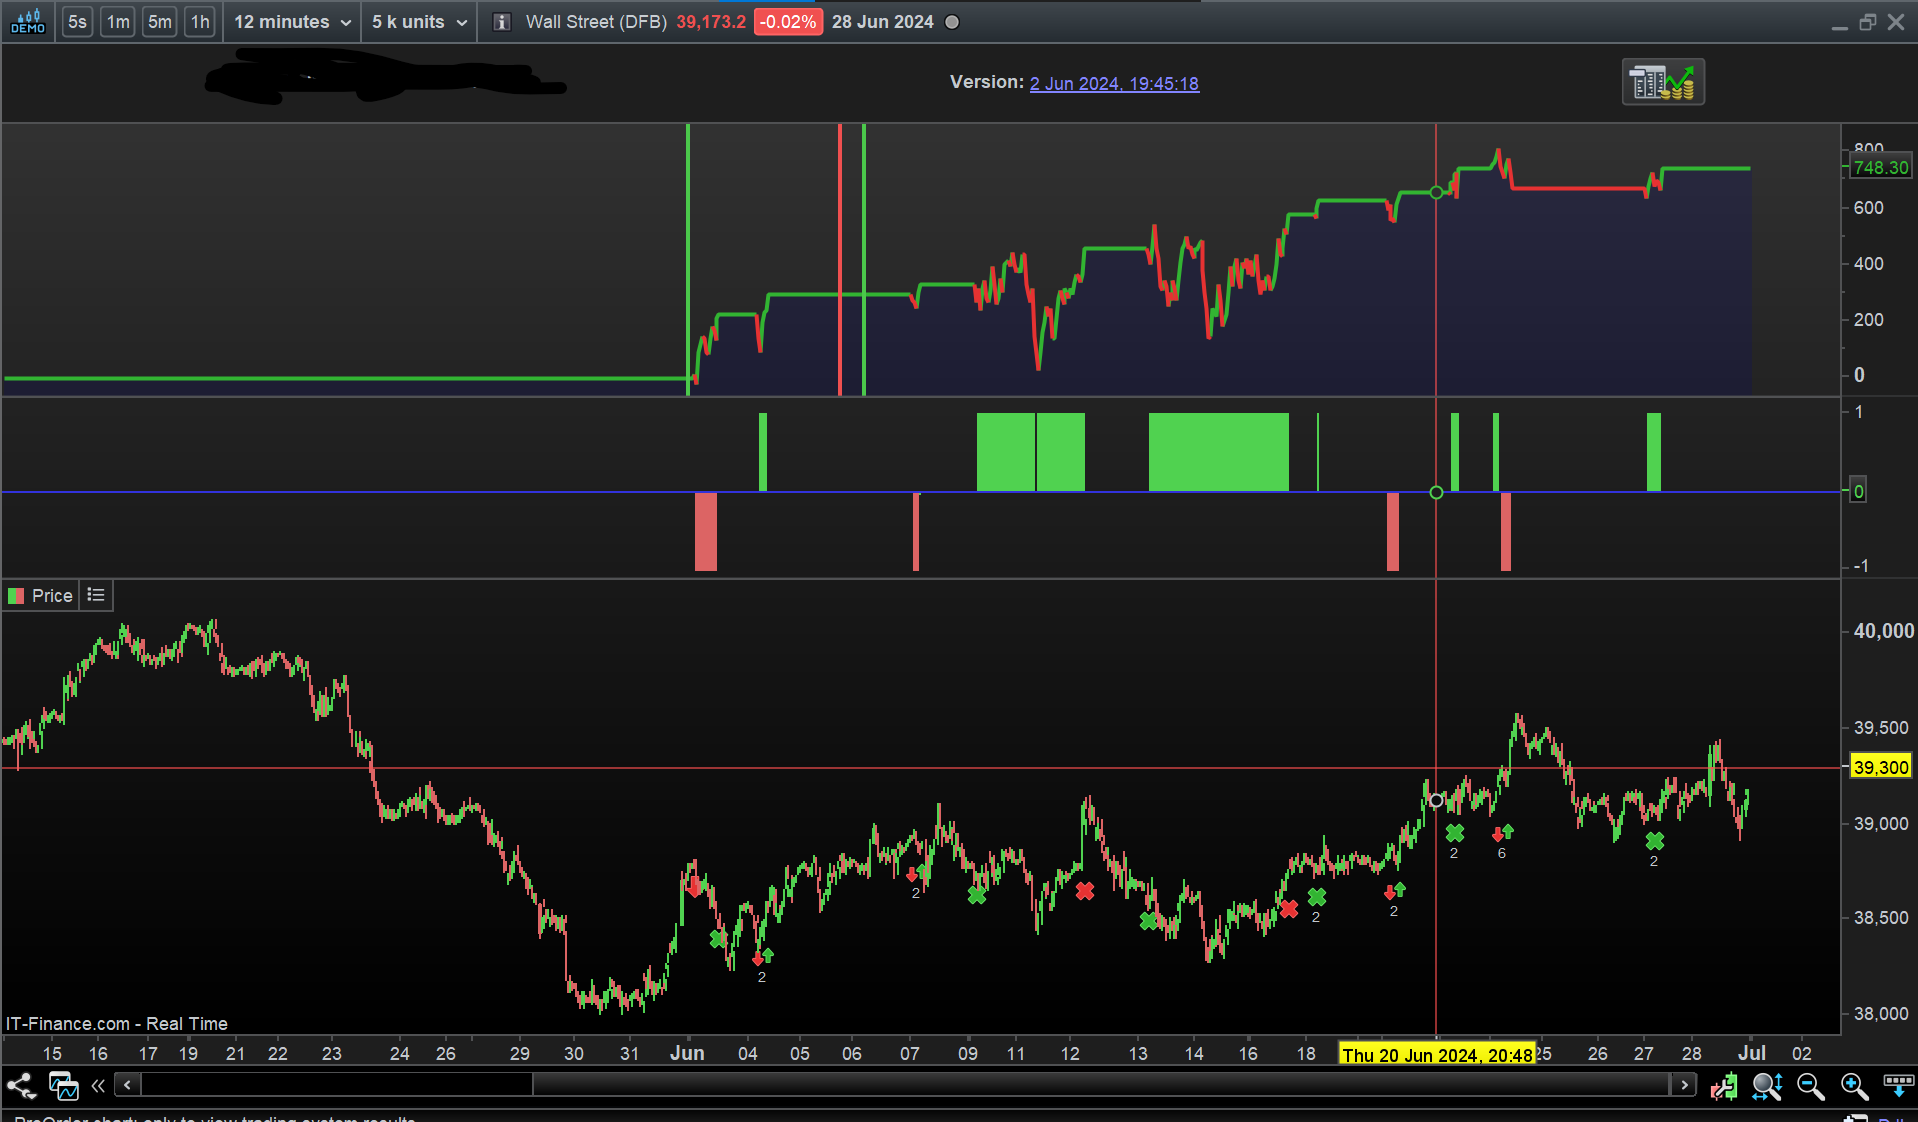
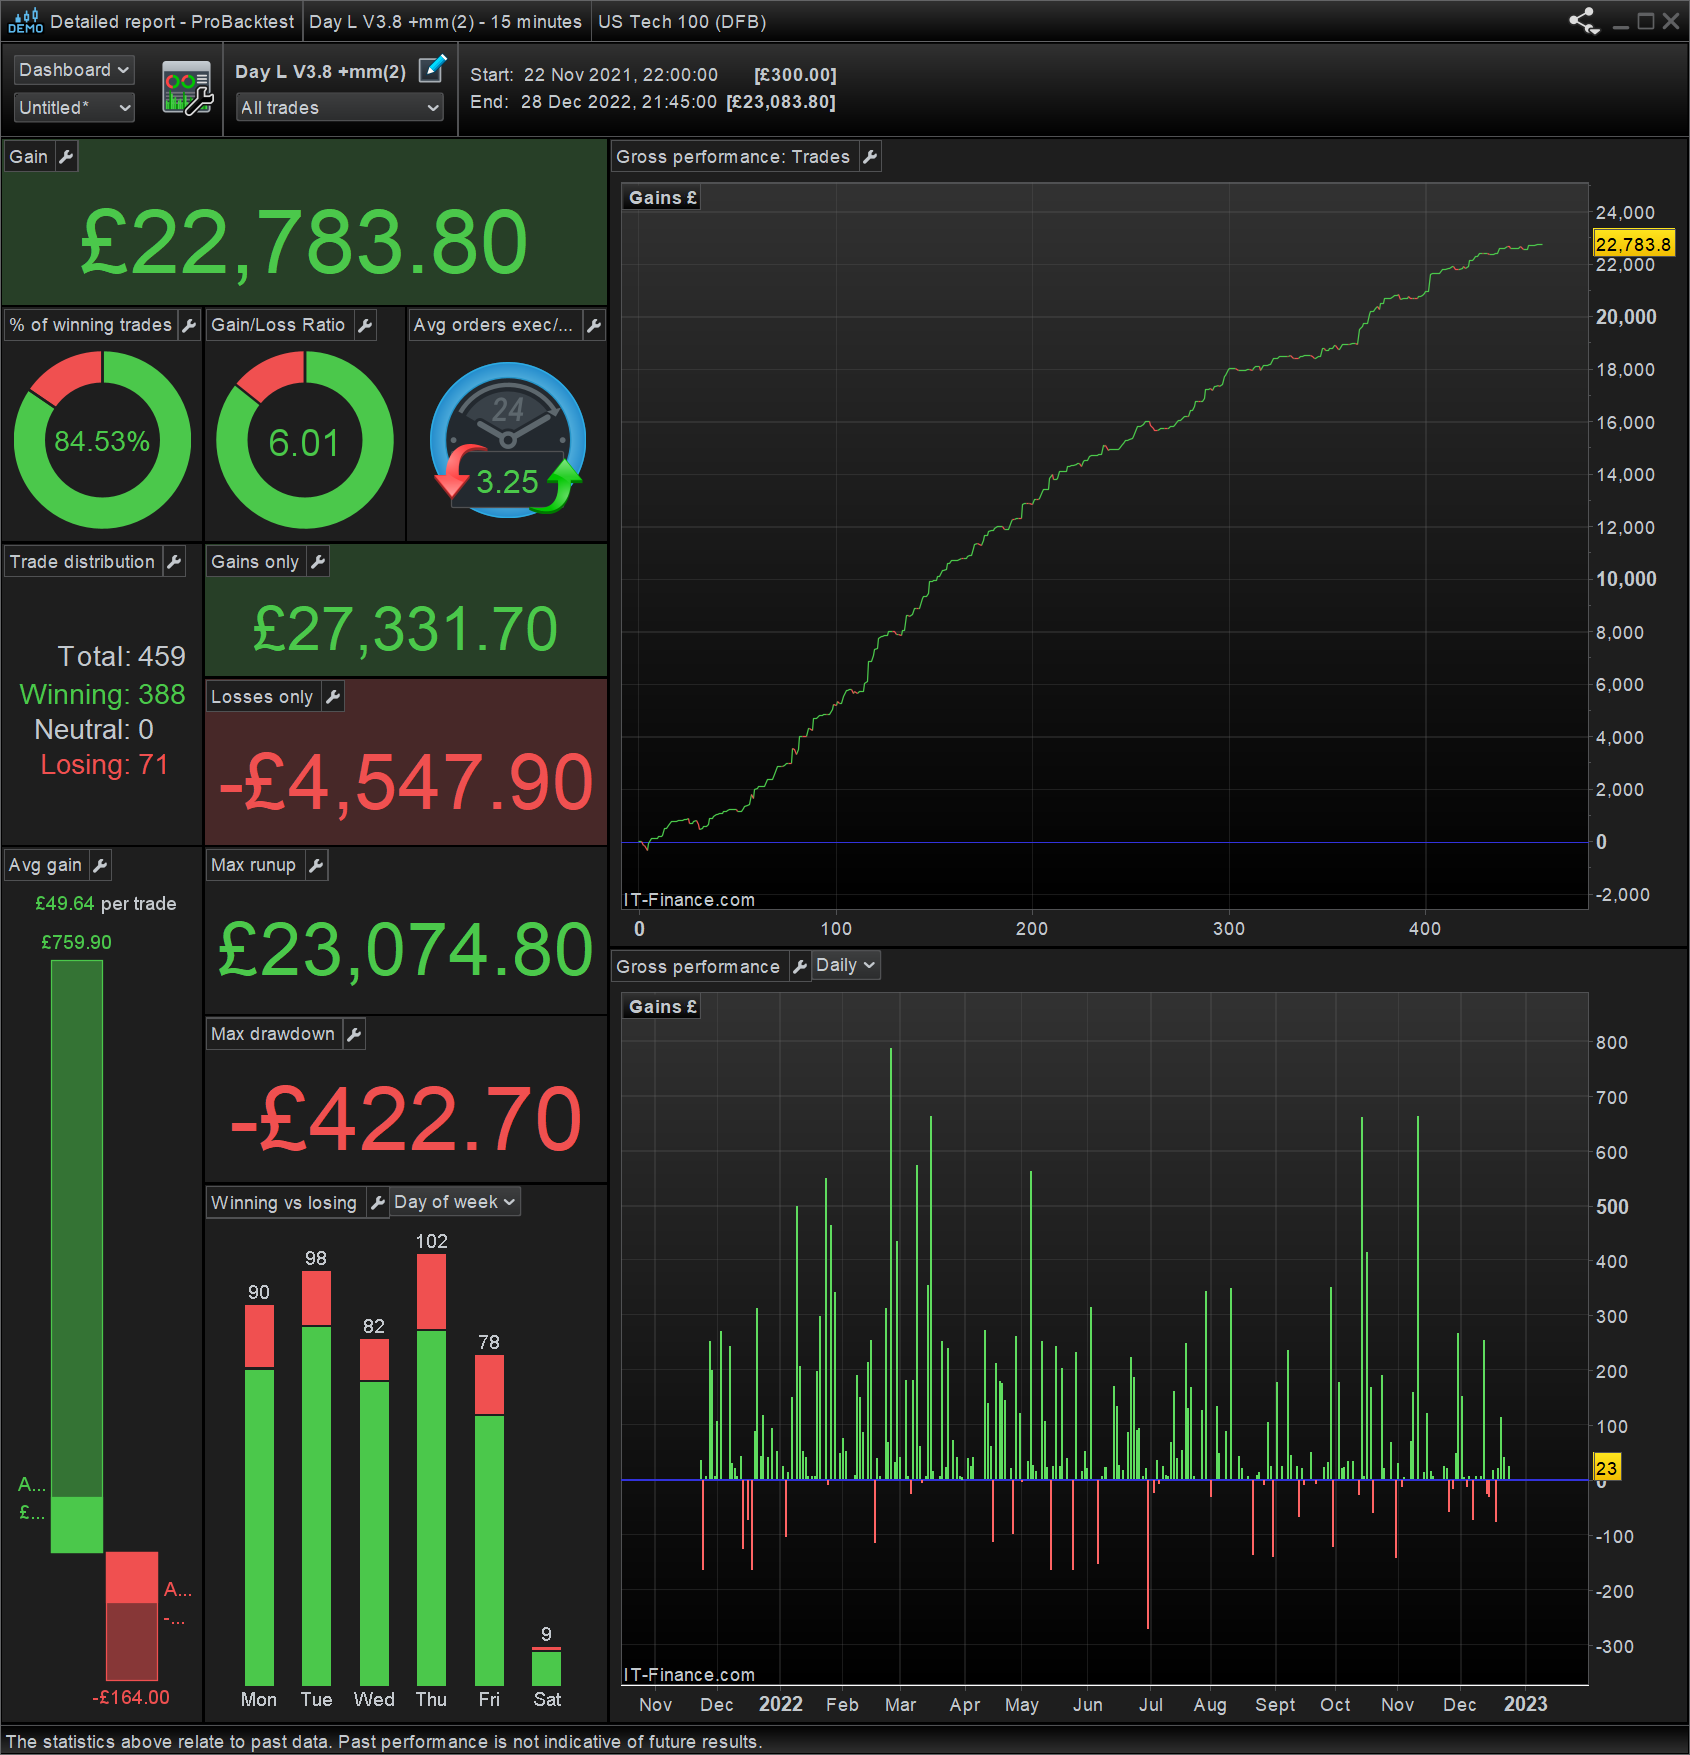
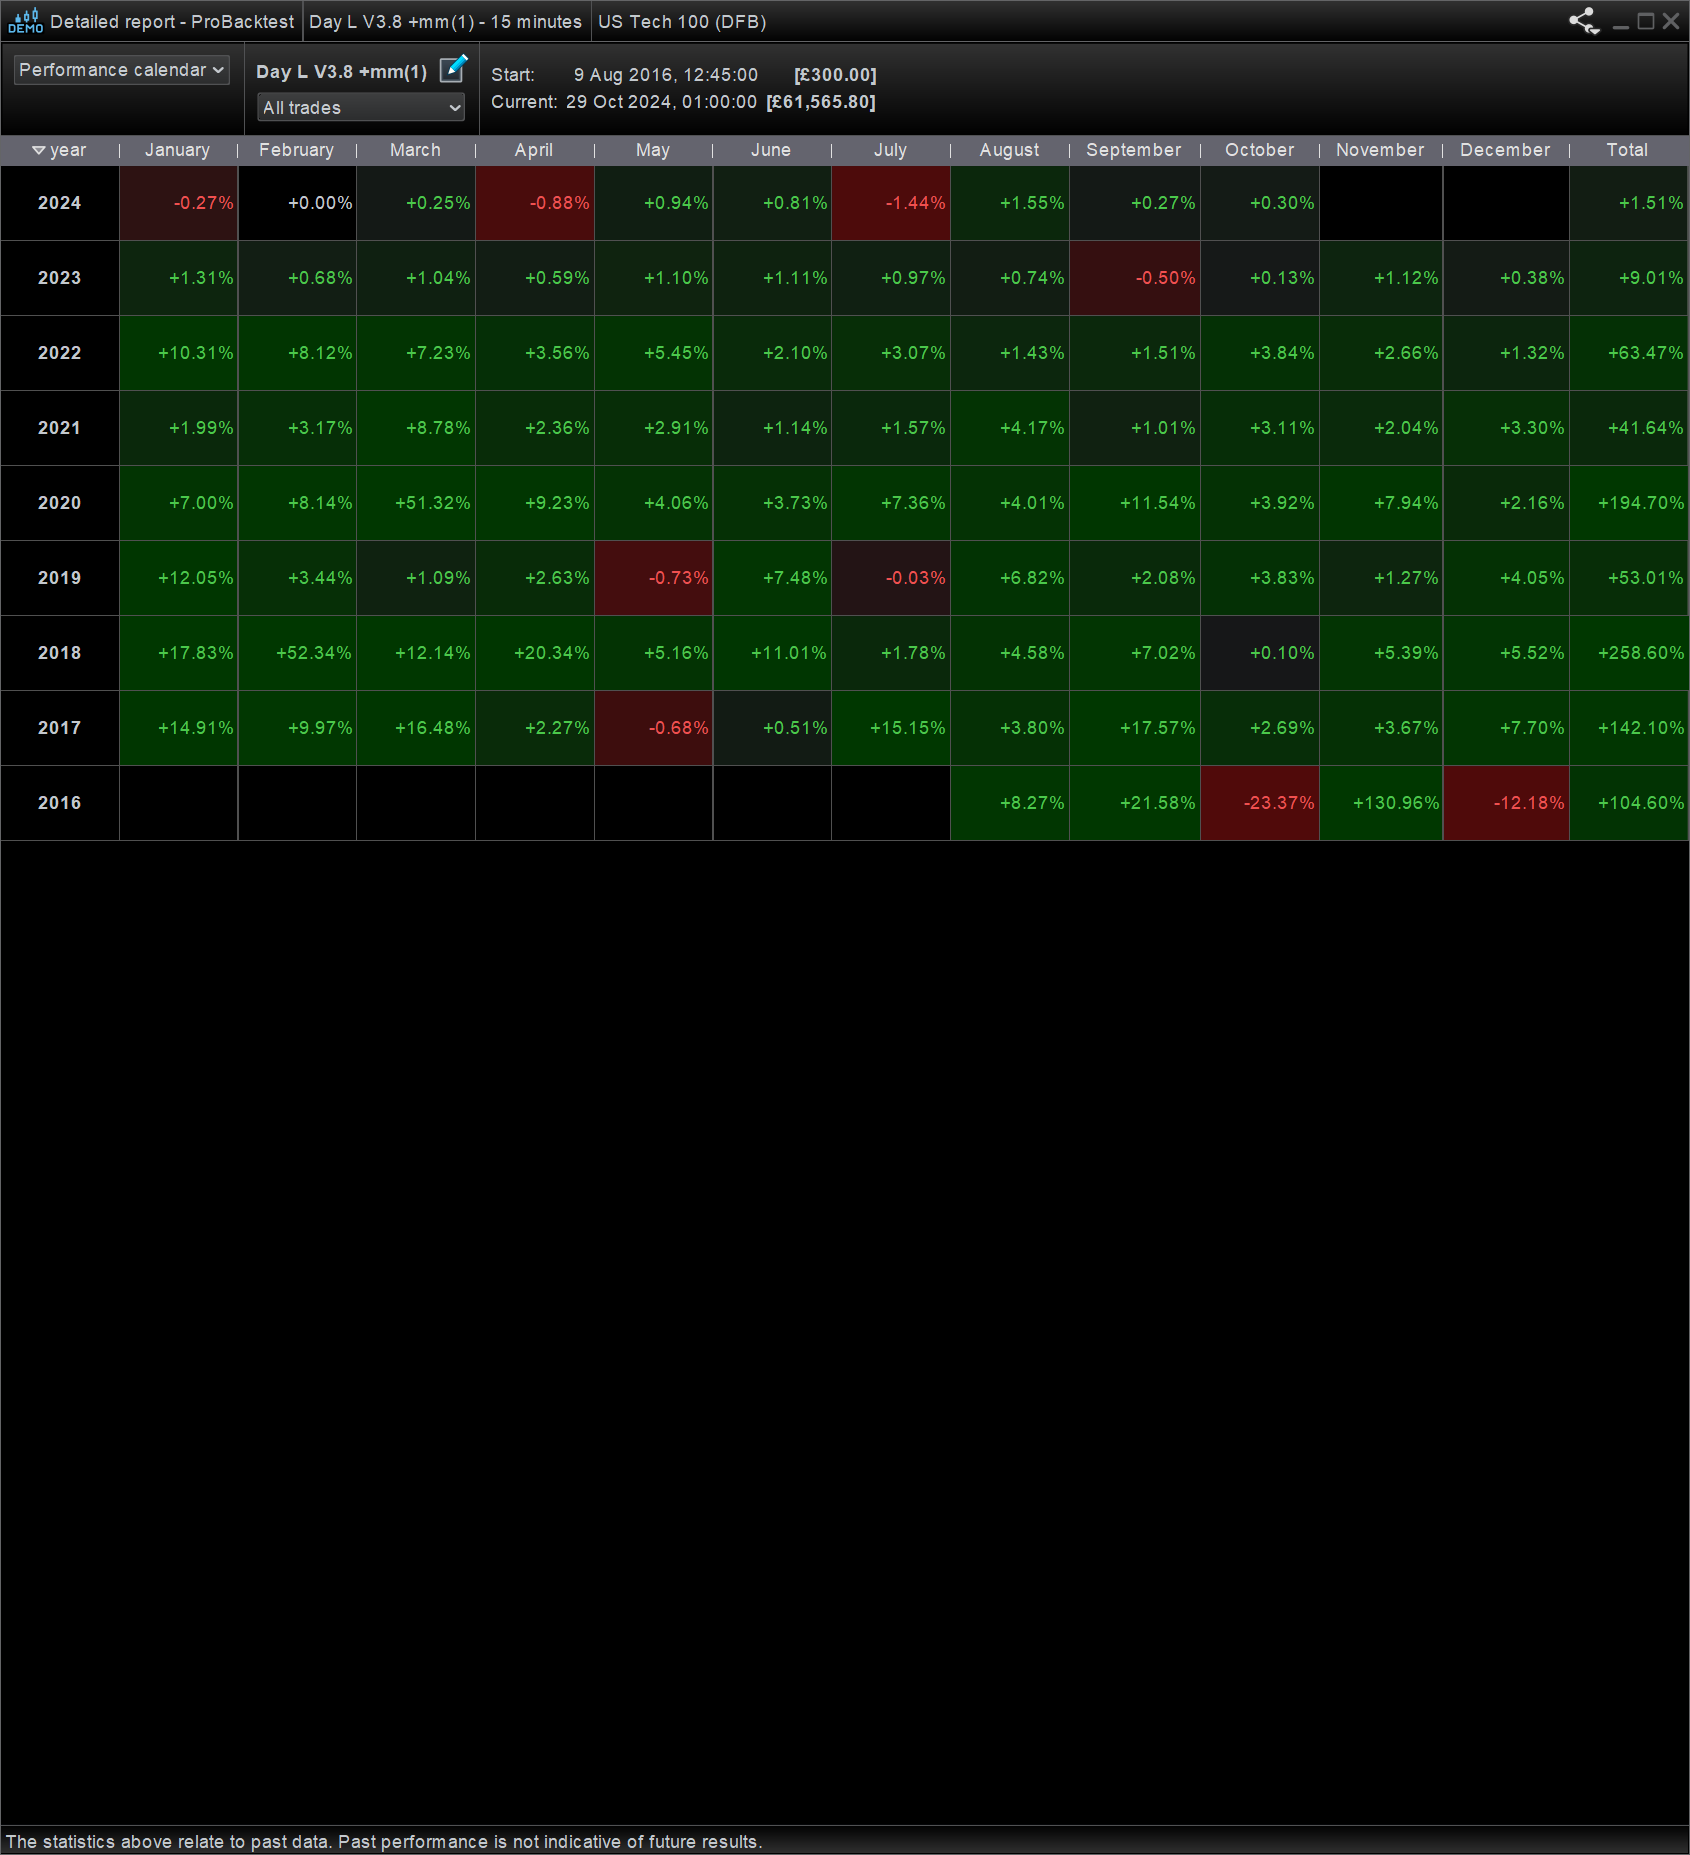
also for anyone who interest, see attached, it is the same code spread 2 and same everything on the date between 22 nov 2021 and 28 dec 2022, when the NASDAQ market all going down hill.
Thanks
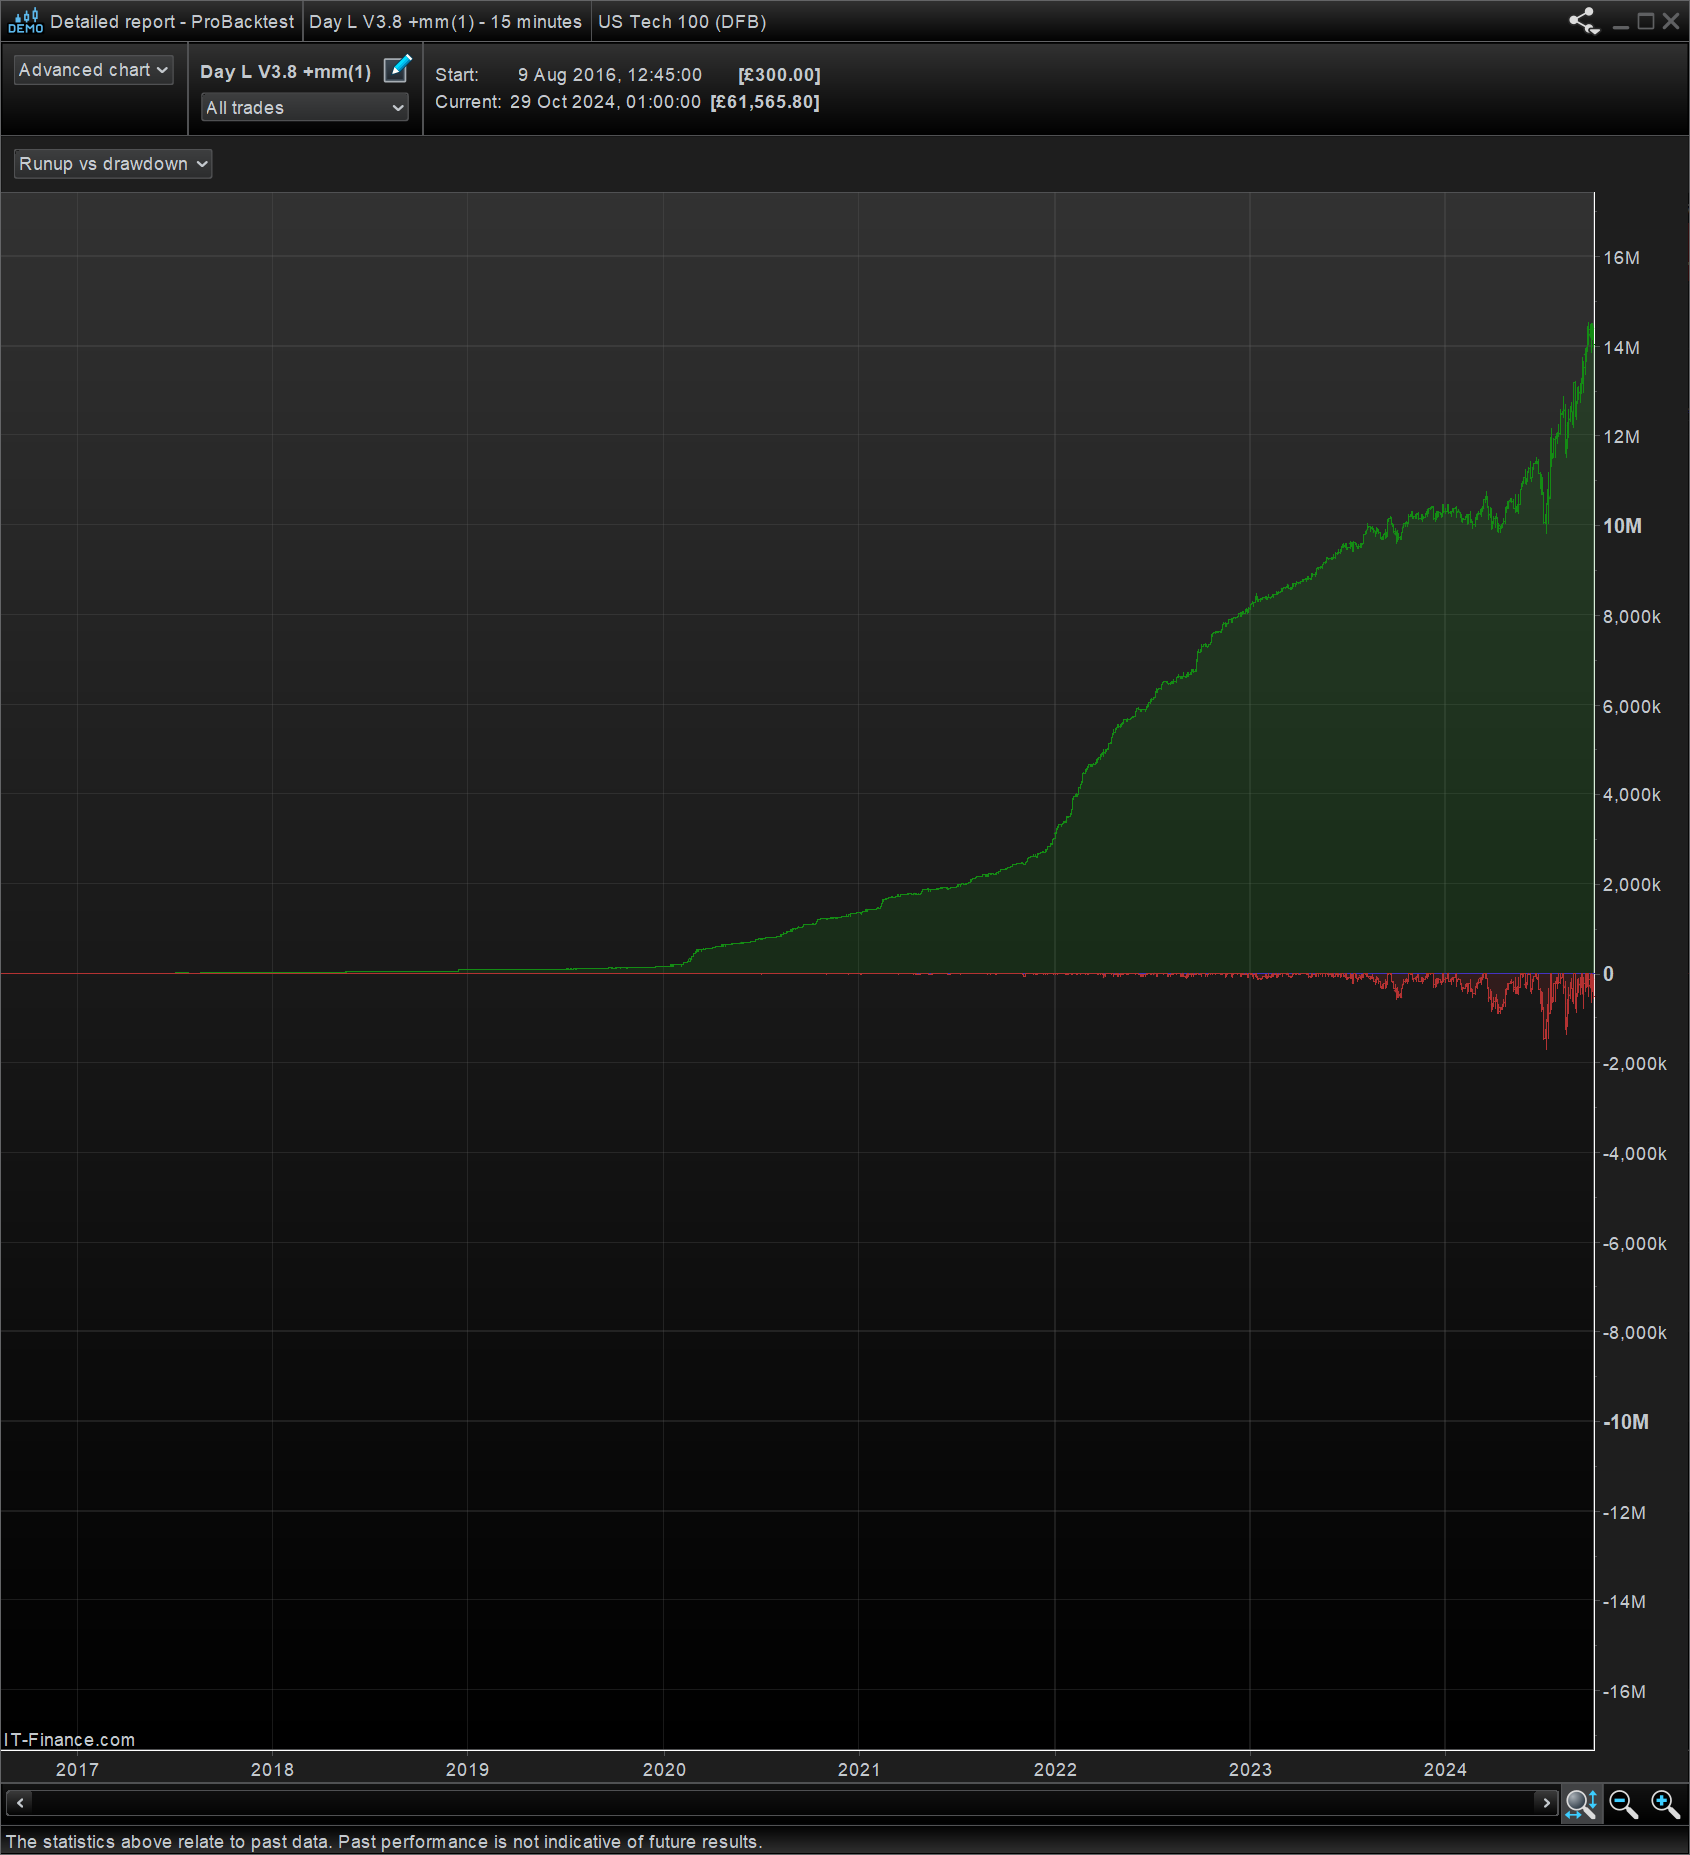
price curve below positions below equity curve, for the spread 2 and all code and everything the same but with money management.
(All the above are 200k units)
this is only for NASDAQ, the position size is 1 and the spread is 2, it is 15min, buy long only. it is not tested with OOS (out of sample) or walk forward, as it sell each day at the end of the trade day (214500) no matter it is winning or lose, and it started again the next trade day, this way (I believe) It would have enough (OOS) and not over optimization as it close each day therefore it use each day trade as different data for almost 8 years, that is why it has this many trade though the 8 years timeframe.
Hi guy, sorry I upload the wrong things for that post, please see the correct ref attached
I’m impressed!
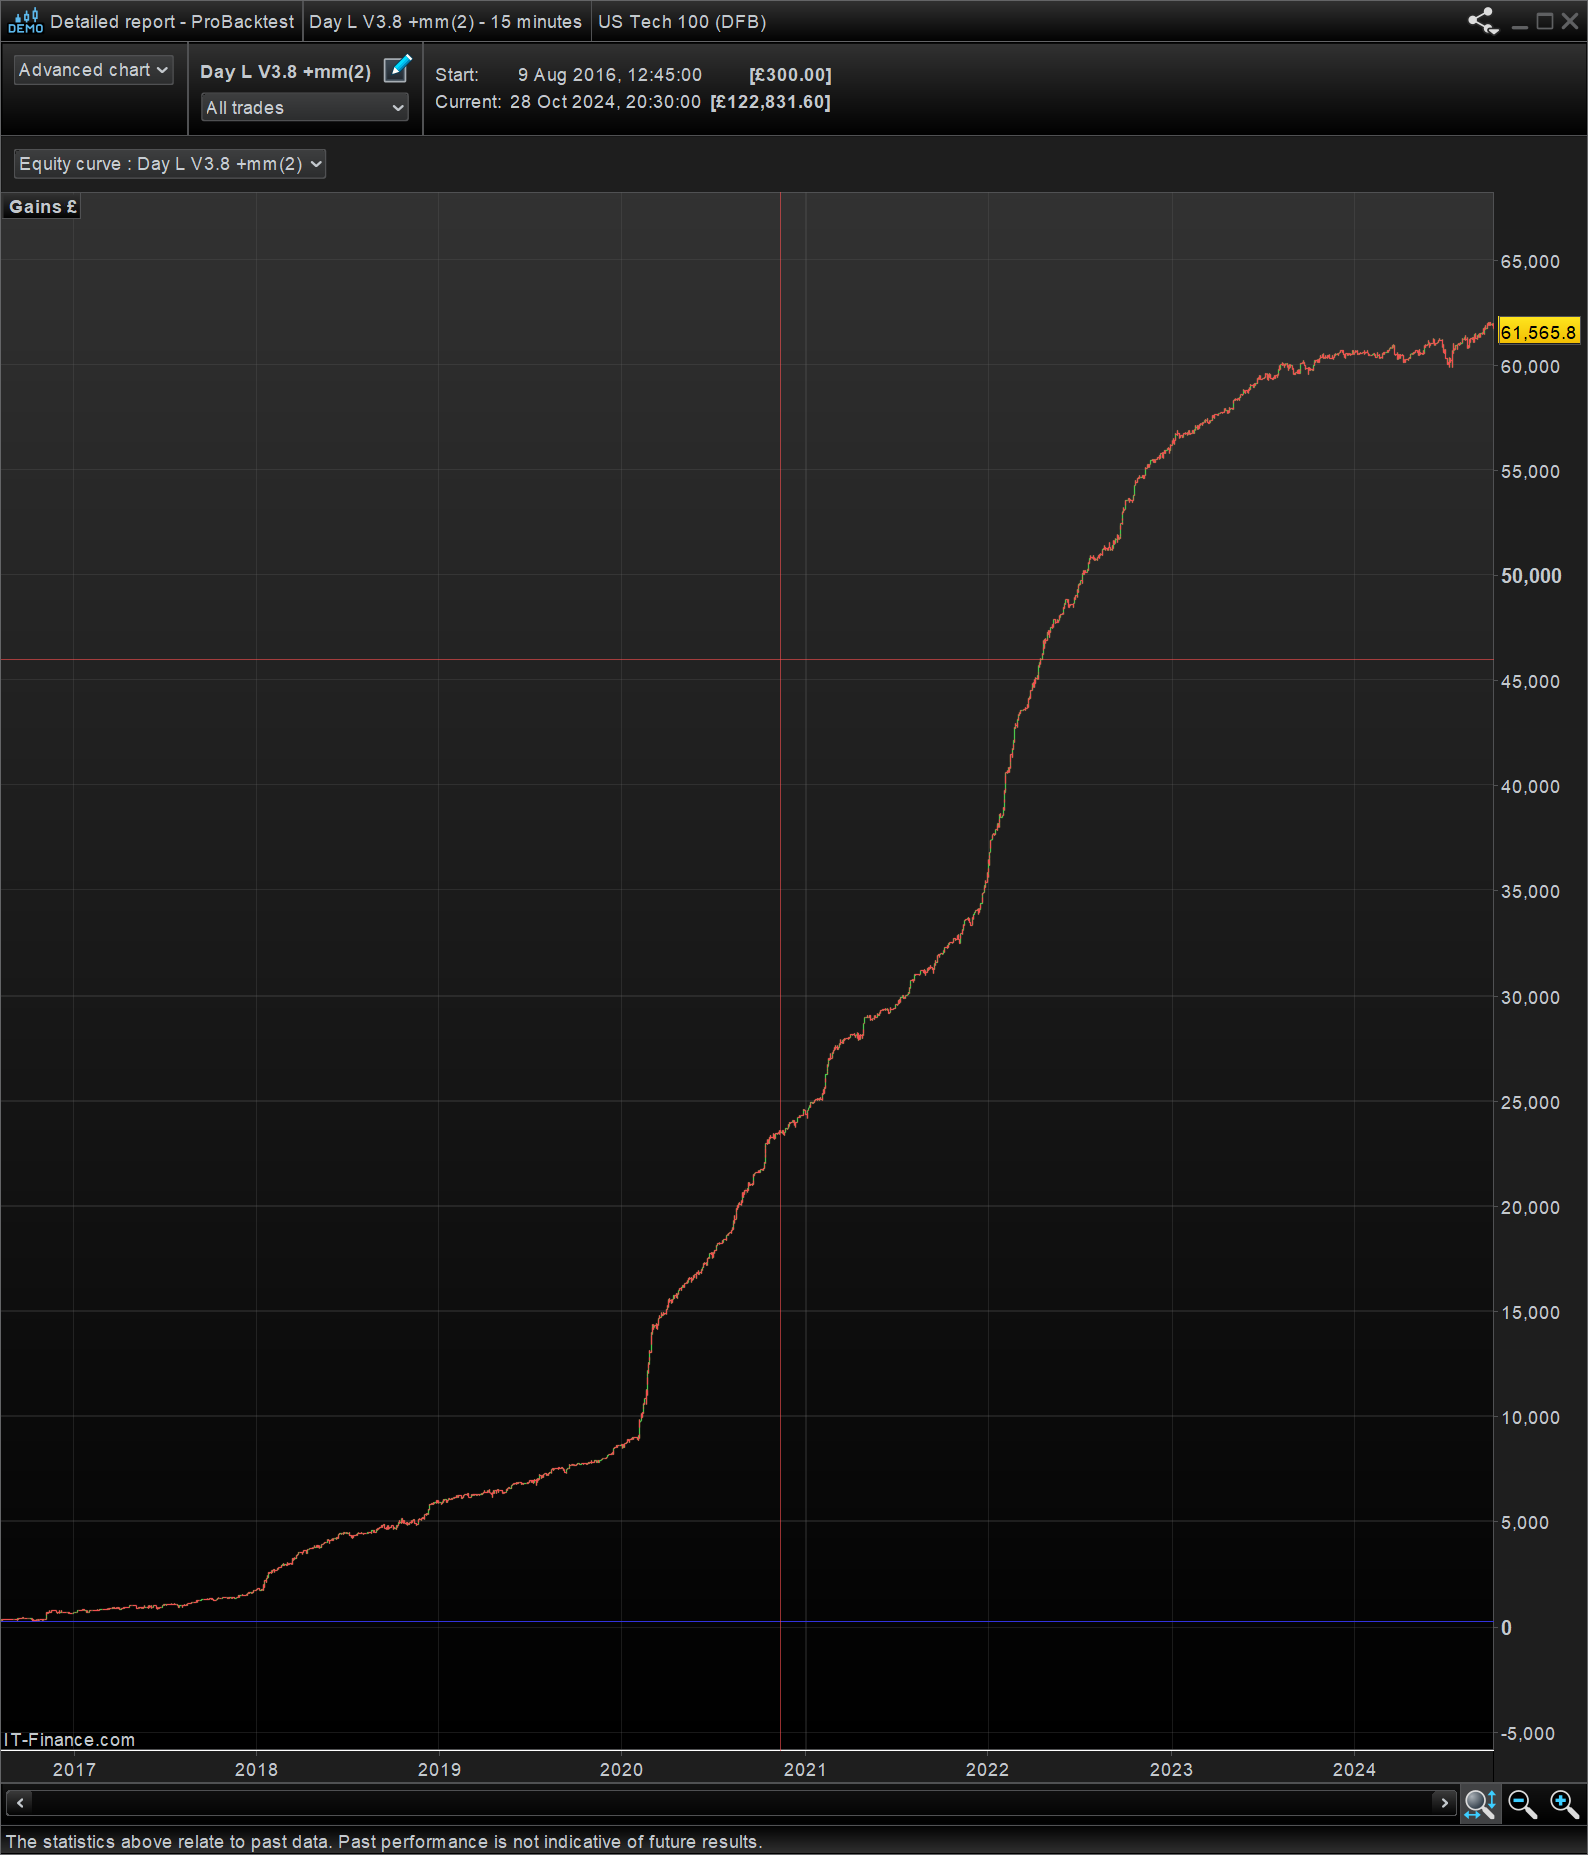
Even shows a healthy equity curve / profit trading long only during the extended correction in 2022.
Well Done WingYip GoldStar!
So next step / test is … how does it perform with OOS?
Have you traded it yet with Live data? May as well bang it straight to Live with minimum positions size – 0.2 per Contract?
Hey …
I am not convinced yet (or ever 🙂 )
Are you prepared to be in drawdown for 15 or so months ?
And that for more than USD 7500 of which you don’t know whether it will end towards the end of 2022 ? …with an additional psychological stump right when 2023 has begun ? (thinking you might recover you go in DD again – you might collapse at that stage)
Notice that the only upside you might have is that you have gained in advance what you will lose in 2022 and that by then your pockets are deep and you hold on (eyes closed).
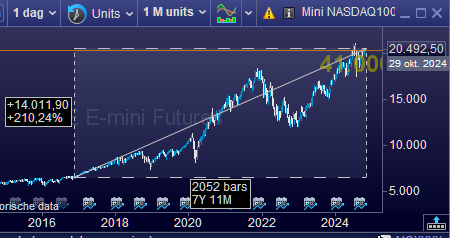
I checked (or tried to check) the Buy and Hold, and this is 210% gain. If your Statistics tell over 90% annually, that should be better (6-7 times that).
Are you prepared to be in drawdown for 15 or so months ? And that for more than USD 7500 of which you don’t know whether it will end towards the end of 2022 ?
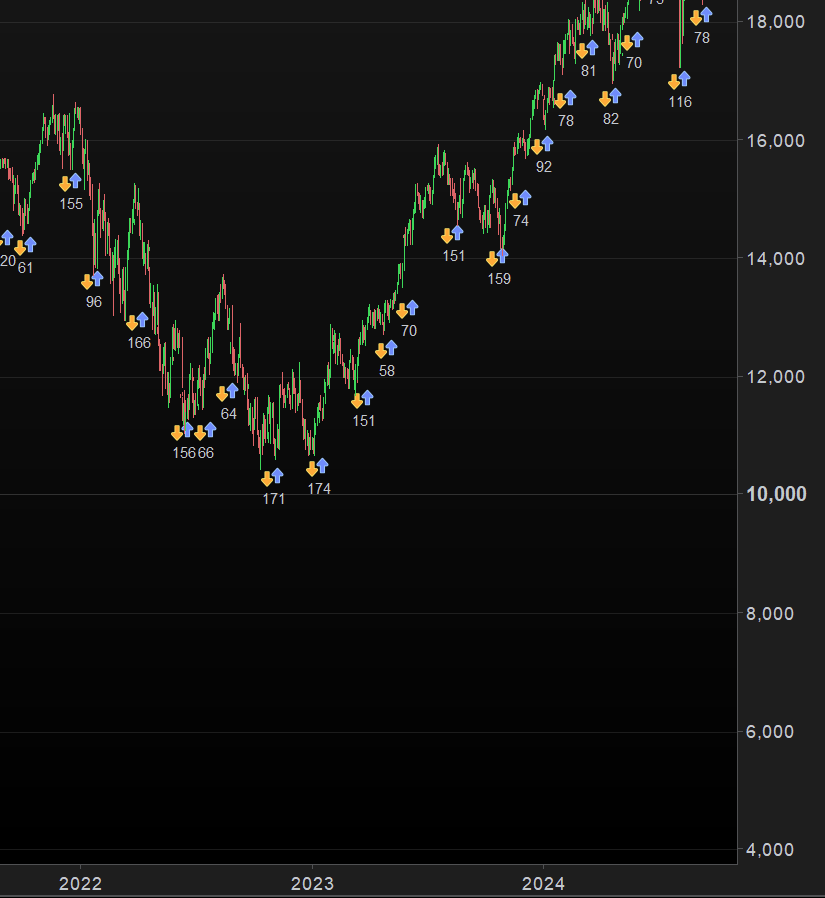
You must be looking at a different chart than attached, else you have spotted something I missed??
Attached shows the equity curve (top chart) rising all through 2022?
I am on some new coffee today, but maybe you need some also?? 😉
EDIT / PS
You may mean 2023??
Also I did just notice something I missed … position size is in the 100’s and 1000’s … I would never sleep and my coffee bill would exceed profits!!?? 😀
The first picture (but also the second) in my previous post ?
Did I do something wrong there ?
Edit : Yeesssssssssssssssssssssssssss – I did something wrong there ! I looked at the price instead of the profit in another chart. Fool that I am.
PS: The position sizes I could not get hold of. So what are they ?
Edit : Position size is 1 (WingYip told so). But contract size is unclear.