How can i know if my Bot (SWAT) is enough good for being sold on prorealcode Market place ?
How can i test it on a more longer period than 15000 candles / 2 months and a half ?
Which score to look at ? Z-score ? Sharp ratio ? Risk/Reward ratio ?
Show a backtest over 200000 bars and post it here.
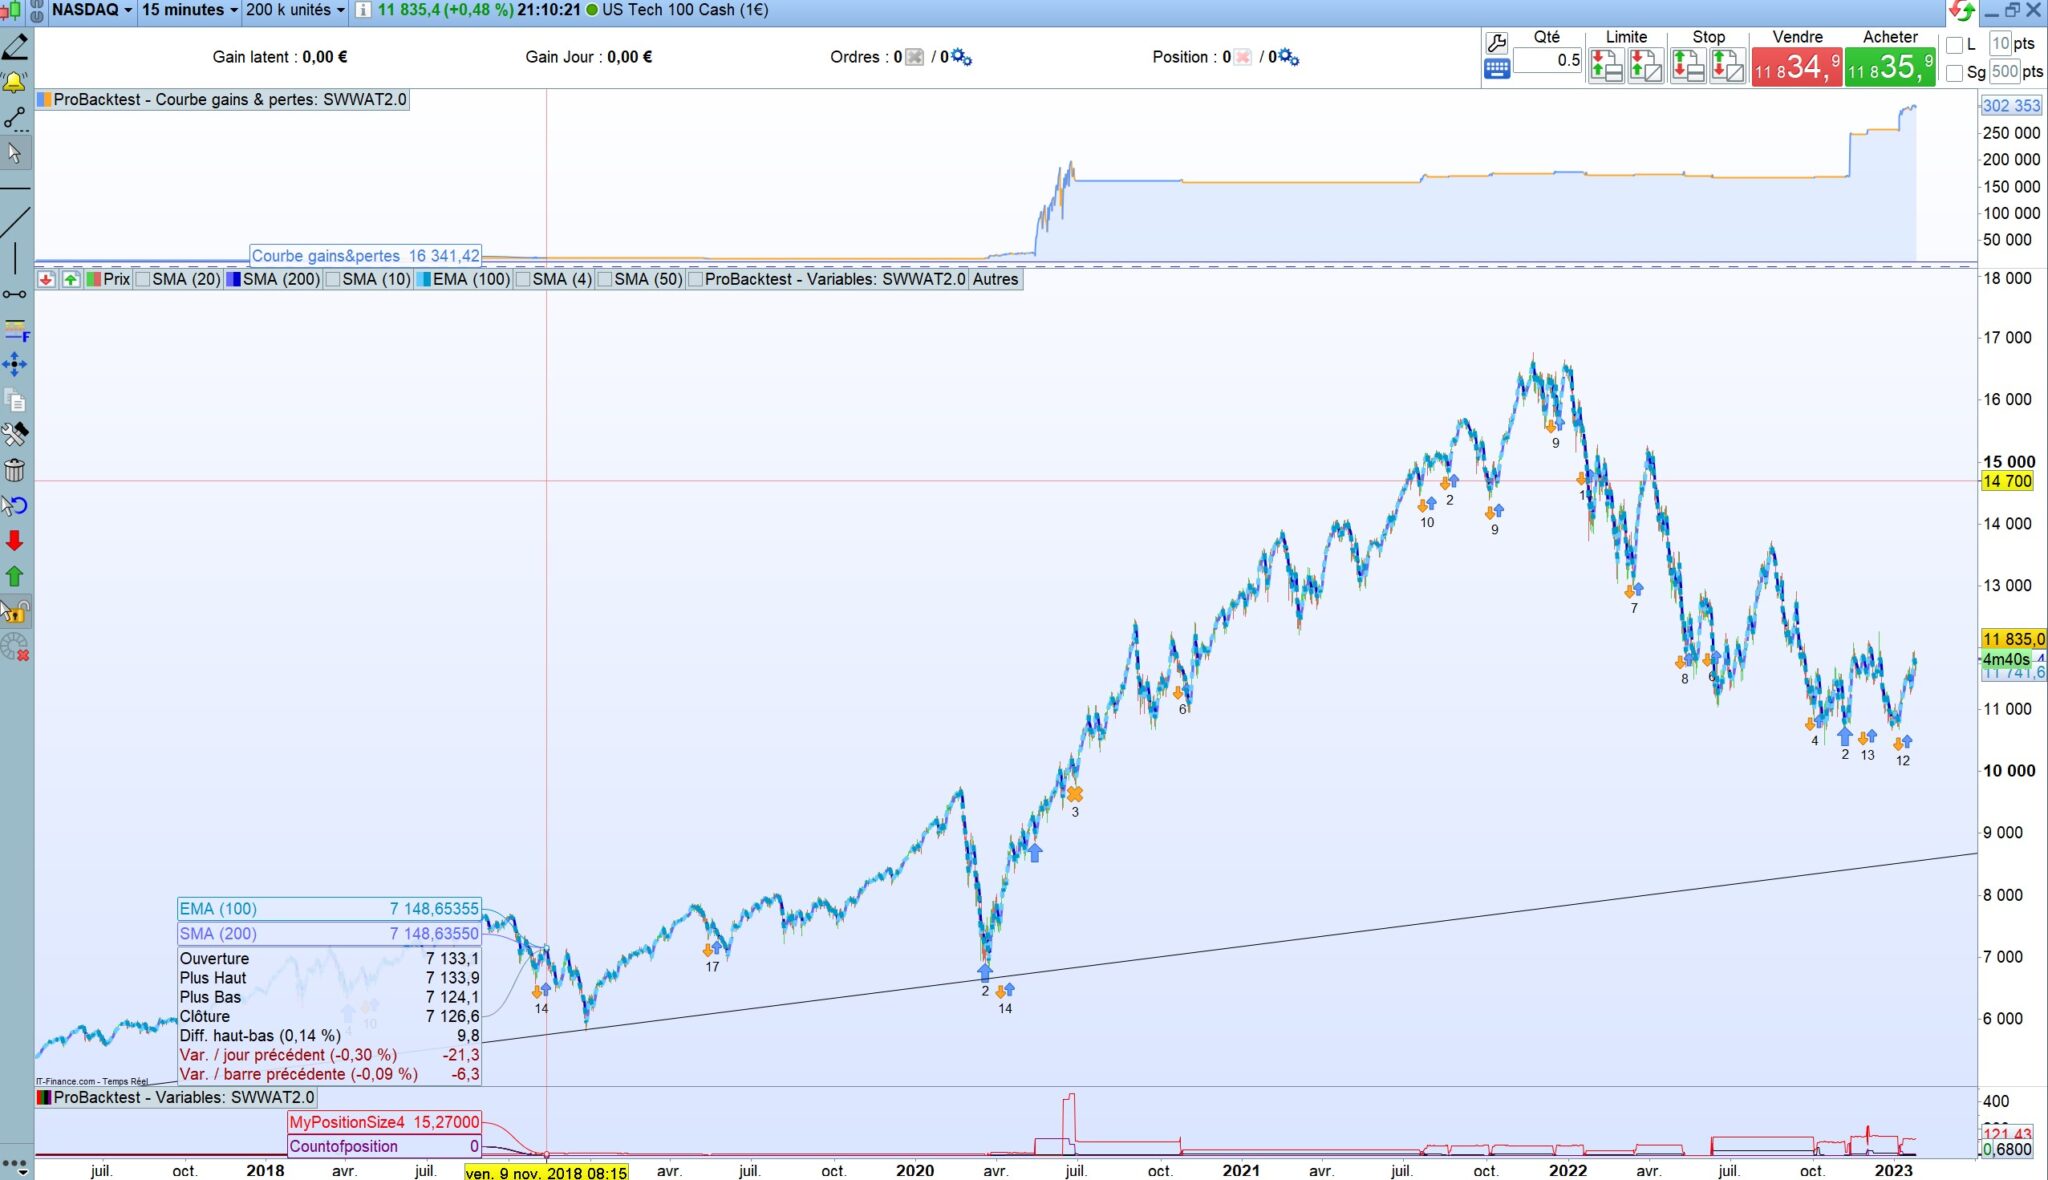
Show the equity curve with positions under the equity curve and price curve under the positions.
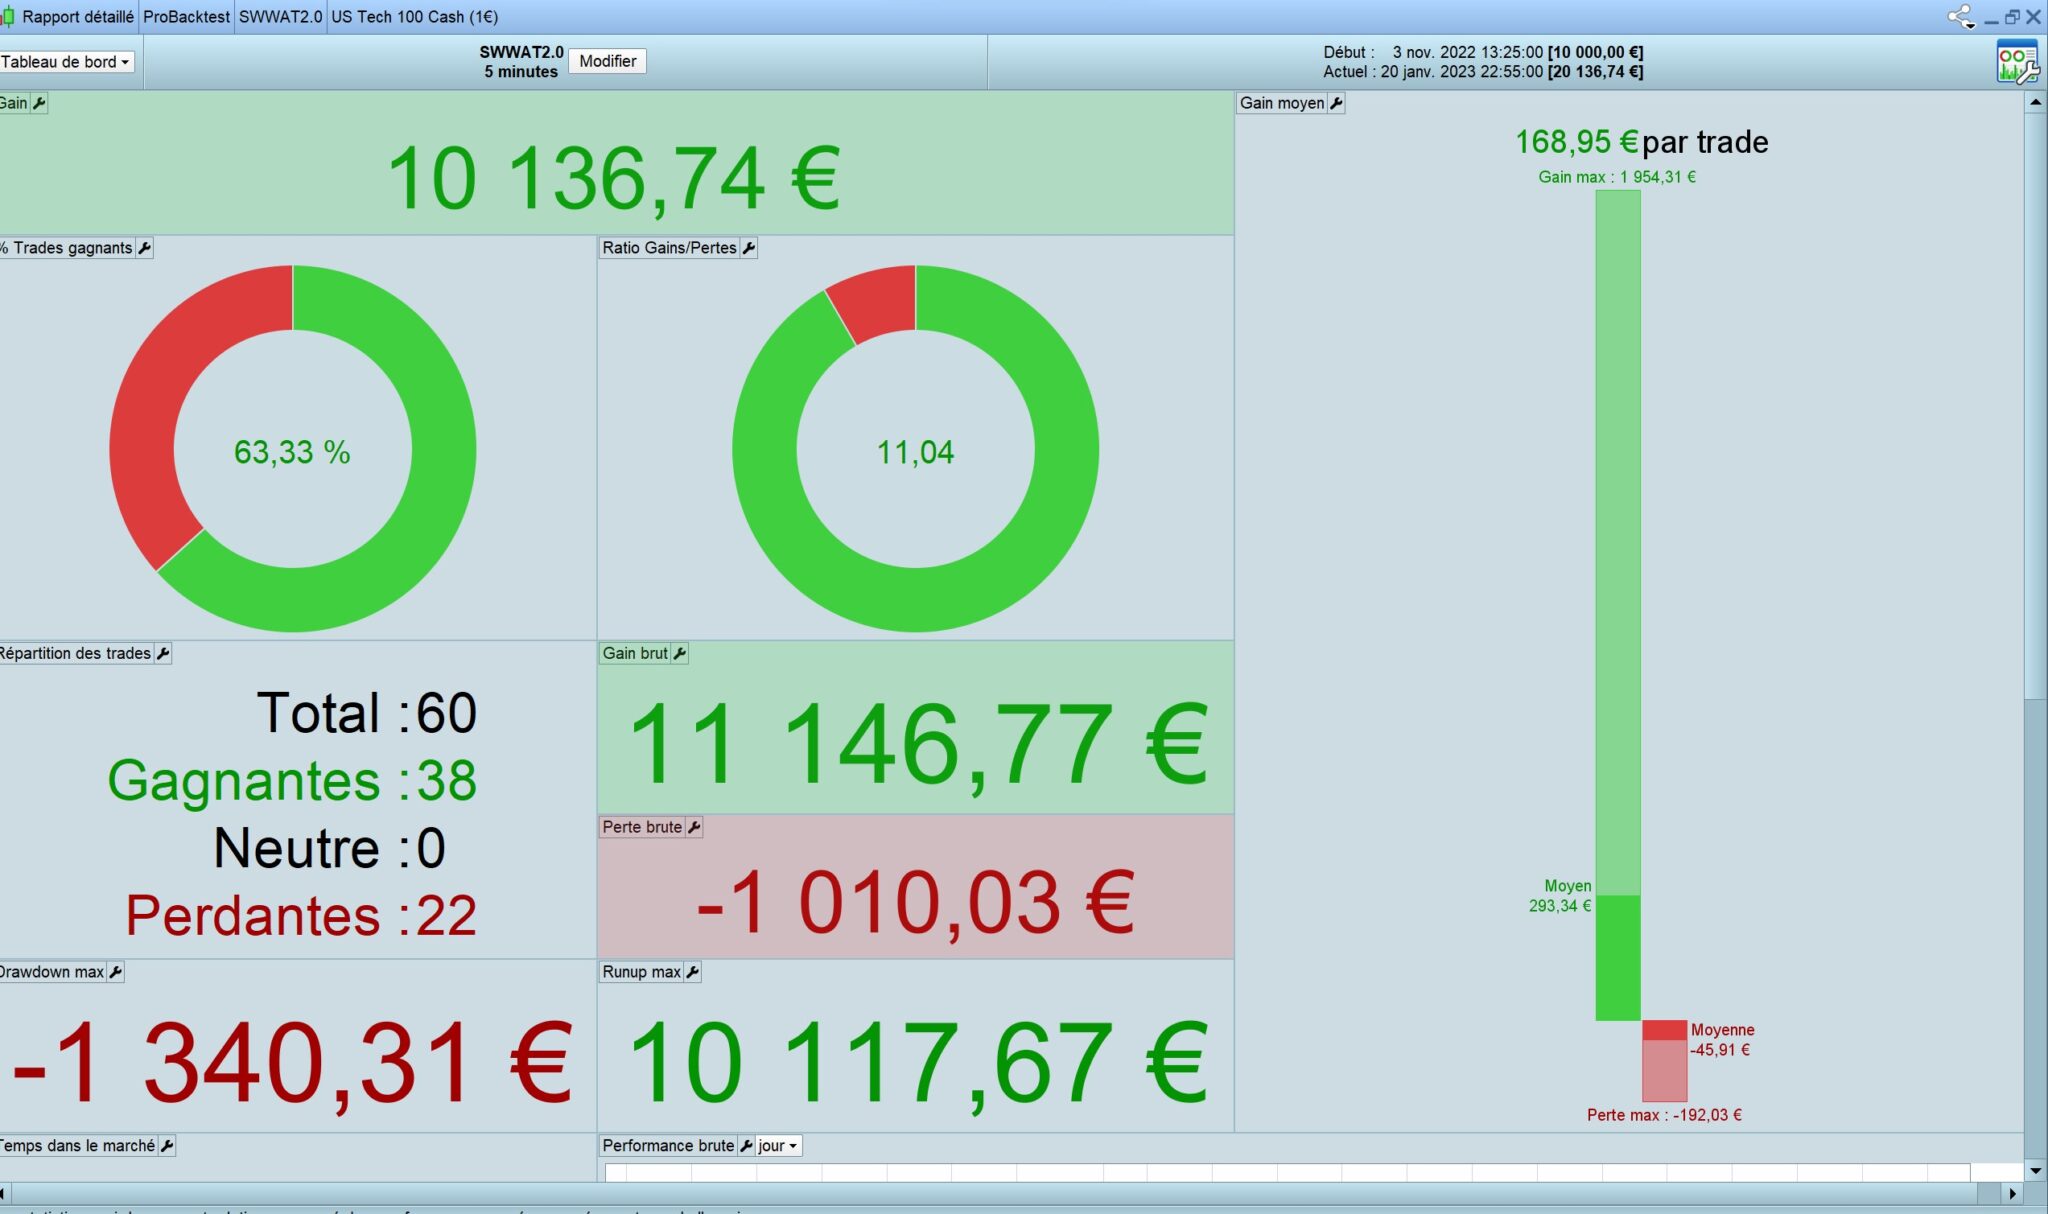
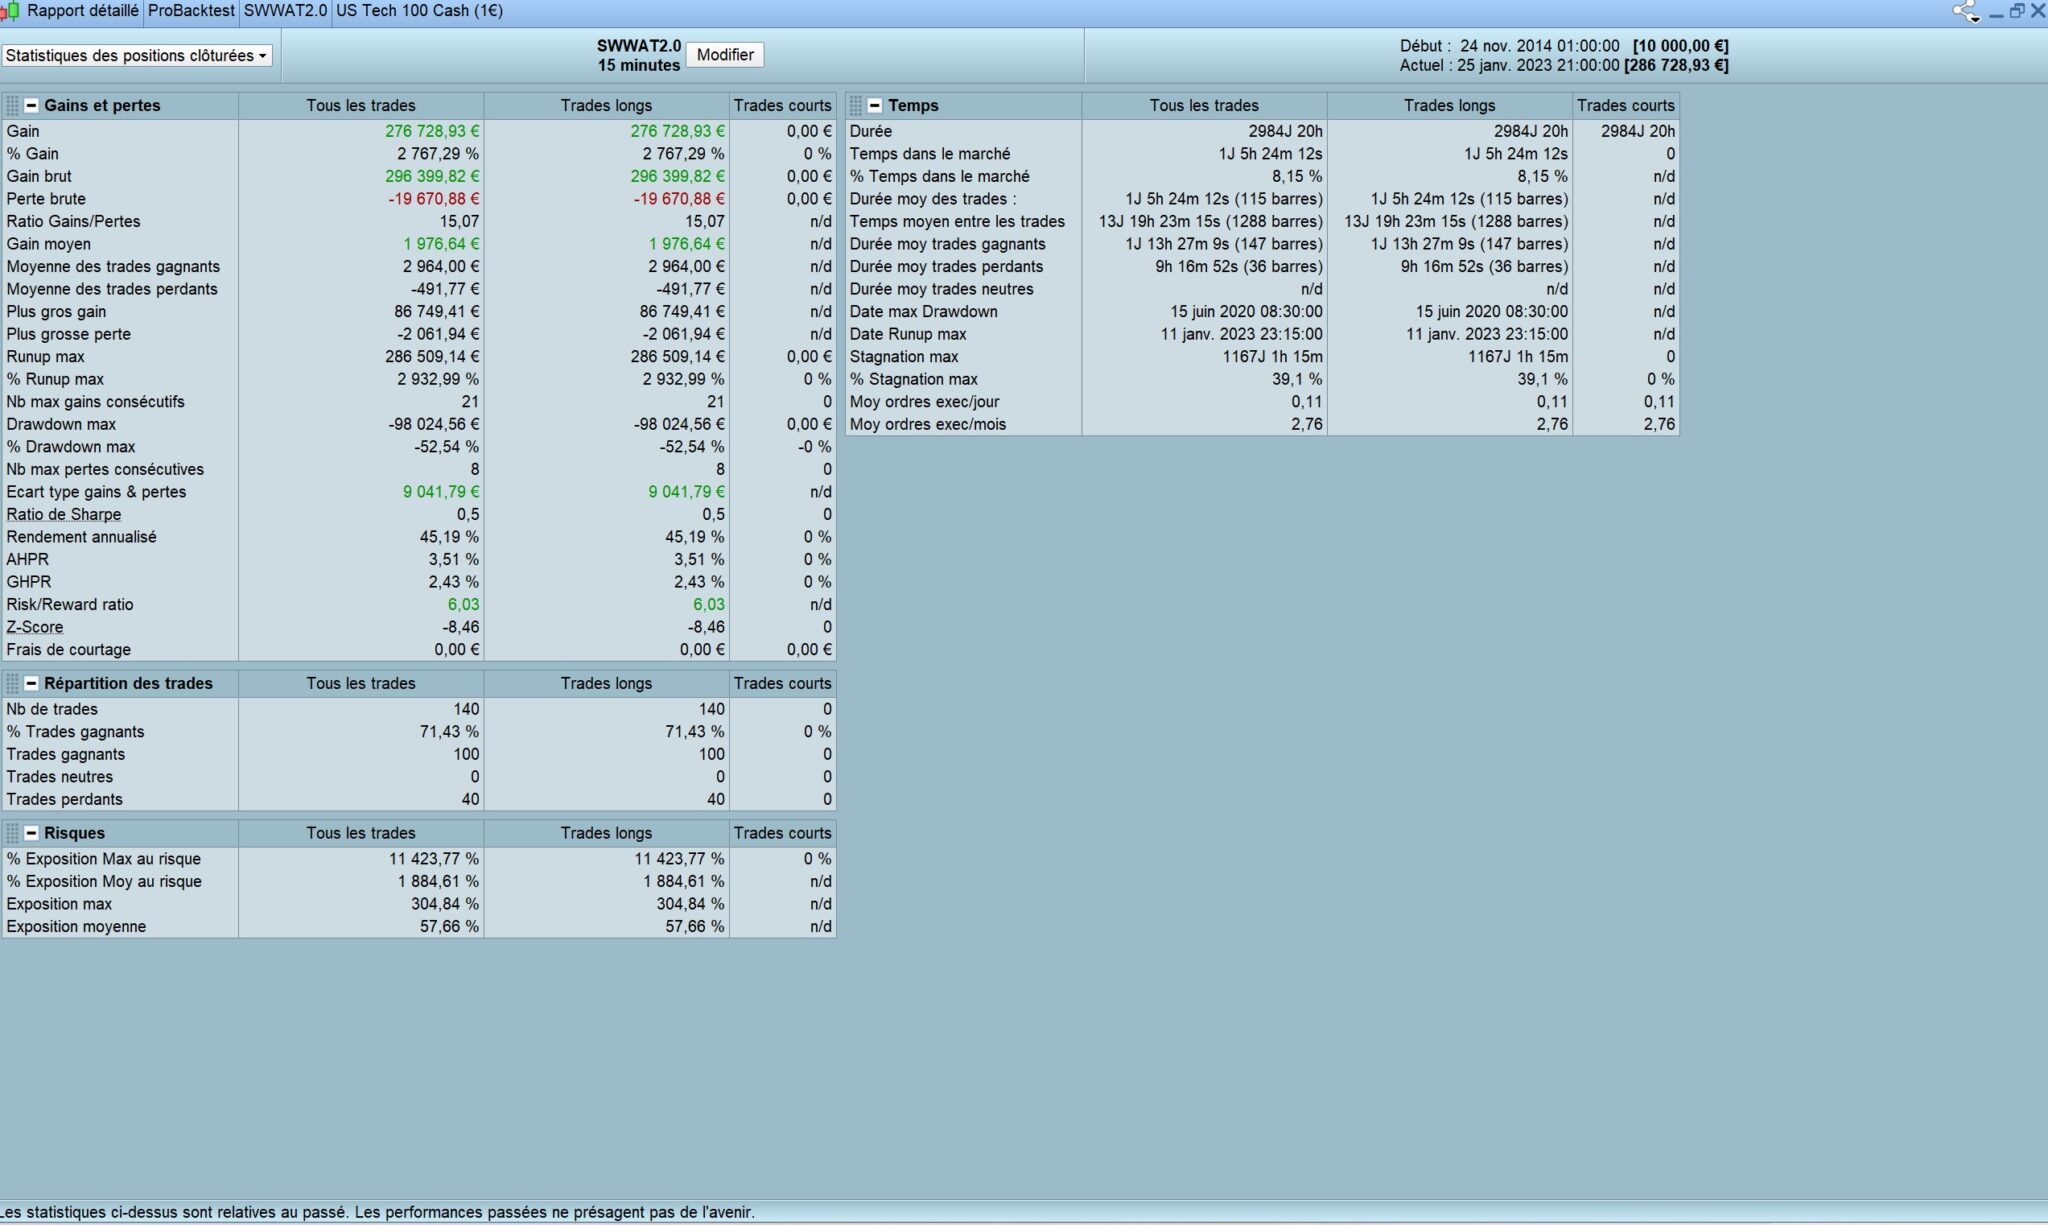
Here’s a backtest over 200000 bars. I didn’t knew it was possible to go over 15000 bars.
I still have a lot to do to improve the bot. I am still at the begining.
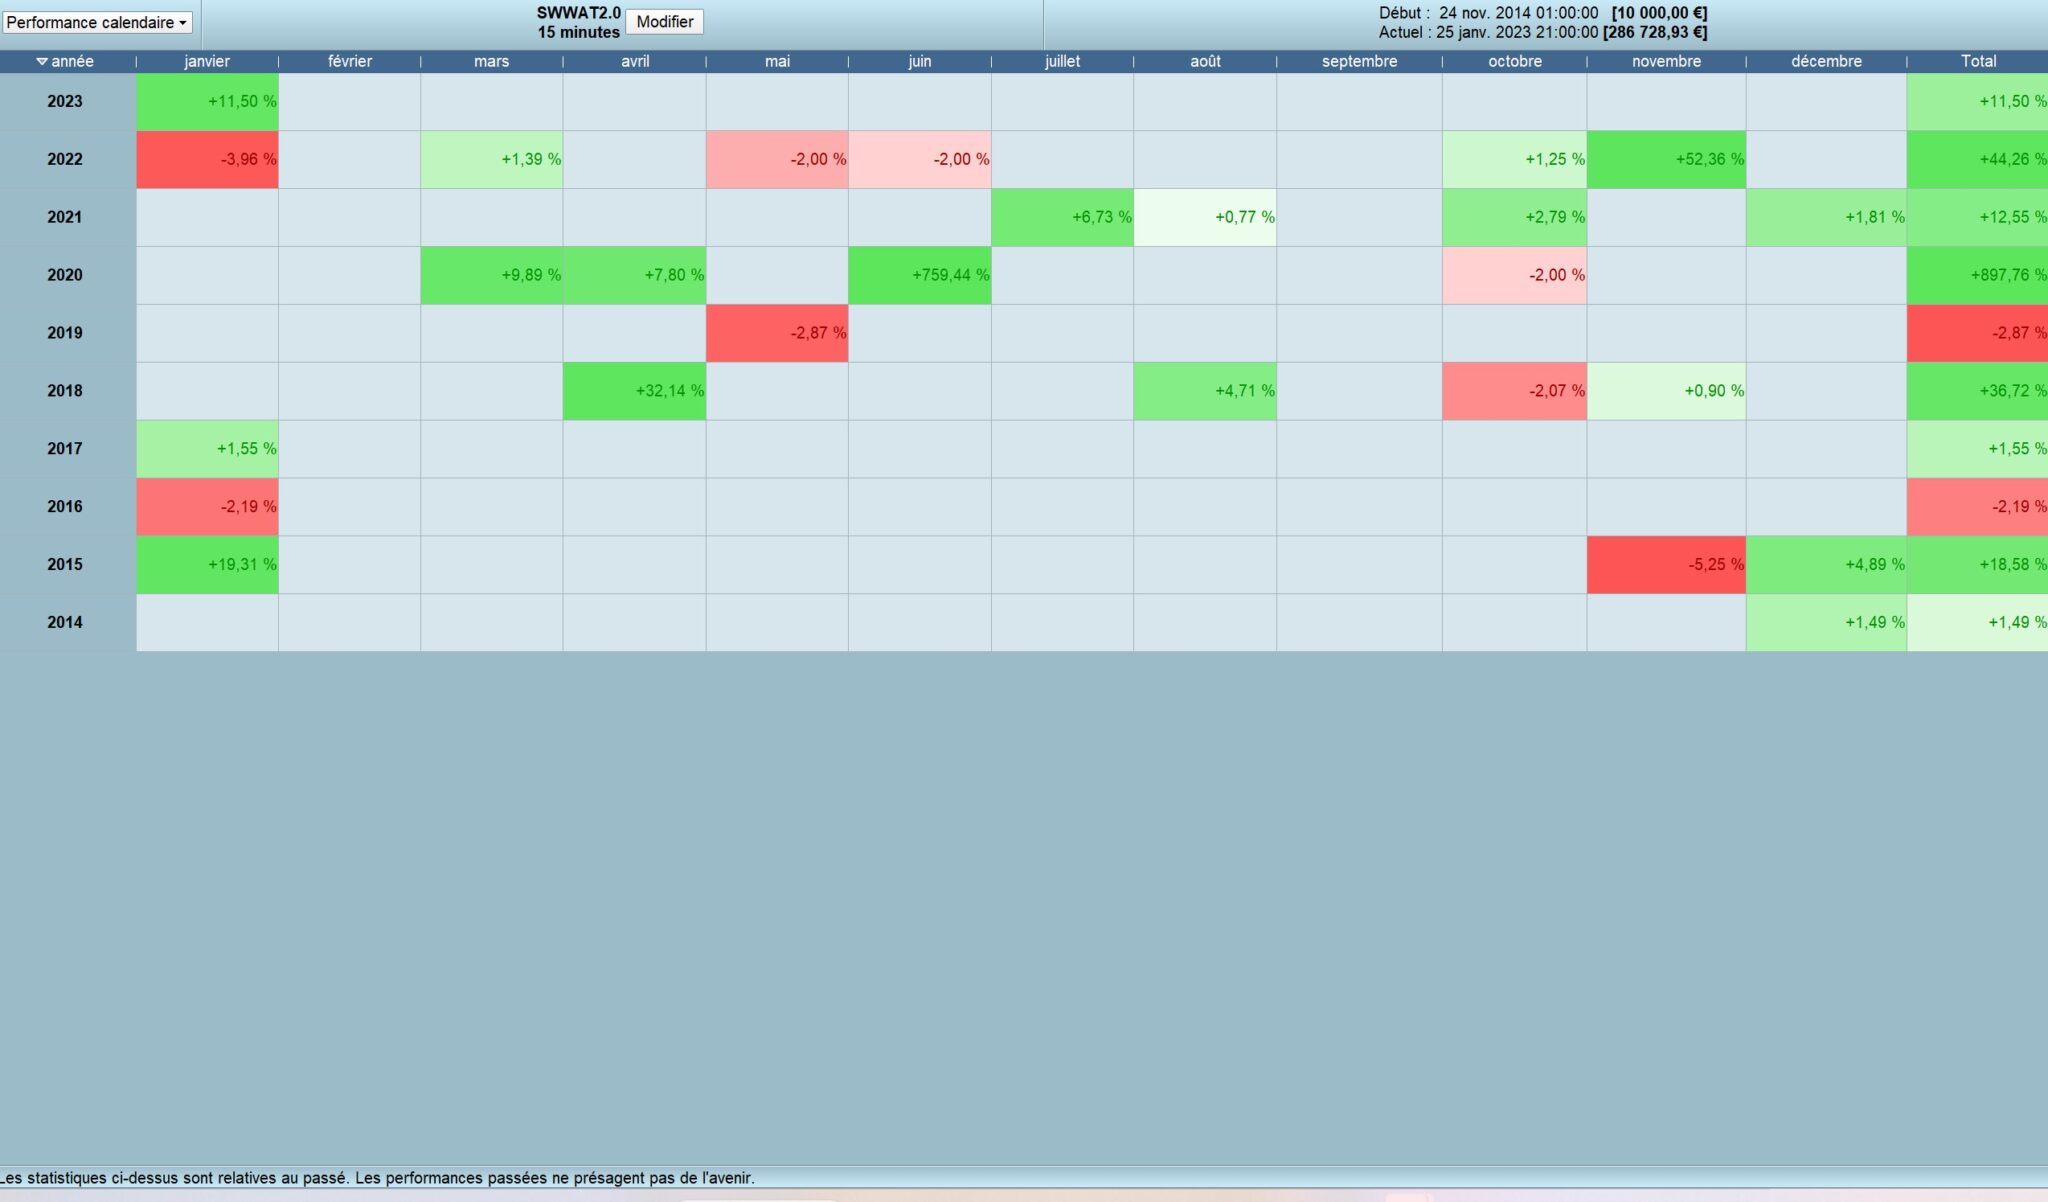
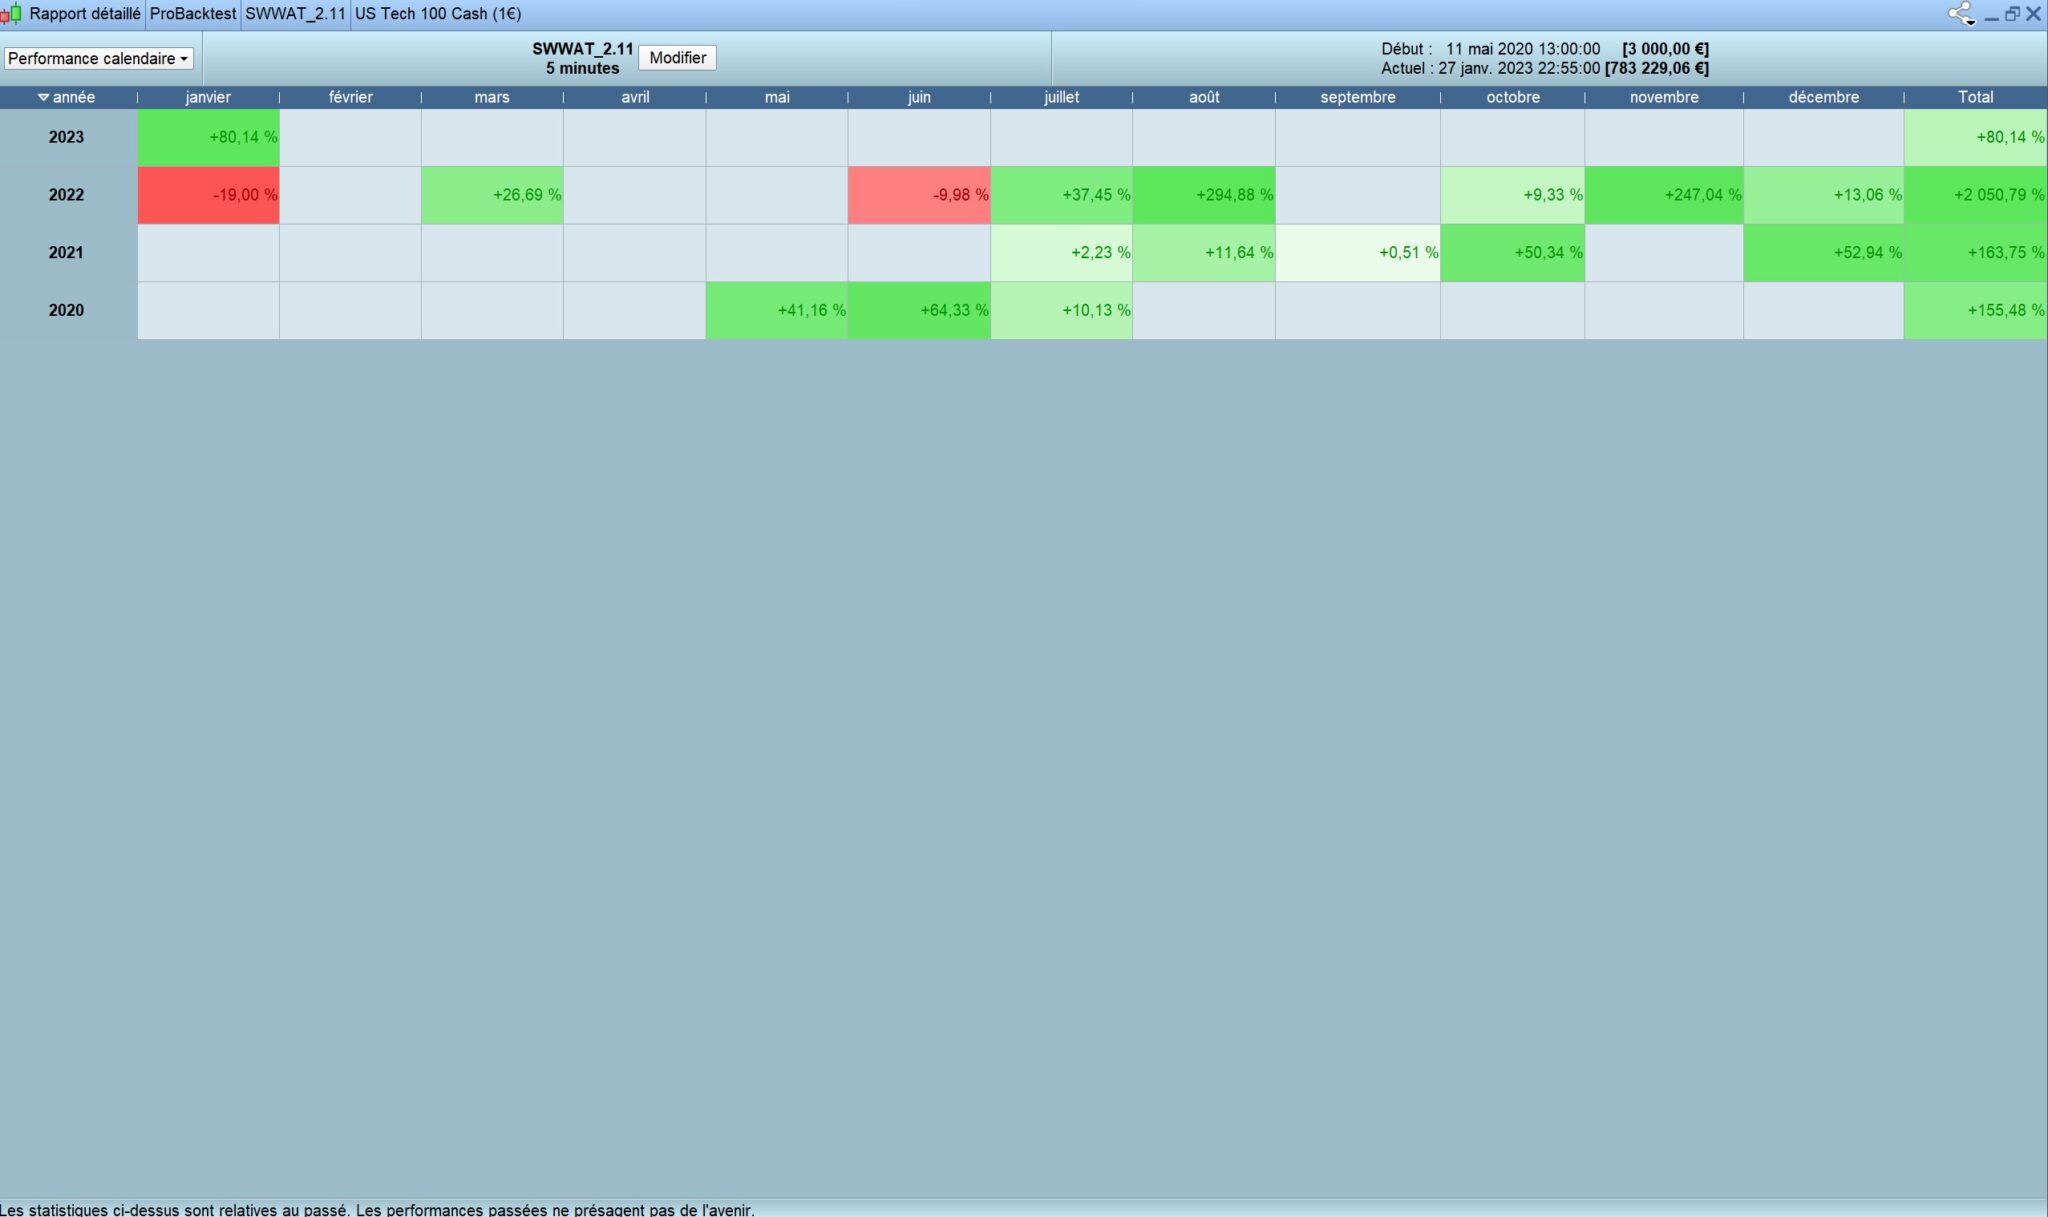
For now, it is Longside only but behaved better in 2022 than 2020 and 2021. This is certainly because it is based on Wolfe wave which is a reversal pattern…
What are the settings used? Spread included and with tick by tick backtests? Now the best to do is to launch it on ProOrder in live trading, which is a requirement for a product to be approved on the marketplace website.
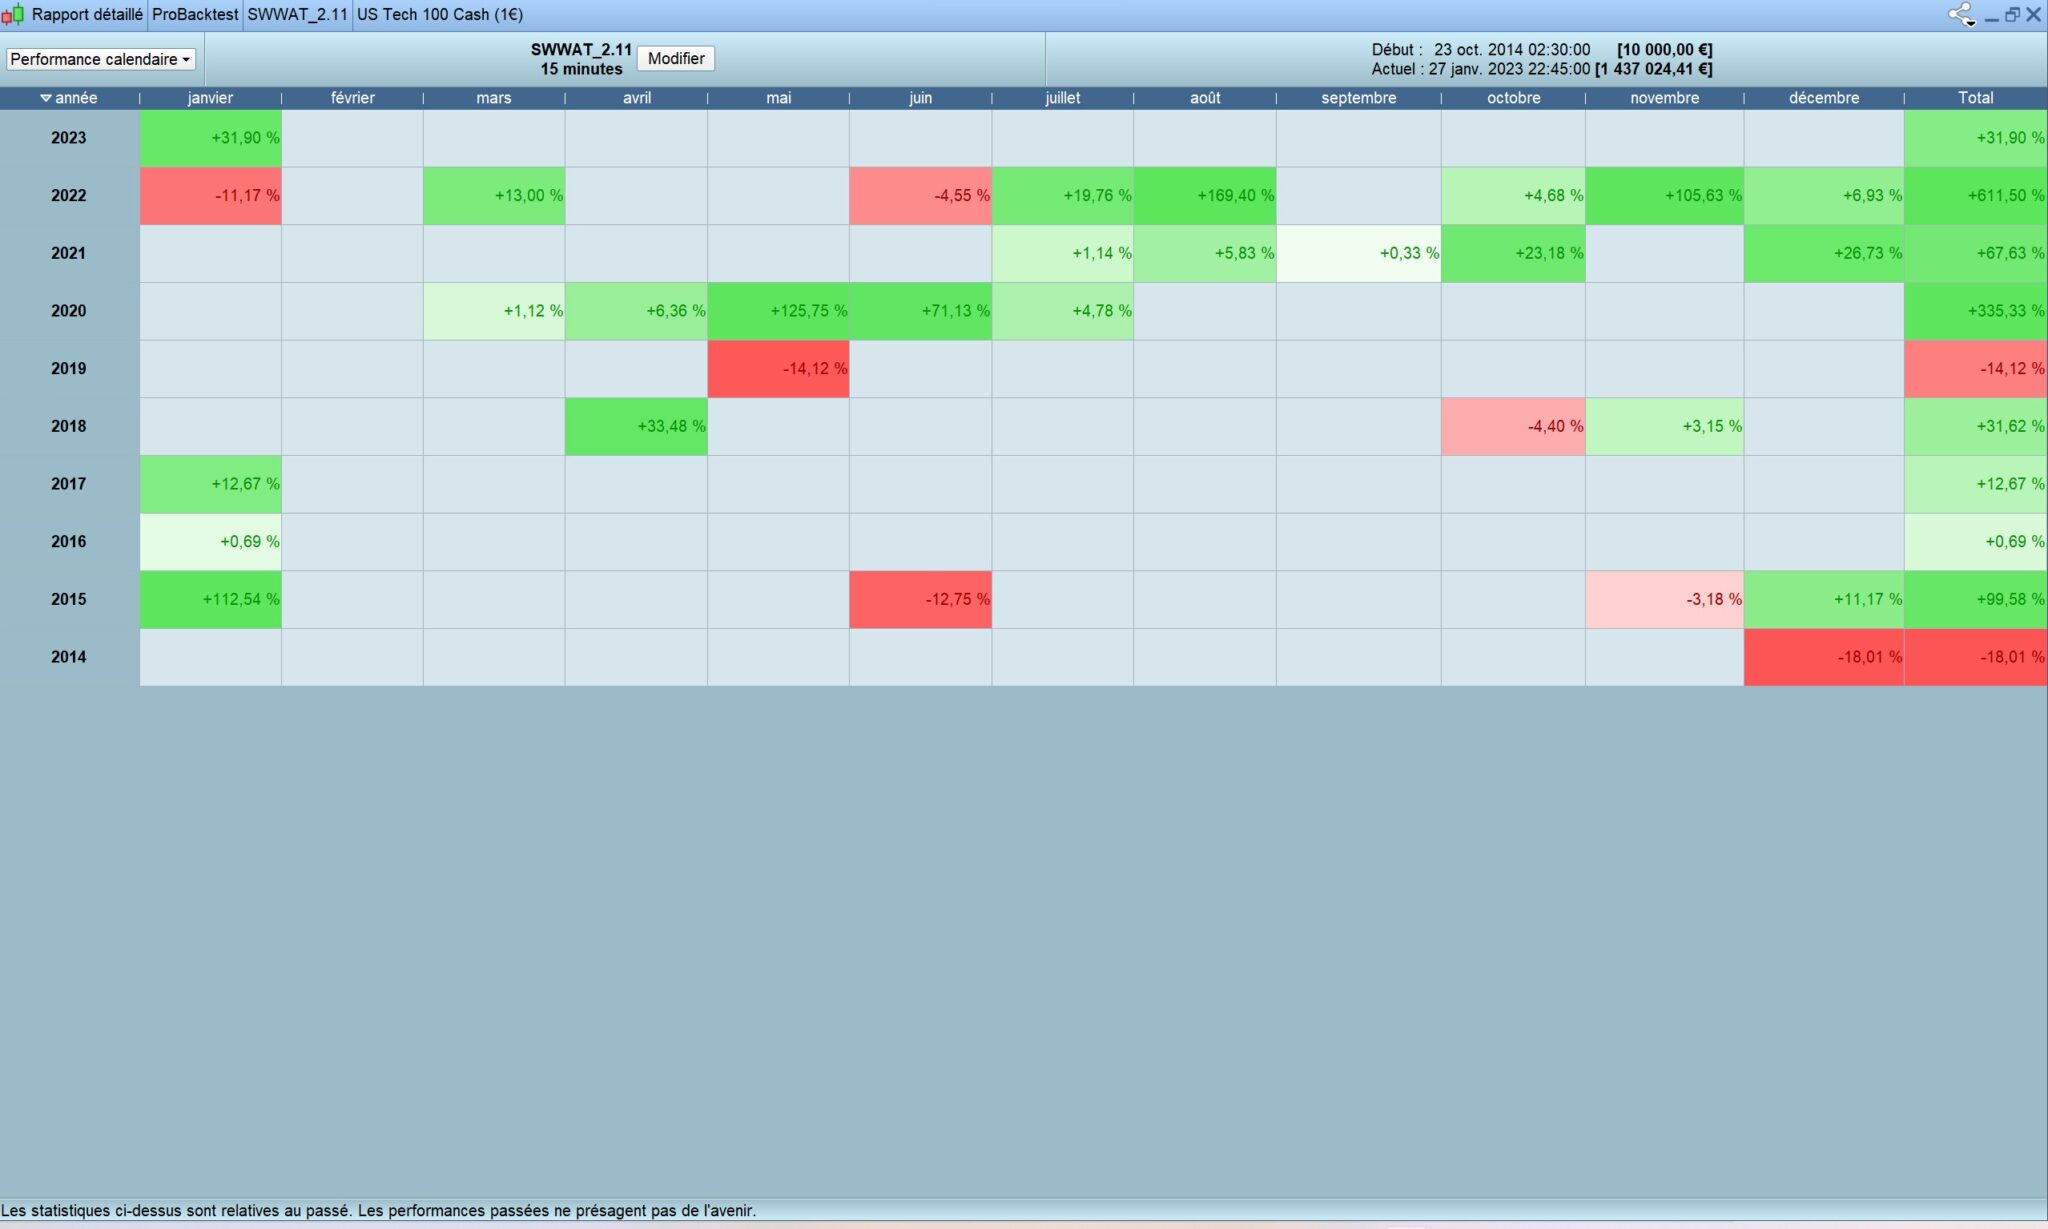
You don’t see anything relevant in your backtest. Share curve, monthly evaluation, long/short comparison. All of this interests people.
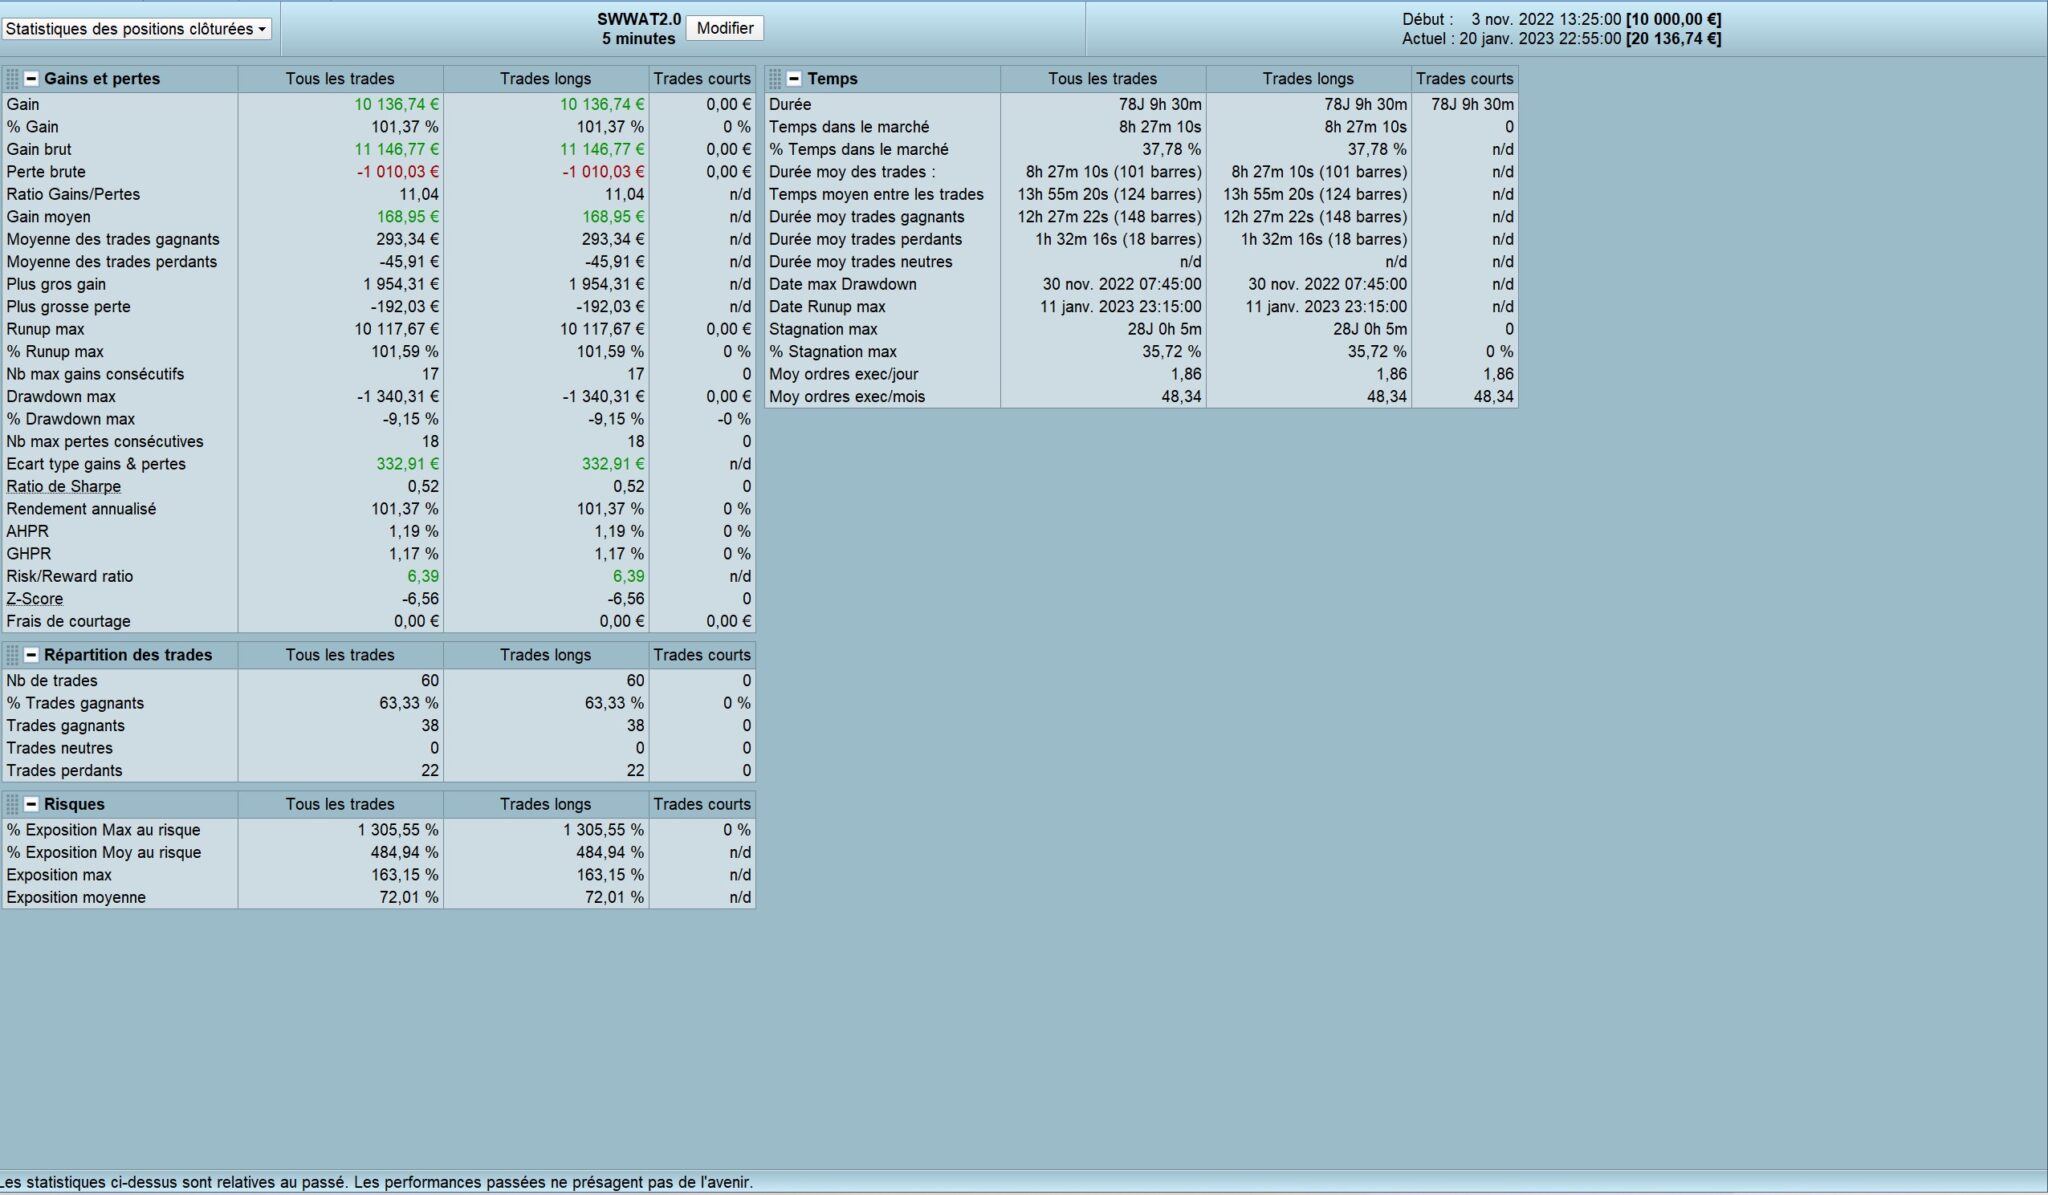
The backtests are with spread included and tick by tick.
I used 2% maximum risk for each Wolfe waves detected, but there is also a filter that remove the “bad ones”
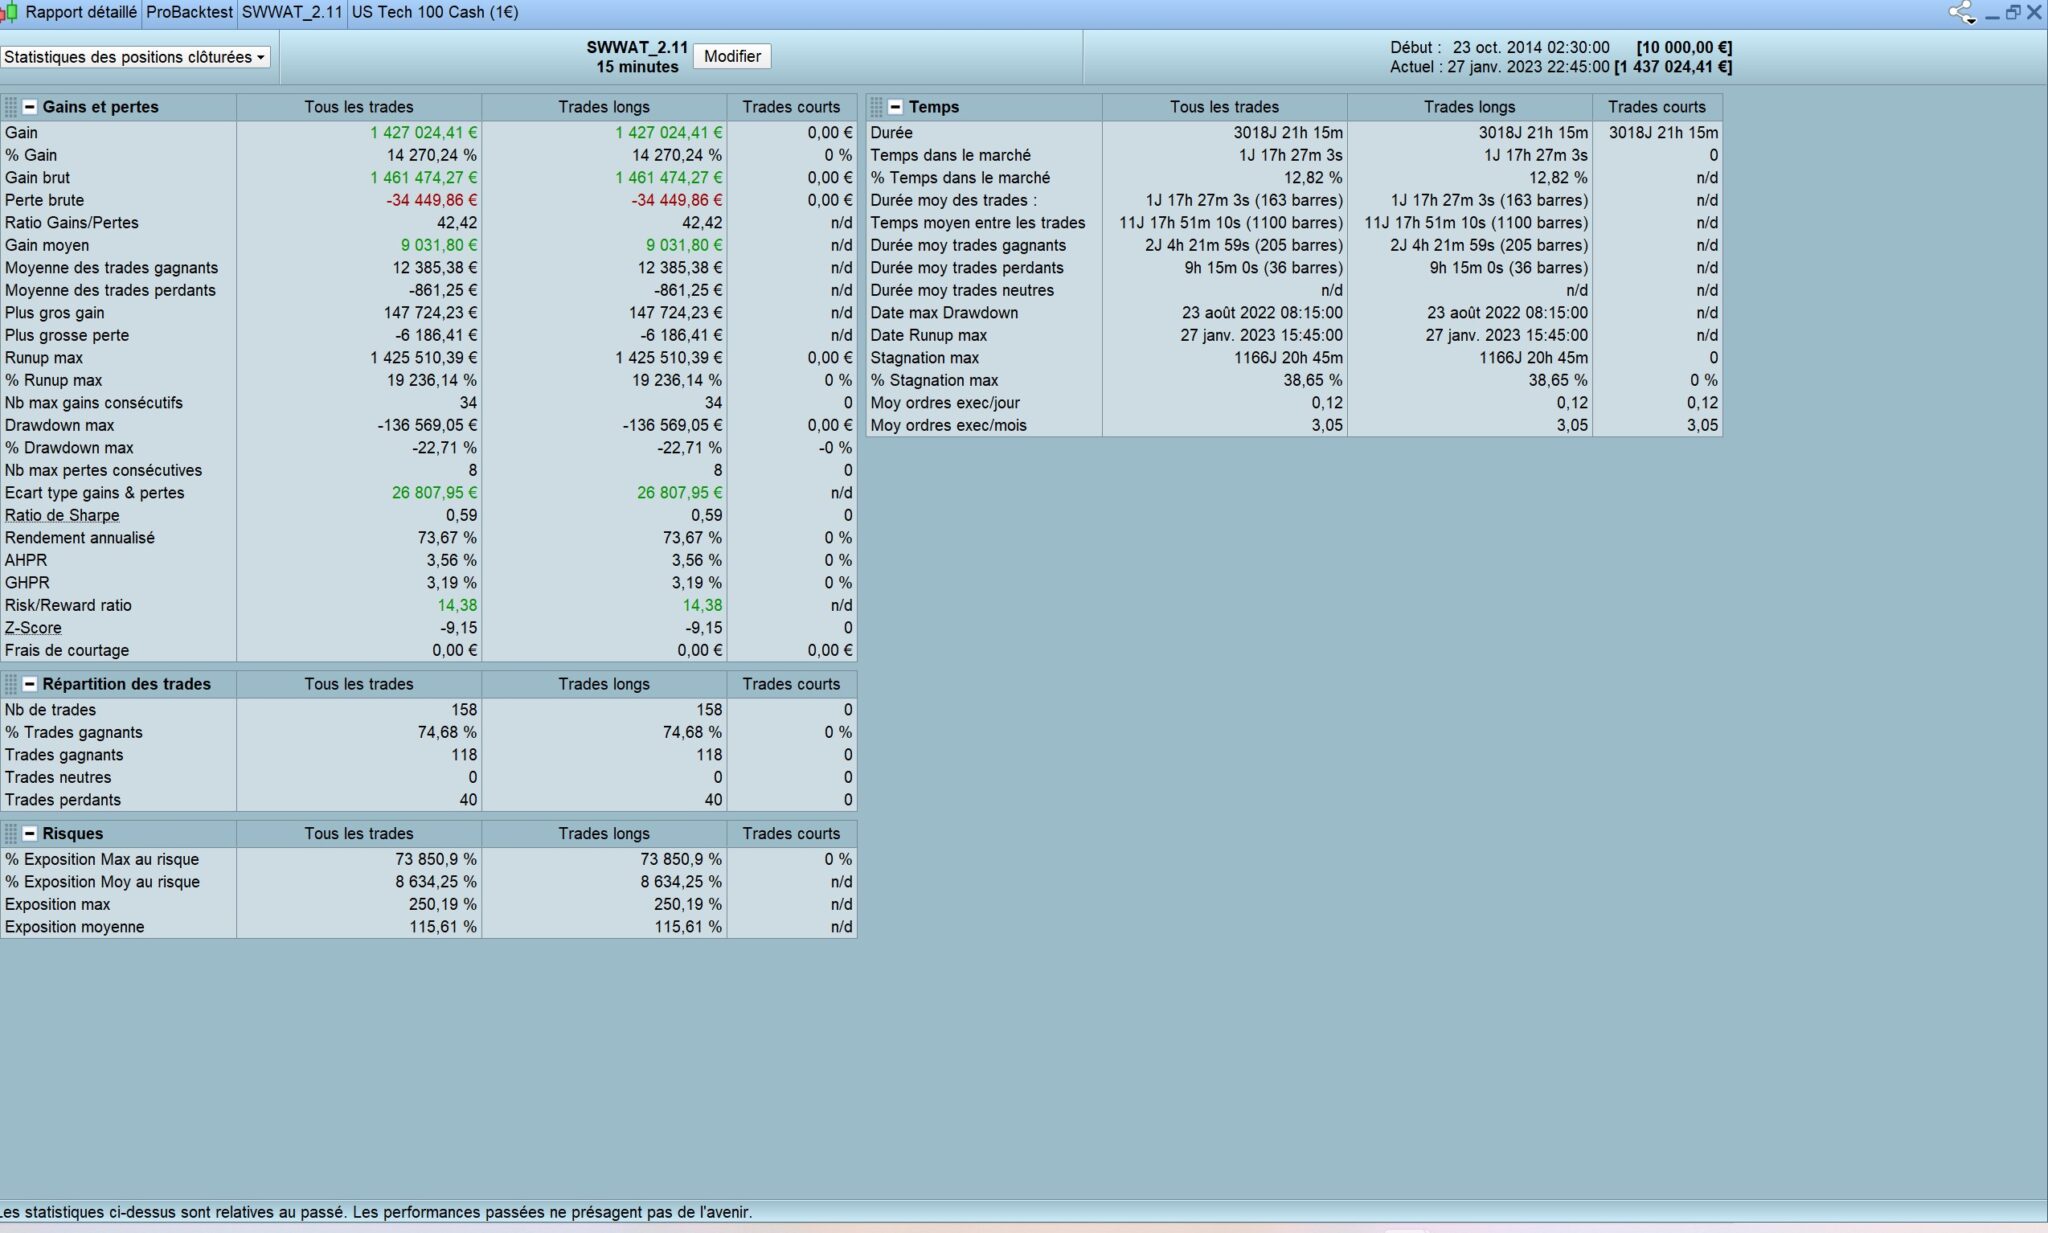
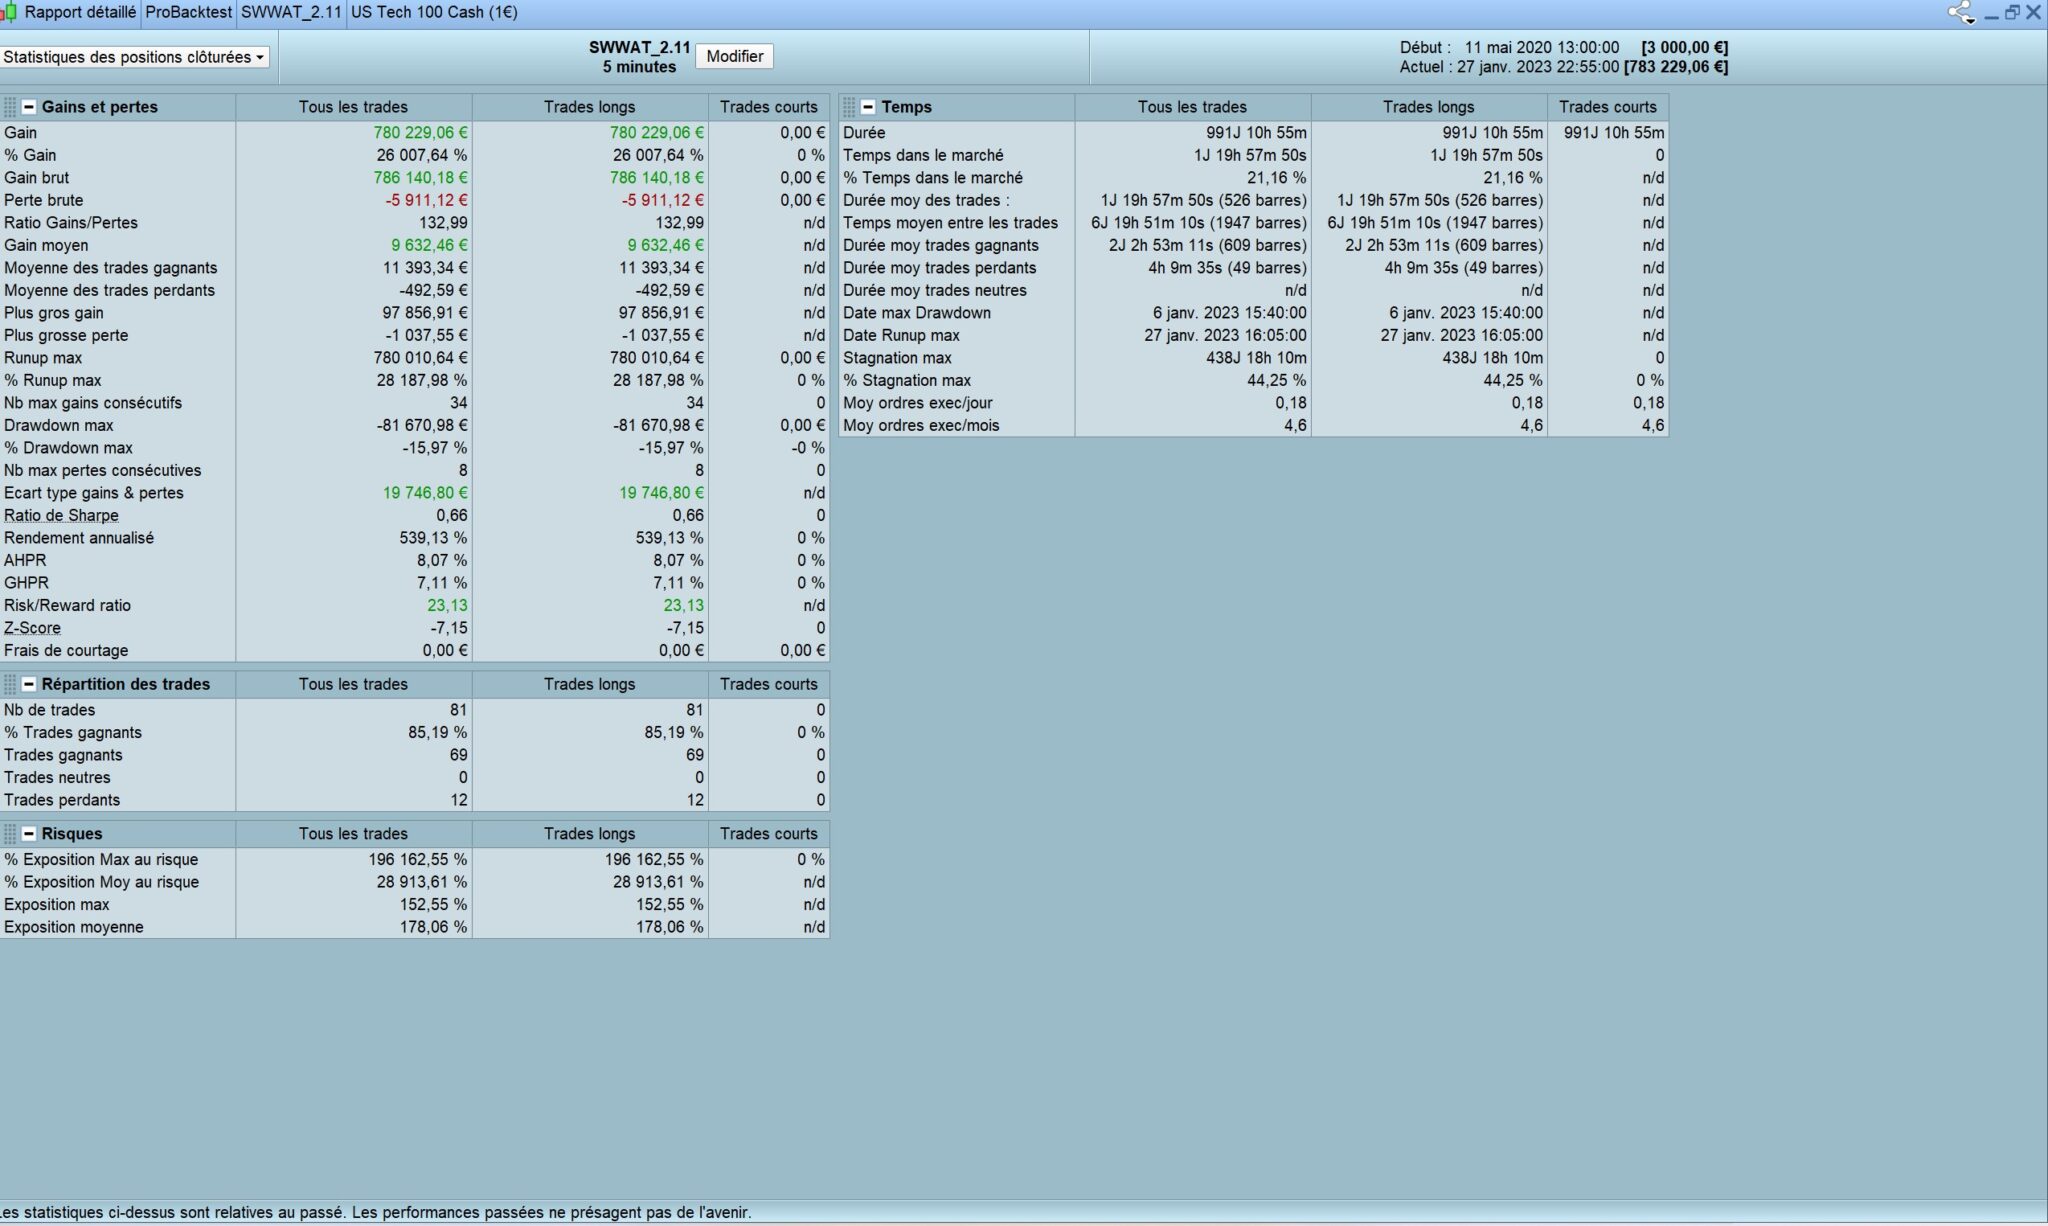
I’m still improving the code but i’d like to know which score to look at ? Z-score ? Sharp ratio ? Risk/Reward ratio ?
What is an acceptable (or good) Sharp ratio ?
How to interpret the Z-score ? Is it normal that is negative ?
You don’t see anything relevant in your backtest. Share curve, monthly evaluation, long/short comparison. All of this interests people.
I will post very soon, after improving filters and testing with longer period than i did for now…
Show the equity curve with positions under the equity curve and price curve under the positions.
I’ll show very soon. Thanks for suggestion
IMO the risk/reward ratio is of great interest.
About your Z-Score question:
Loss/gain sequence are random or not, the sign simply tells us whether the dependency is positive or negative, i.e. :
Negative Z-Score – the dependency is positive.
Positive Z-Score – the dependency is negative.
Positive dependence – a benefit will be followed by a benefit and a loss by a loss.
Negative dependence – a loss will be followed by a gain and a gain by a loss.
And how sure can we be that this will happen? That’s the percentage that you are told in the z-score value of your system. So, for example, if the z-score = 2.17 (97.0%), it means that there is a 97% confidence level that a loss will be followed by a profit and a profit by a loss (negative dependence). In this case, you would want to miss a trade after a profit and take a trade after a loss to maximize profits and minimize losses.
Many thanks Nicolas for the precisions.
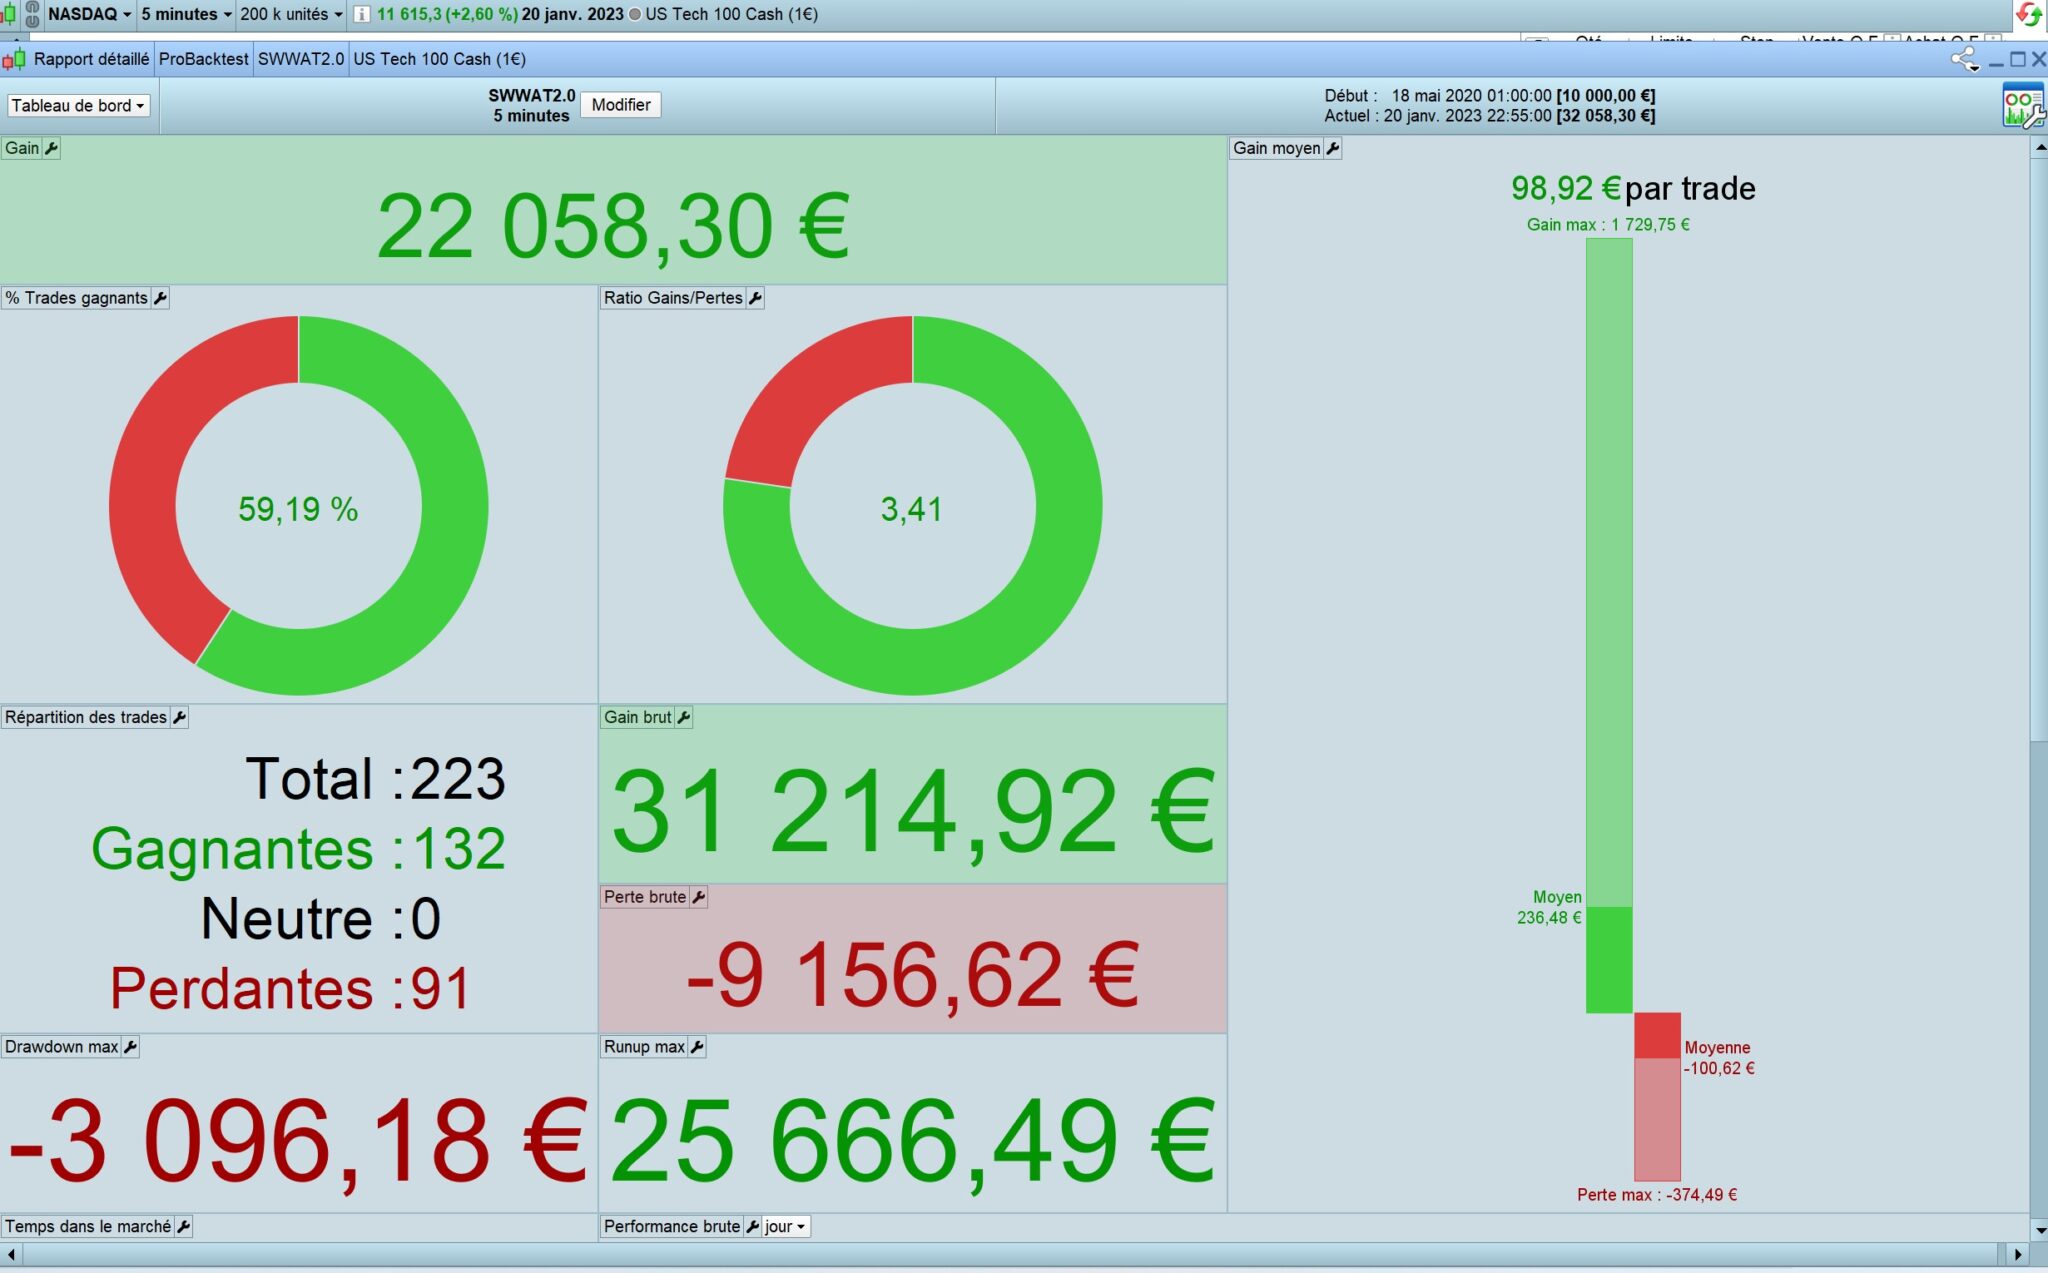
I’m focusing on the risk/reward ratio to improve the SWWAT (Smart Wolfe Wave Automatic Trading), which seems very very promising…
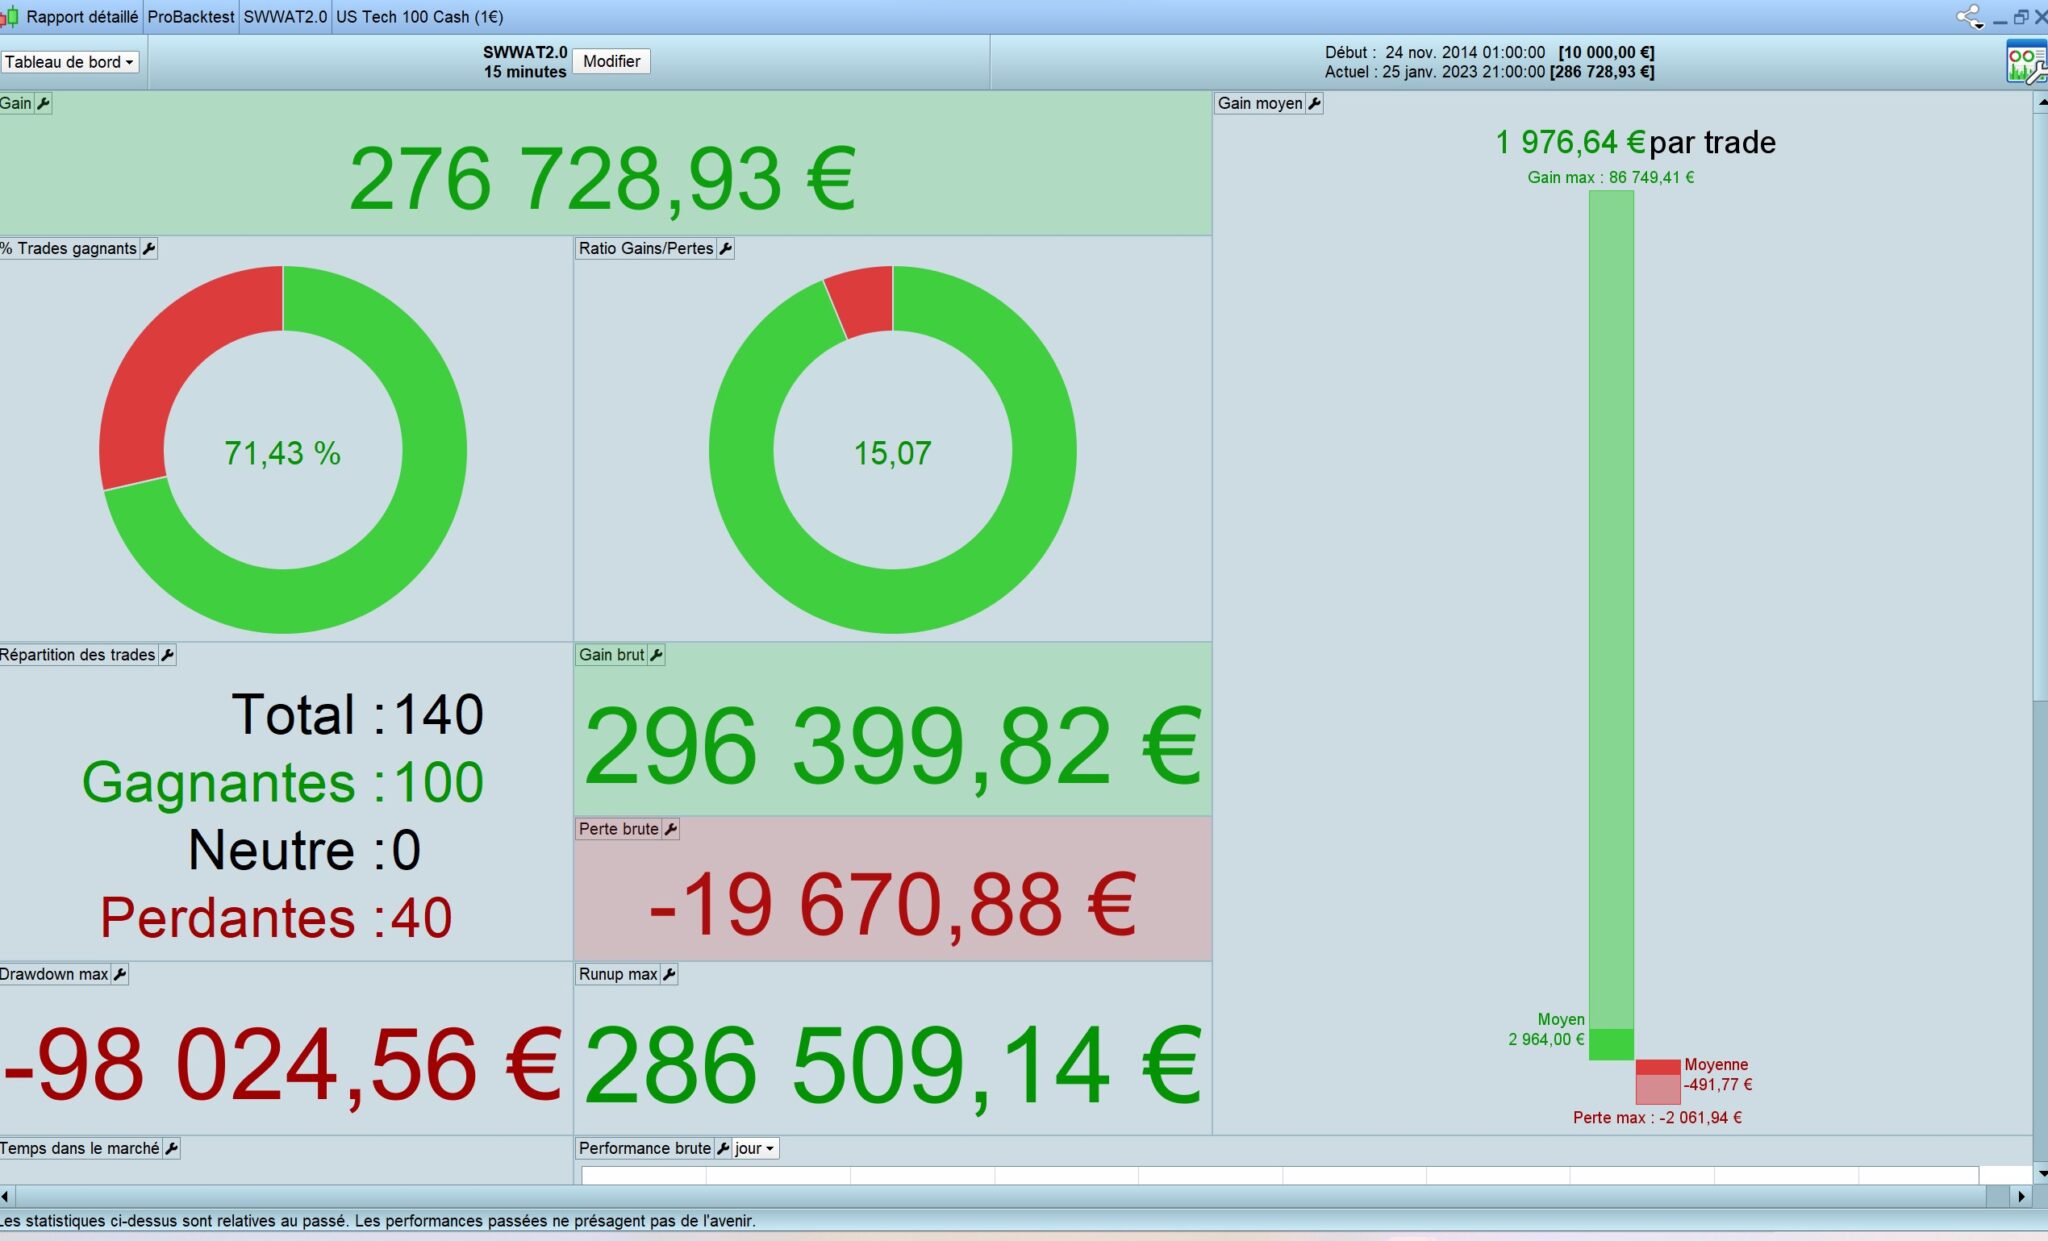
10.000 to 286.000 in ten years with 2% risk for each Wolfe wave that is traded.
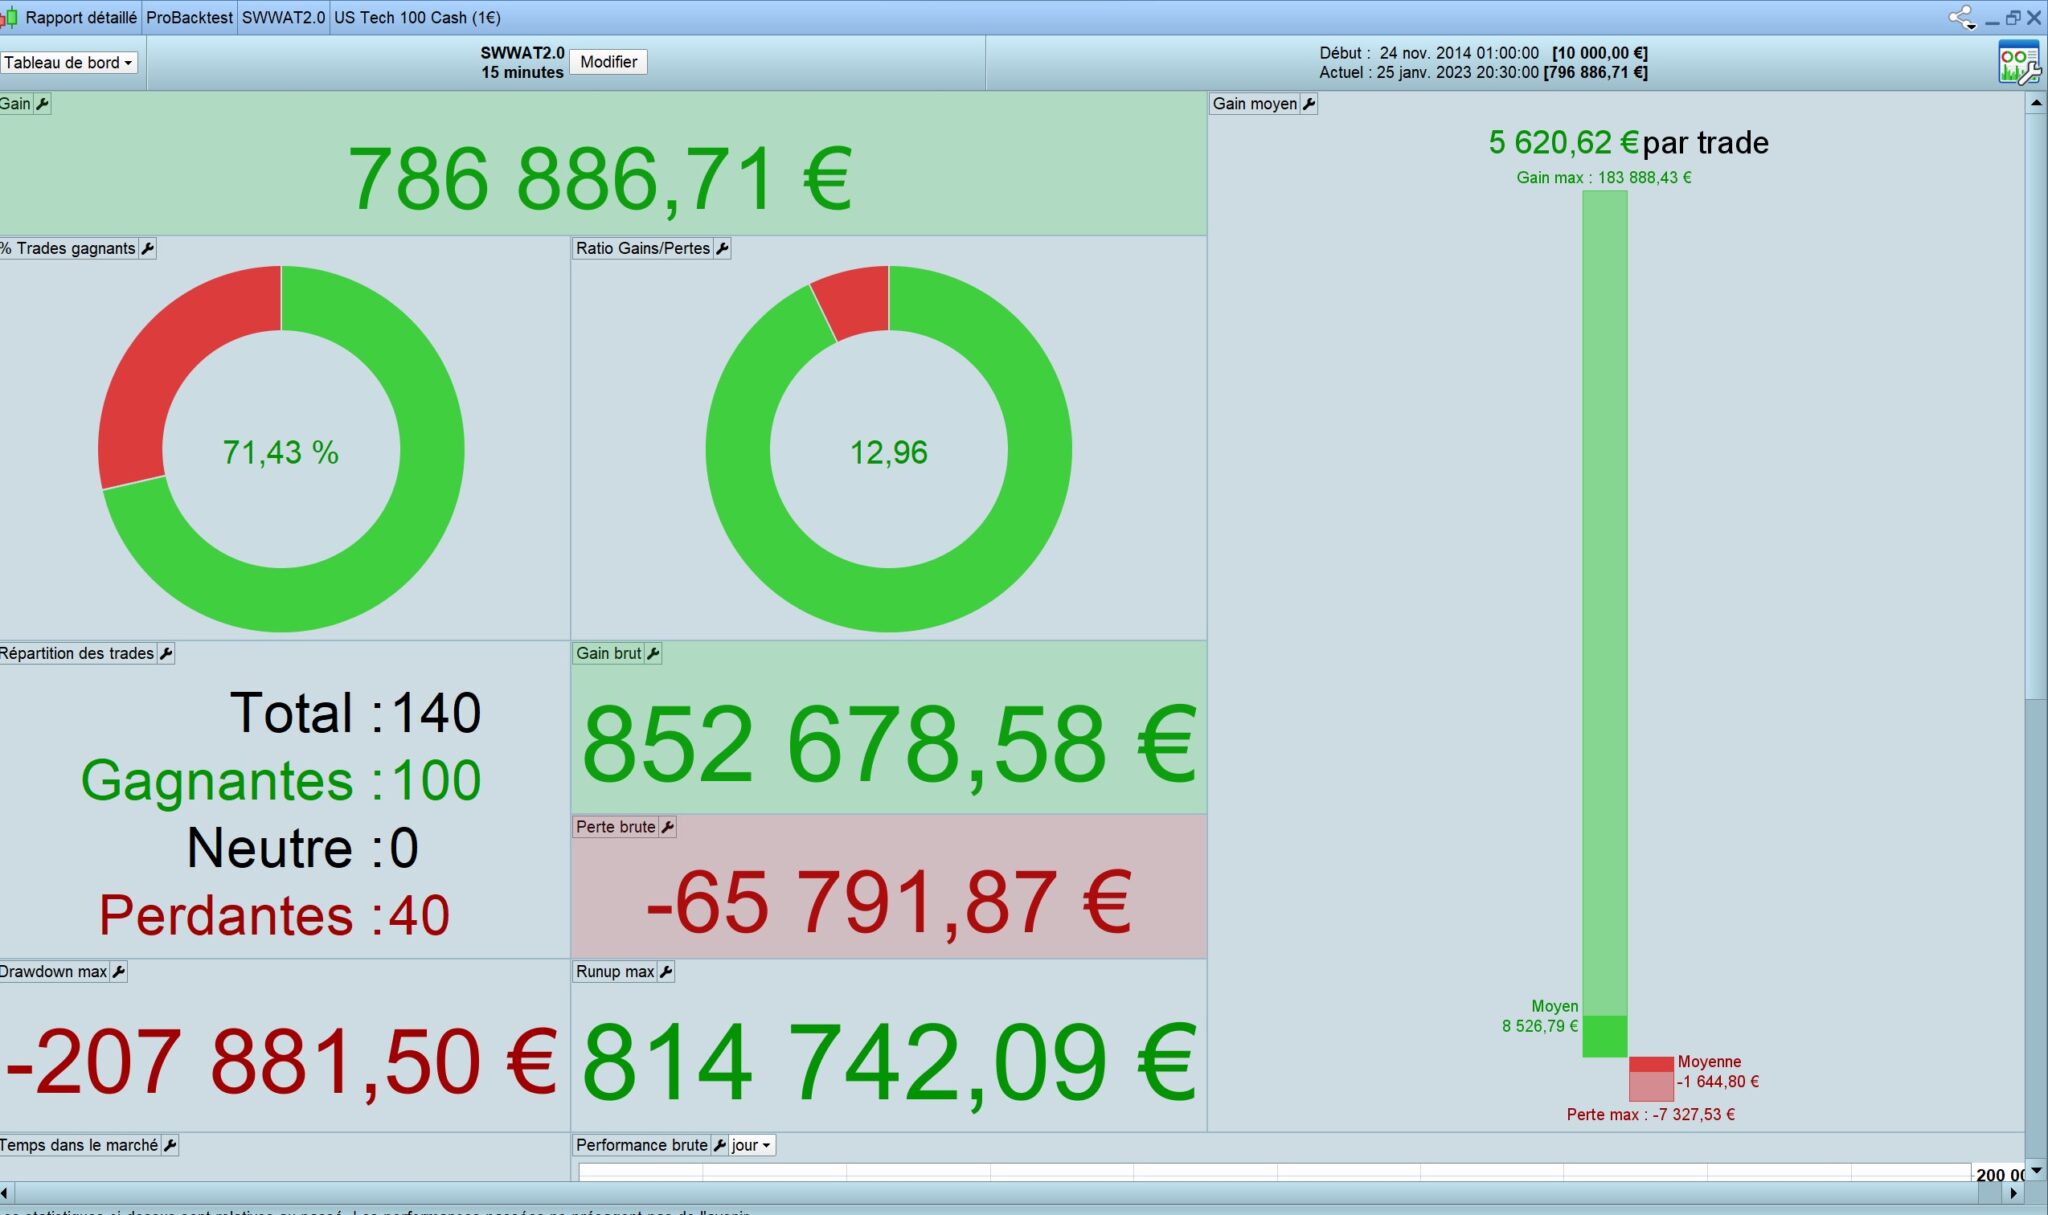
10.000 to almost 800.000 in ten years with 3.33% risk for each Wolfe wave that is traded.
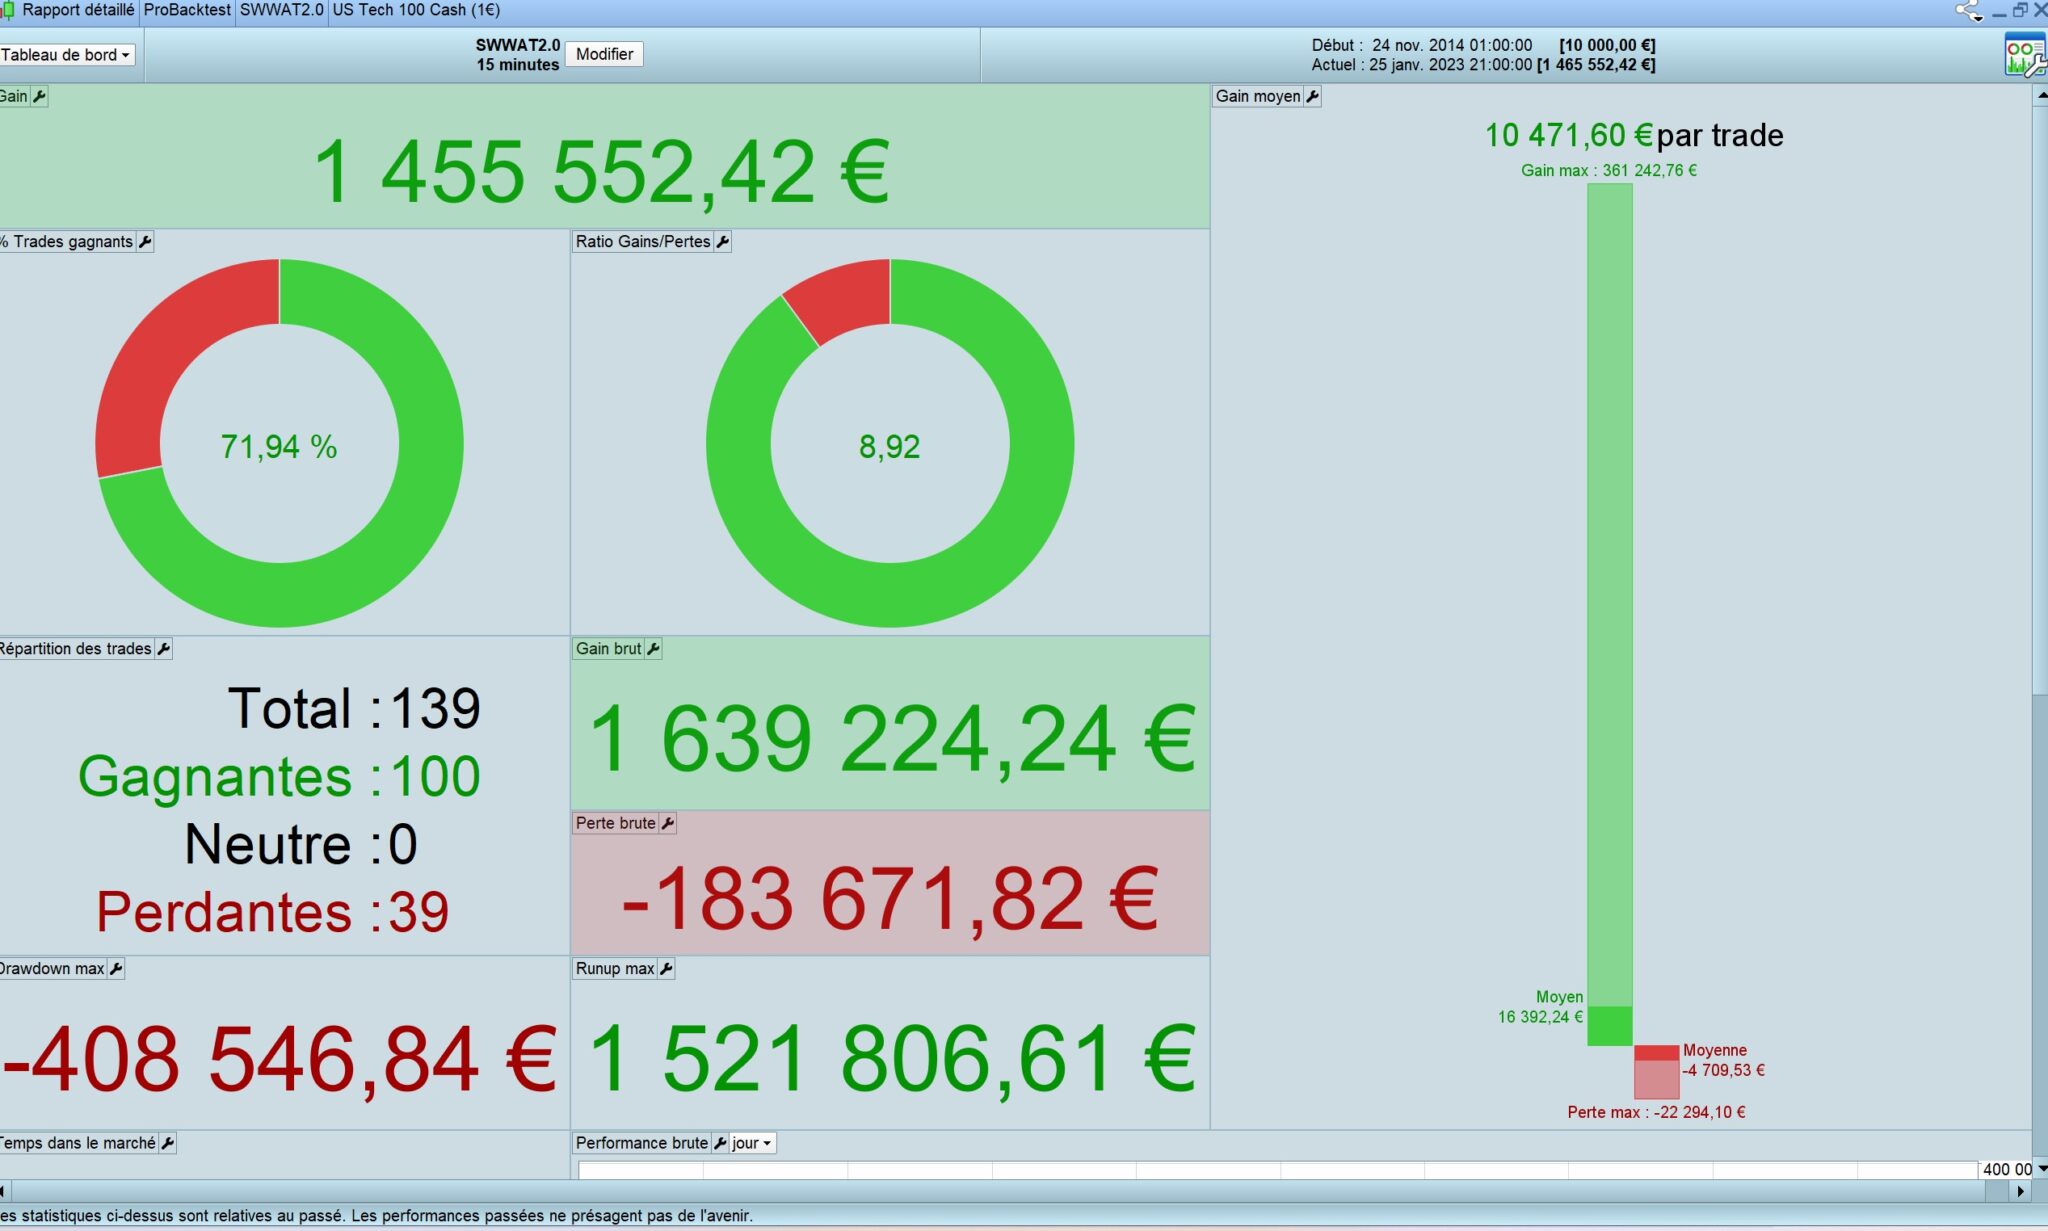
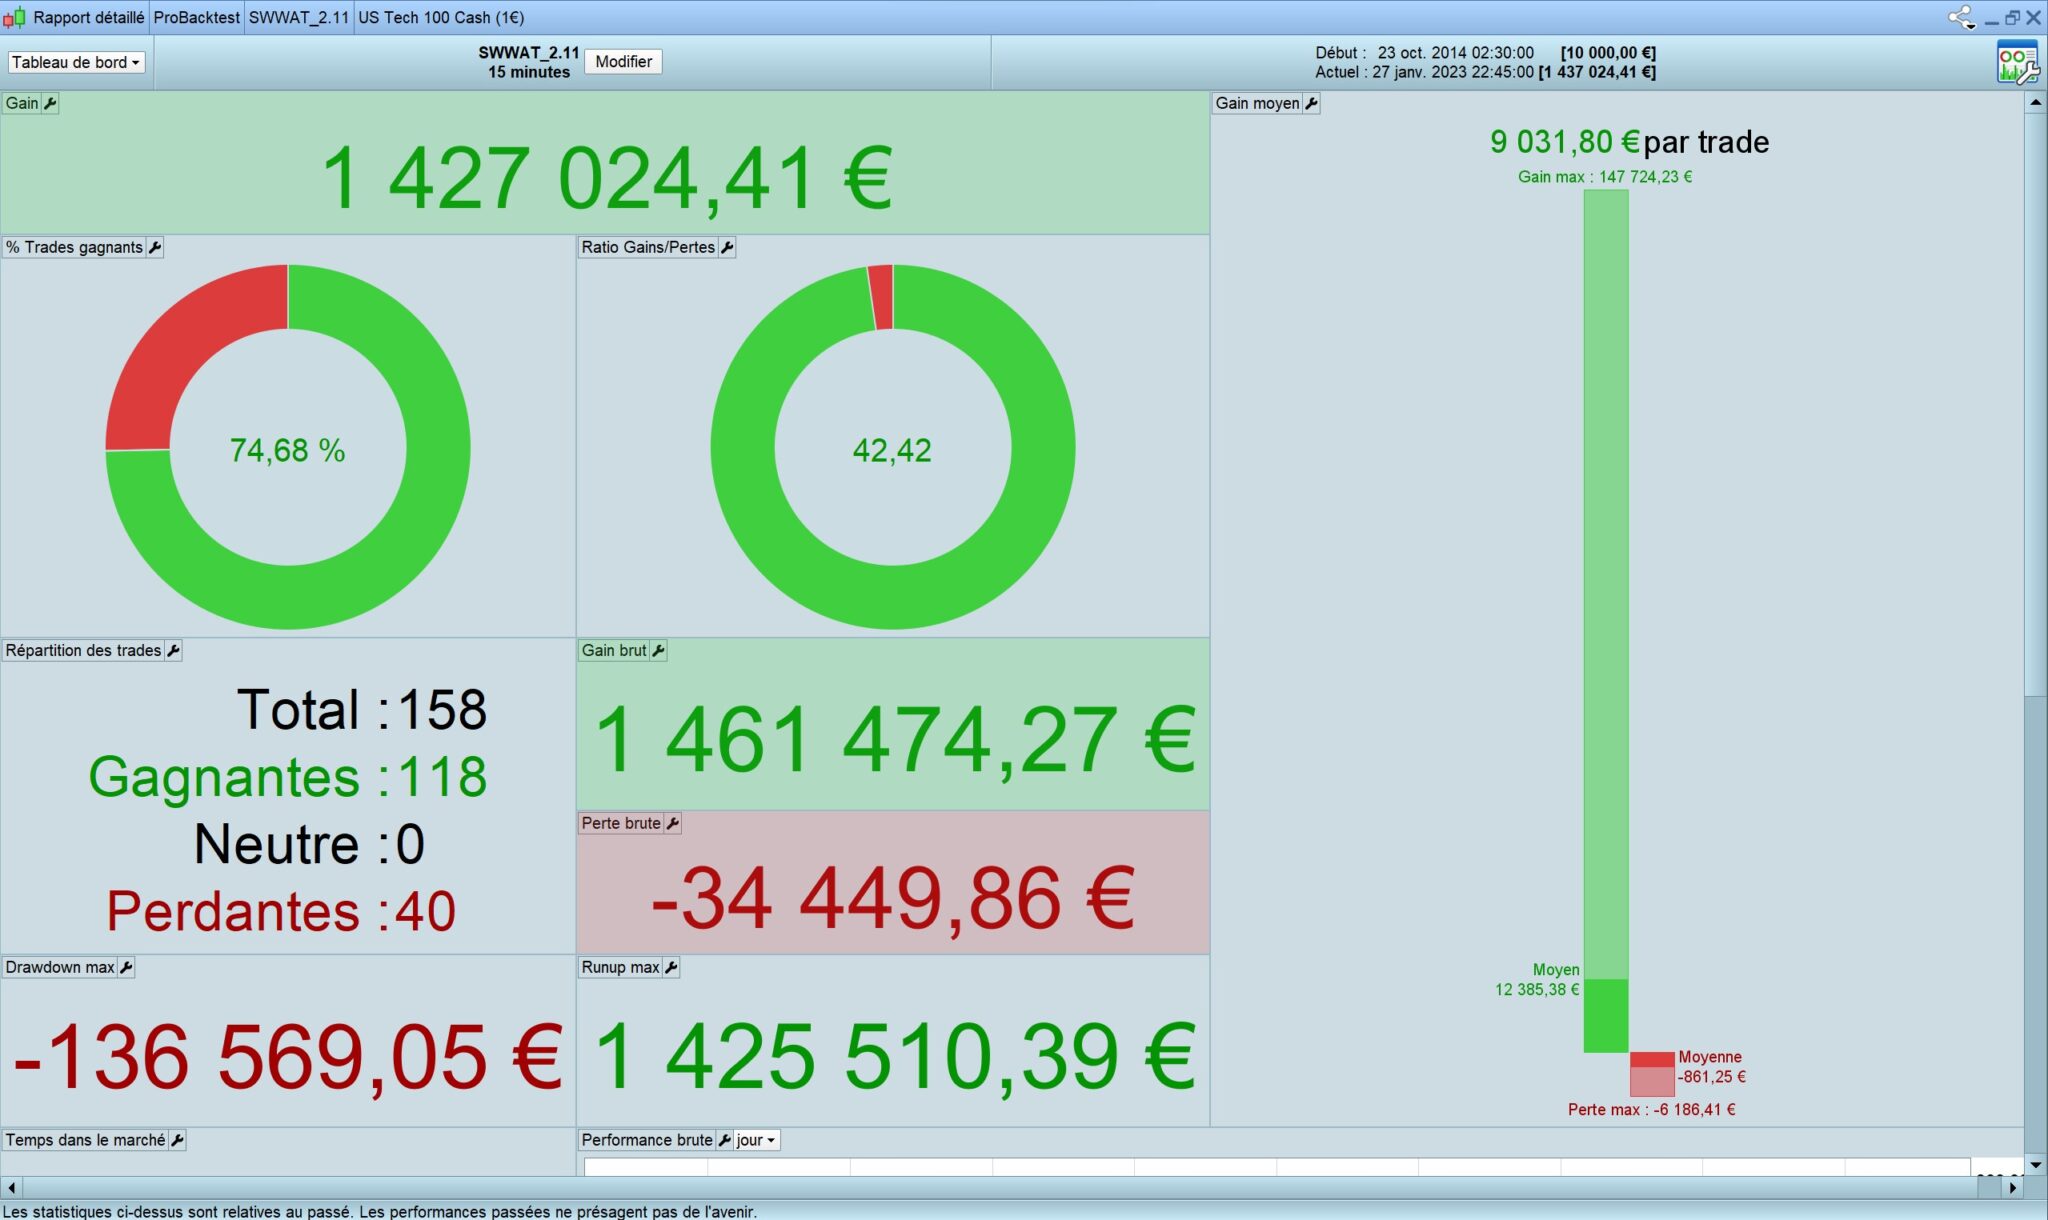
And 10.000 to almost 1.465.000 in ten years with 5% risk for each Wolfe wave that is traded.
With 3.33% Risk per trade and 5% risk per trade
While trying to improve the bot i noticed a big bugs with MTF and Call. The call instruction is used in 1 hour time frame and is sending 15 variables. Maybe the problem is coming from too much variable that are returned?
Some signal that exist in 1 hour time frame are not sent into smaller time frame (5 minutes) while others that does not exist (no signal in hour) are created in the smaller time frame…
I decided to retest the bot without using call (i copied the indicator in my strategy code instead of the instruction call and now it is working perfectly…
Is there a known bug with call and MTF ? Am i trying to return too much variables ?
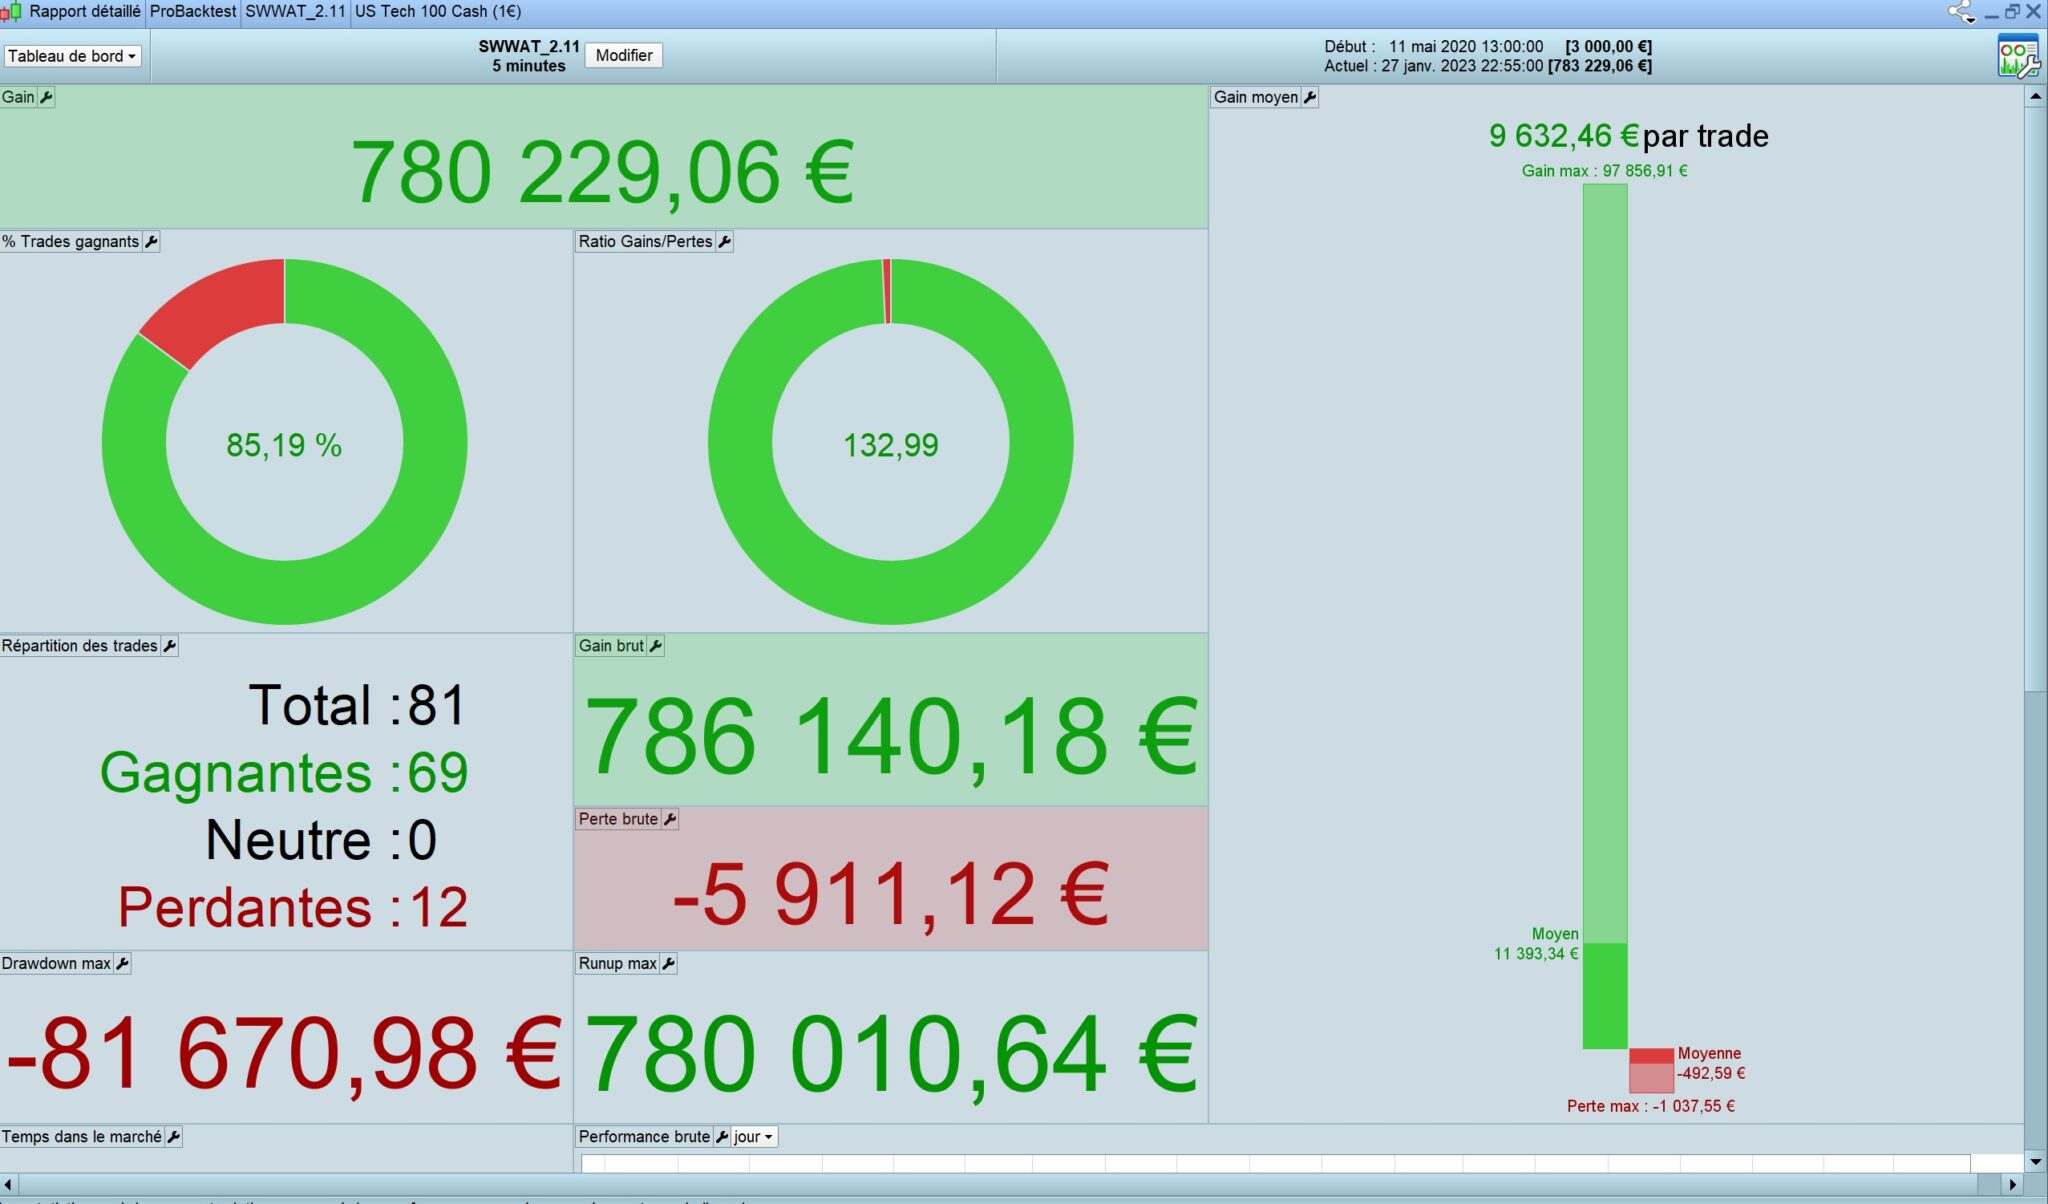
From 3.000 to 783.000 in less than 3 years using 10% risk for each wolfe wave… This is a monster 🙂
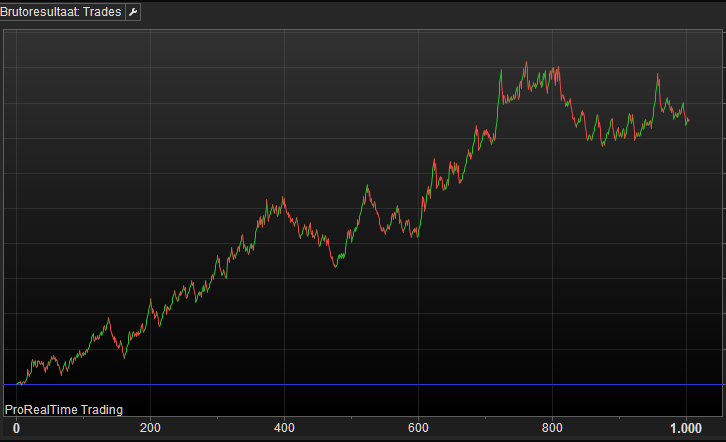
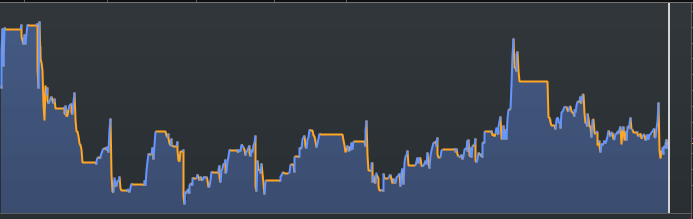
Lucas, can you please show the Equity Curve by some means ? Below two examples of that.
Why ? because it looks like you may have huge drawdowns in there. The first example (from the Statistics form – you show a version of that too) would show it from your real (though backtested) finished trades. The second example is usually in the top of the chart with the backtested instrument and shows the continuous flow of money (not finished-trades related).