JS
JSParticipant
Veteran
If you want to use different time frames, you have to put that above your code:
TimeFrame(5 minutes)
// Conditions to enter long positions
indicator1 = ExponentialAverage[8](close)
indicator2 = (High[1] + Low[1] + Close[1])/3
c1 = (indicator1[1] < indicator2[1])
indicator3 = ExponentialAverage[8](close)
indicator4 = (High[1] + Low[1] + Close[1])/3
c2 = (indicator3 > indicator4)
TimeFrame(15 minutes)
indicator5 = Close[1] + (High[1]-Low[1]) * (1.1 / 4)
c3 = (close > indicator5)
indicator6 = Close[1] + (High[1]-Low[1]) * (1.1 / 6)
c4 = (low[1] < indicator6[1])
indicator7 = Close[1] + (High[1]-Low[1]) * (1.1 / 6)
c5 = (close > indicator7)
Thanks JS,
I haven’t made myself clear.
The code is all based on the 1m chart . So visually, I have two sets of camarilla indicators on my chart (5m & 15m). On this 1m chart I have a set of criteria I want to meet based on 5m cam levels & another set of conditions to meet based on the 15m cam levels.
// Conditions to enter long positions
//Set of criteria to meet on the 5m cam
indicator1 = ExponentialAverage[8](close)
indicator2 = (High[1] + Low[1] + Close[1])/3
c1 = (indicator1[1] < indicator2[1])
indicator3 = ExponentialAverage[8](close)
indicator4 = (High[1] + Low[1] + Close[1])/3
c2 = (indicator3 > indicator4)
//Set of criteria to meet on the 15m cam
indicator5 = Close[1] + (High[1]-Low[1]) * (1.1 / 4)
c3 = (close > indicator5)
indicator6 = Close[1] + (High[1]-Low[1]) * (1.1 / 6)
c4 = (low[1] < indicator6[1])
indicator7 = Close[1] + (High[1]-Low[1]) * (1.1 / 6)
c5 = (close > indicator7)
Thanks for your patience.
JSParticipant
Veteran
Put your indicators under the correct time frame and put your conditions under time frame “default” (1 minute)
TimeFrame(15 minutes)
indicator5 = Close[1] + (High[1]-Low[1]) * (1.1 / 4)
indicator6 = Close[1] + (High[1]-Low[1]) * (1.1 / 6)
indicator7 = Close[1] + (High[1]-Low[1]) * (1.1 / 6)
TimeFrame(5 minutes)
indicator1 = ExponentialAverage[8](close)
indicator2 = (High[1] + Low[1] + Close[1])/3
indicator3 = ExponentialAverage[8](close)
indicator4 = (High[1] + Low[1] + Close[1])/3
TimeFrame(Default)
c1 = (indicator1[1] < indicator2[1])
c2 = (indicator3 > indicator4)
c3 = (close > indicator5)
c4 = (low[1] < indicator6[1])
c5 = (close > indicator7)
Ill have to take a look at this tomorrow.
Can you just confirm if they need to appear in the code in the order you have written them?
Thanks.
P
JSParticipant
Veteran
Hi Paulg999
This must indeed be the order..
Good luck and we’ll probably talk to each other again… 😉
Hi JS,
I got a chance to re-enter my code in the right order & re-run it but something is still drastically wrong (with my interpretation no doubt).
I have attached the itf file along with a summary of the strategy & the code written. Underneath the summary, I have given an example trigger of both short & long along with a PNG file showing each example
CP = Current Period / PP = Previous Period.
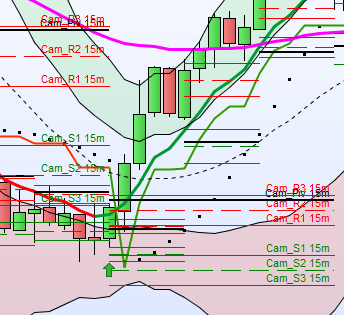
| Long |
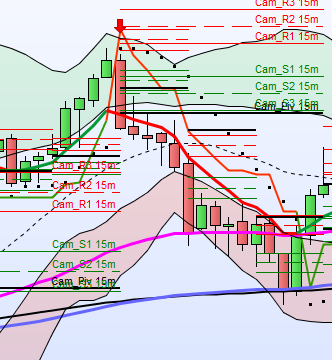
Short |
|
|
| Using 15m [Camarilla Levels] |
Using 15m [Camarilla Levels] |
| Low < S2 (PP) |
High > R2 (PP) |
| Close > R2 (CP) |
Close < S2 (CP) |
|
|
| Using 5m [Camarilla Levels] |
Using 5m [Camarilla Levels] |
| 8ema < [Pivot Point] (PP) |
8ema > [Pivot Point] (PP) |
| 8ema > [Pivot Point] (CP) |
8ema < [Pivot Point] (CP) |
| Close > [R3] (CP) |
Close < [S3] (CP) |
|
|
|
|
| (Default) |
(Default) |
| Close < BB20-2.3 Upper (Boll2) (CP) |
Close < BB20-2.3 Lower (Boll2) (CP) |
| 55ema < 144ema (CP) |
55ema > 144ema (CP) |
| 8ema < 21sma (CP) |
8ema > 21sma (CP) |
| 8ema < 55ema (CP) |
8ema > 55ema (CP) |
| Close < 55ema (CP) |
Close > 55ema (CP) |
| Close < 21sma (CP) |
Close > 21sma (CP) |
|
|
| Exit = Close (CP) < Low (PP) |
Exit= Close (CP) > High (PP) |
|
|
|
|
| US30 26-09-22 1m @ 17:45 |
US30 22-09-22 1m @ 20:15 |
// Definition of code parameters
DEFPARAM CumulateOrders = False // Cumulating positions deactivated

// Conditions to enter long positions
TimeFrame(15 minutes)
indicator1 = Close[1] + (High[1]-Low[1]) * (1.1 / 6)
c1 = (low[1] < indicator1[1])
indicator2 = Close[1] + (High[1]-Low[1]) * (1.1 / 6)
c2 = (close > indicator2)
TimeFrame(5 minutes)
indicator3 = ExponentialAverage[8](close)
indicator4 = (High[1] + Low[1] + Close[1])/3
c3 = (indicator3[1] < indicator4[1])
indicator5 = ExponentialAverage[8](close)
indicator6 = (High[1] + Low[1] + Close[1])/3
c4 = (indicator5 > indicator6)
indicator7 = Close[1] + (High[1]-Low[1]) * (1.1 / 4)
c5 = (close > indicator7)
TimeFrame(Default)
indicator8 = Average[20](close)+2.3*std[20](close)
c6 = (close < indicator8)
indicator9 = ExponentialAverage[55](close)
indicator10 = ExponentialAverage[144](close)
c7 = (indicator9 < indicator10)
indicator11 = ExponentialAverage[8](close)
indicator12 = Average[21](close)
c8 = (indicator11 < indicator12)
indicator13 = ExponentialAverage[8](close)
indicator14 = ExponentialAverage[55](close)
c9 = (indicator13 < indicator14)
indicator15 = ExponentialAverage[55](close)
c10 = (close < indicator15)
indicator16 = Average[21](close)
c11 = (close < indicator16)

IF c1 AND c2 AND c3 AND c4 AND c5 AND c6 AND c7 AND c8 AND c9 AND c10 AND c11 THEN
BUY 1 PERPOINT AT MARKET
ENDIF

// Conditions to exit long positions
c12 = (close < low[1])

IF c12 THEN
SELL AT MARKET
ENDIF

// Conditions to enter short positions
TimeFrame(15 minutes)
indicator17 = Close[1] + (High[1]-Low[1]) * (1.1 / 6)
c13 = (high[1] > indicator17[1])
indicator18 = Close[1] + (High[1]-Low[1]) * (1.1 / 6)
c14 = (close < indicator18)
TimeFrame(5 minutes)
indicator19 = ExponentialAverage[8](close)
indicator20 = (High[1] + Low[1] + Close[1])/3
c15 = (indicator19[1] > indicator20[1])
indicator21 = ExponentialAverage[8](close)
indicator22 = (High[1] + Low[1] + Close[1])/3
c16 = (indicator21 < indicator22)
indicator23 = Close[1] + (High[1]-Low[1]) * (1.1 / 4)
c17 = (close < indicator23)
TimeFrame(Default)
indicator24 = Average[20](close)-2.3*std[20](close)
c18 = (close > indicator24)
indicator25 = ExponentialAverage[55](close)
indicator26 = ExponentialAverage[144](close)
c19 = (indicator25 > indicator26)
indicator27 = ExponentialAverage[8](close)
indicator28 = Average[21](close)
c20 = (indicator27 > indicator28)
indicator29 = ExponentialAverage[8](close)
indicator30 = ExponentialAverage[55](close)
c21 = (indicator29 > indicator30)
indicator31 = ExponentialAverage[55](close)
c22 = (close > indicator31)
indicator32 = Average[21](close)
c23 = (close > indicator32)

IF c13 AND c14 AND c15 AND c16 AND c17 AND c18 AND c19 AND c20 AND c21 AND c22 AND c23 THEN
SELLSHORT 1 PERPOINT AT MARKET
ENDIF

// Conditions to exit short positions
c24 = (close > high[1])

IF c24 THEN
EXITSHORT AT MARKET
ENDIF
Lets see what this uncovers……..
JSParticipant
Veteran
Hi Paulg999
I have time to look at your code again over the weekend…
JSParticipant
Veteran
Hi Paulg999
I see several double indicators (ind1 = ind2, ind3 = ind5, ind4 = ind6, etc.)
It’s not wrong but not necessary and somewhat confusing.
Furthermore, I don’t see any errors in your code…
What goes “dramatically wrong”?
Hi JS,
Apologies for the late reply. I am currently in the middle of a house sale which is proving to be very time consuming. I will get back to you in a few weeks when things have calmed down.