

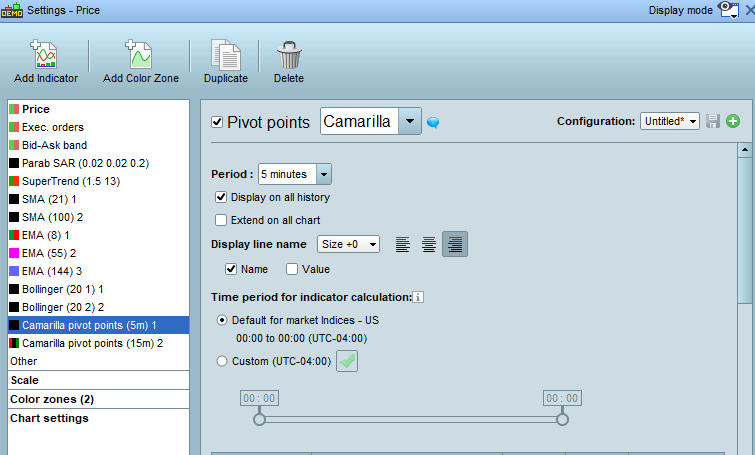
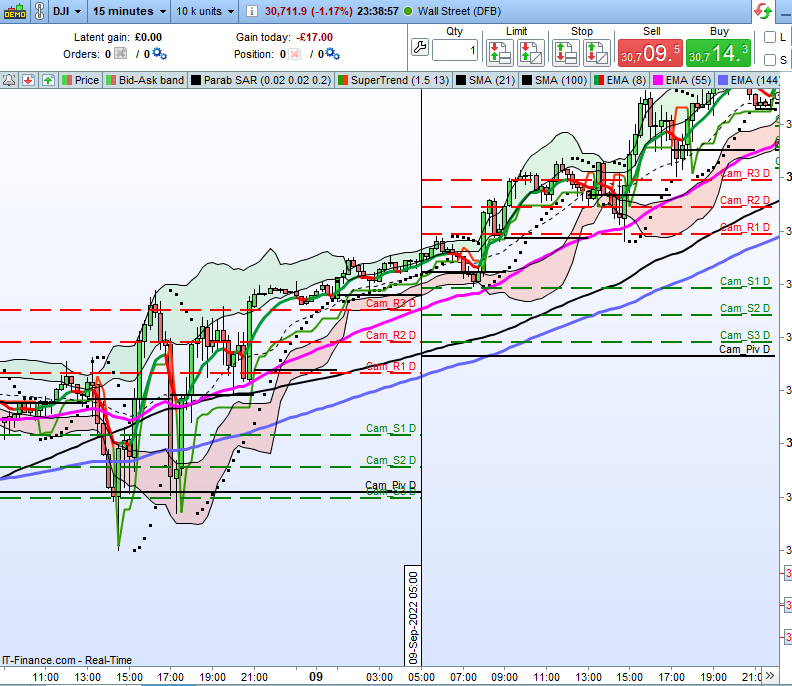
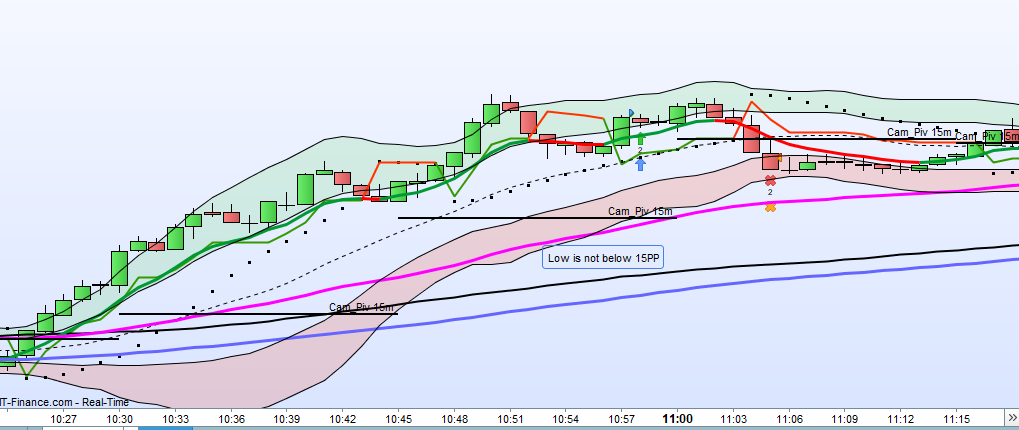
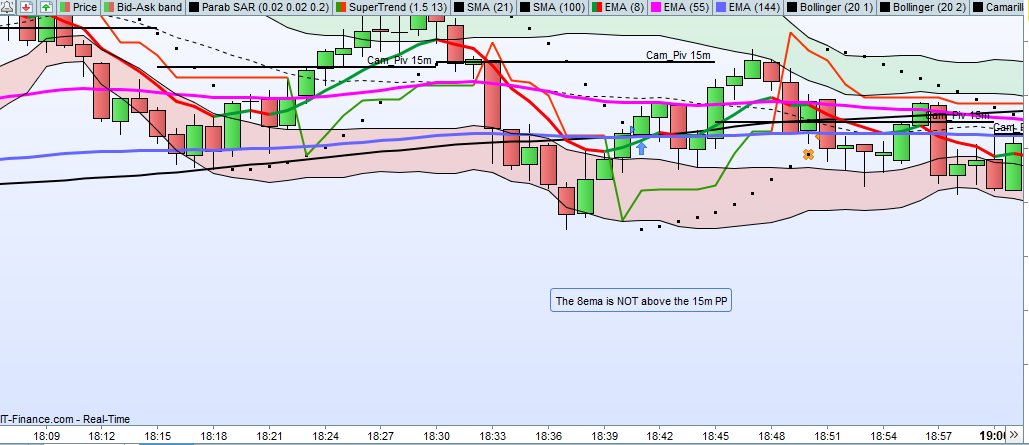
Intra day camarilla Pivots not matching chart display
- You must be logged in to reply to this topic.
New Reply
Summary
This topic contains 23 replies,
has 4 voices, and was last updated by ![]()
3 years, 5 months ago.
Topic Details
| Forum: | ProBuilder: Indicators & Custom Tools |
| Language: | English |
| Started: | 09/21/2022 |
| Status: | Active |
| Attachments: | 12 files |
Loading...