Hi,
Does anyone know if it’s possible to invert our charts from going to the right side to going to the left side? in other words, new candles showing on the left side of the screen instead of showing as usual on the right side?
If it’s not possible here in Pro Real-Time, is there any alternative that might do that?
THesis:
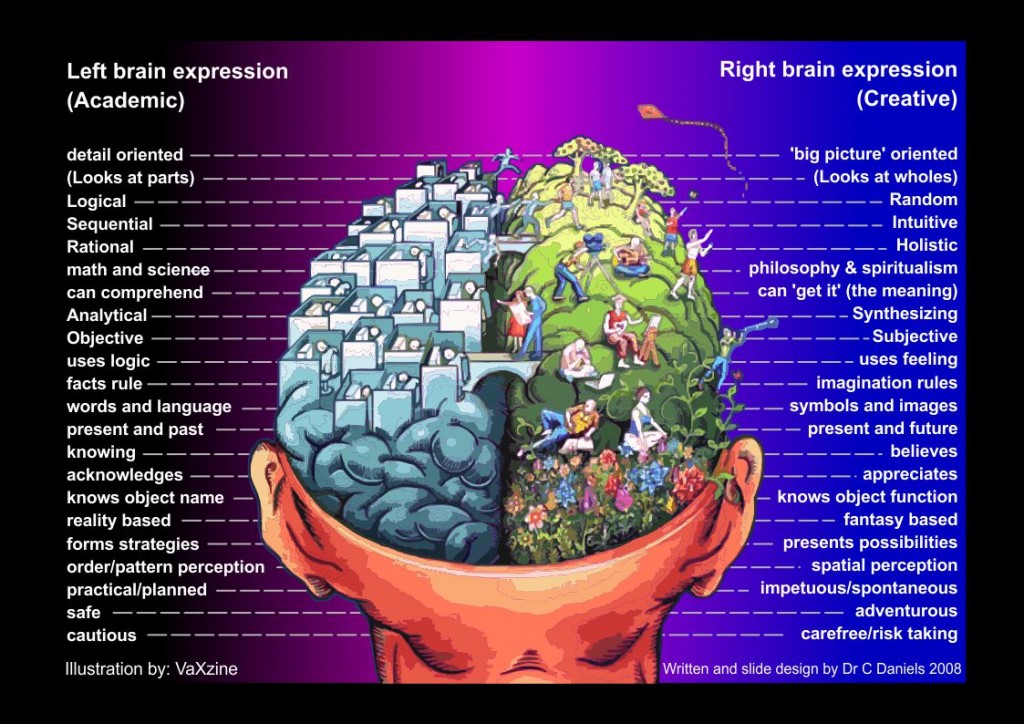
Our logical brain is on the left side, our creative/ emotional is on the right side.
The way we look at things activates more of one side or the other.
price is always on the right side, therefor we might have a tendency to process it more with the right side of the brain.
If the price would be on the left side we might process it more with the left side, therefore activating the logical part.
would be interesting to test this thesis.
thanks
If you want to suggest it direct to PRT … use the Form on the link below.
https://www.prorealtime.com/en/contact?suggestion=1
So that’s why, we, left handed people, are pure genius 😆
yes, we are! 🙂
I have discovered this chrome extension called flip this. at least I can do it in tradingview with this and invert chart, it is just another thing to play with like cutting with scissors lol
I am using now an extension to do it in trading view (plus inverted chart), do you feel that there is a difference in your mental processes? results and so on?
also what you are using to do it?
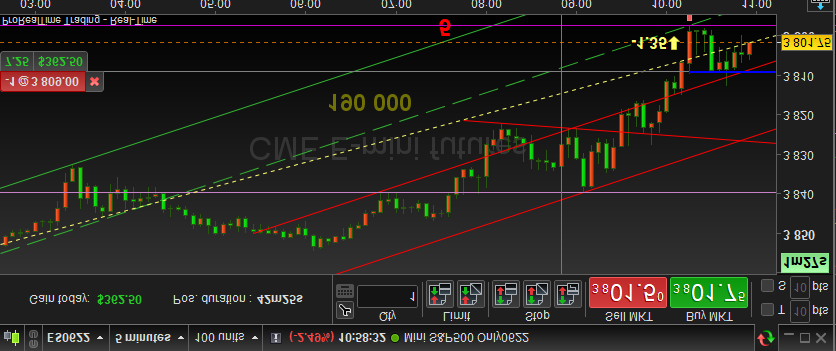
For this example I just “Reversed” the image (not flip, though it may depend on what the tool calls it). But I figured that software (or graphic cards) just can do this.
The “doing it all the time” was just kidding. But it would be very simple to accomplish.
Personally I would not be able to deal with it at all, because your movements (with mouse and such) also need to “reverse”. Additionally I am too much used to dealing with it the normal way, that it would be very hard to get better at it with the brain functions you refer to. At least that is what I think.
I could also attest that we (not from China) do all from left to right. Even if left-handed. 😉
The second version below is special for Shorts. *That* could be really helping for when you’re not used to operate in a negative market (the phenomenon “negative” is just my thinking);
We are used to let things grow. We are also used to let companies grow. We are thus also used to let stock value grow. With a Short you’re not really working on that and my brain finds it hard to cope with that situation. Personally I solve that with Futures because what happens to them I would not care less (if it’s only going my direction – haha).
Yeah, the reverse works well but the main problem, as you found is the mouse, it’s tricky. The first attempt I did was just flipping my screen upside down and then invert upside down (the second example you wrote about)
It’s simple with this chrome extension but still in the trading view you need to cope with some other stuff upside down lol
yeah I get it, the left-handed are quite used to thinking in reverse since when you grow you are using so many things the “wrong way” like scissors, door handles, pens (yeah its a mess with some type of pens), tools in general and a lot of stuff.
If we think that in terms of energy, vibration and frequency, we should be doing stuff both left to right and right to left, ying yang, balance. maybe that contributes to unbalance there is in the world (who knows!)
that second version is interesting for those with mental processes, with positive/negative connotations. here with right-left it’s pretty much the same as that. Not with positive/negative but rather with more emotion or less (keep in mind that people with a high level of control and concentration can operate fully with left-brain always looking from the right side of it). I just find that it might be more natural to think in terms of more rational if price goes to left side.
 JS
JSParticipant
Veteran
@Nicolas
Is there really no way in PRT to flip the close?
Something with the BarIndex… ( X = Close[BarIndex] – Close …)
Indeed you can create an indicator to do that 😉
JSParticipant
Veteran
@Nicolas
I tried it but unfortunately got stuck…
Maybe it will work out with a little help 😉
I didn’t know that was possible! I already made the suggestion to pro real time dev team as well.
If you could pull this one off that would be amazing, I really want to test this Thesis!
Also if you can: point me out in the code where is that section so I can add that section to some indicators as well otherwise price will face left and the rest right, nothing we left handed couldn’t handle lol but if possible we avoid that lol
thank you Nicolas!
JSParticipant
Veteran
@Nicolas
I can calculate the difference between the Close[0] and the Close[BarIndex] but when I try to apply this difference to the Close I get a constant value… (the value where the BarIndex = 0)…
The below code simulates candlesticks with segments (because we can’t plot candlesticks in the past).
Of course you can’t apply indicators on them. In order to plot indicators, it would need custom coding that use the same tricks (do a loop from current candle to plot things in the past with indicators values).
defparam drawonlastbaronly=true

if islastbarupdate then
for i = 0 to barindex do
 offset = max(0,barindex-i)
 green=open[i]<close[i]
 red=open[i]>close[i]
 r=255
 g=0
 if green then
  r=0
  g=255
 endif
 drawsegment(barindex[offset],open[i],barindex[offset],close[i]) coloured(r,g,0)
 drawsegment(barindex[offset],high[i],barindex[offset],max(open[i],close[i]))
 drawsegment(barindex[offset],low[i],barindex[offset],min(open[i],close[i]))
next
endif

return