Hallo zusammen!!!!
Programmierung Indikator.. Wie programmiere ich das der aktulle kur Von der Fibonacci 61.80 Entfernung in prozent als Histogramm mir anzeigt wird. Da sich der kurs ständig ändert soll immer aktuell immer angezeigt werden.
<span style=”vertical-align: inherit;”><span style=”vertical-align: inherit;”>defparam drawonlastbaronly=true</span></span>
<span style=”vertical-align: inherit;”><span style=”vertical-align: inherit;”>Abziehbild=4</span></span>
<span style=”vertical-align: inherit;”><span style=”vertical-align: inherit;”>Punkt1=Durchschnitt[21] (nah) </span></span>
<span style=”vertical-align: inherit;”><span style=”vertical-align: inherit;”>Punkt2=BollingerDown[610](nah)</span></span>
<span style=”vertical-align: inherit;”><span style=”vertical-align: inherit;”>Abstand=Punkt1-Punkt2</span></span>
<span style=”vertical-align: inherit;”><span style=”vertical-align: inherit;”>if islastbarupdate then </span></span>
<span style=”vertical-align: inherit;”><span style=”vertical-align: inherit;”>//61.80% line </span></span>
<span style=”vertical-align: inherit;”><span style=”vertical-align: inherit;”>DRAWTEXT(“61.80%”, barindex+5, Point2+Distance*0.618+Decalage*PointSize) </span></span>
<span style=”vertical-align: inherit;”><span style=”vertical-align: inherit;”>DRAWRAY(barindex, Point2+Distance*0.618, barindex+1, Point2+Distance*0.618) STYLE (GEPUNKTETE LINIE,1)</span></span>
<span style=”vertical-align: inherit;”><span style=”vertical-align: inherit;”>endif</span></span>
<span style=”vertical-align: inherit;”><span style=”vertical-align: inherit;”>zurückkehren</span></span>
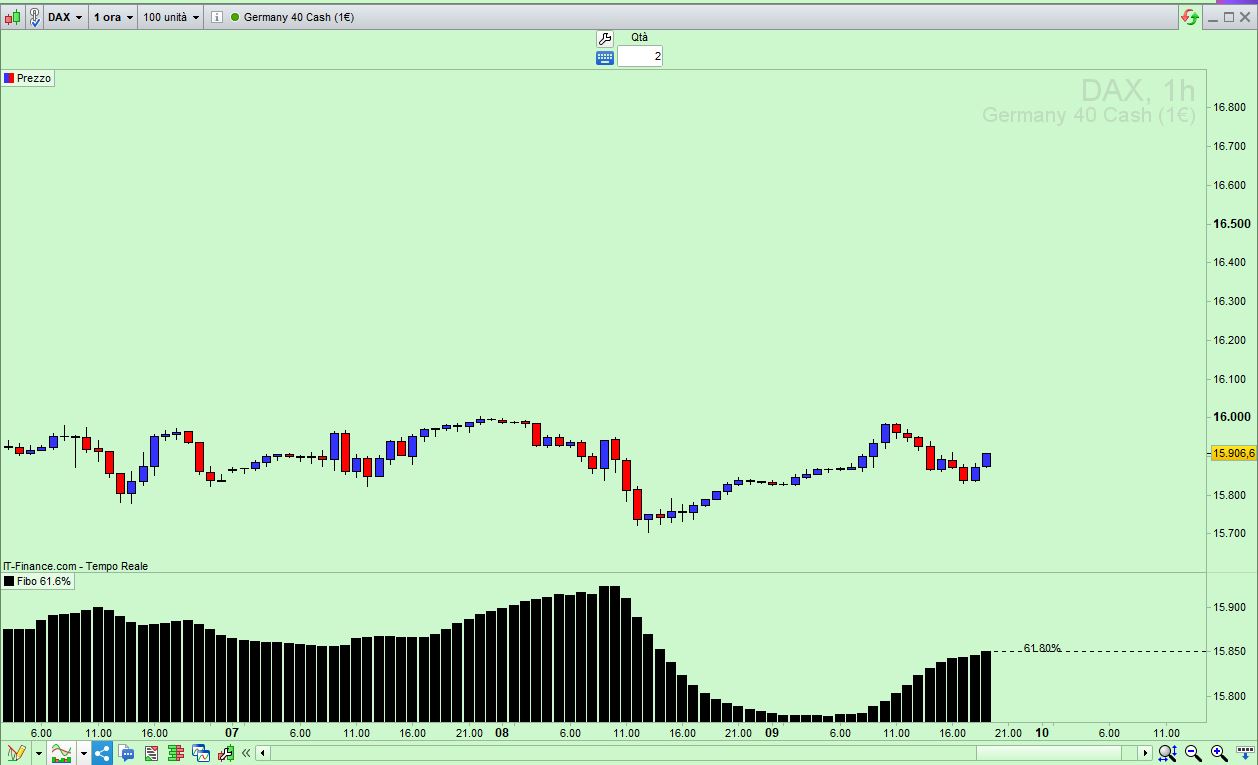
<span style=”vertical-align: inherit;”><span style=”vertical-align: inherit;”>Ich möchte, dass der aktuelle Kurs bis 61,80 % im Abstand in Prozent als Histogramm angezeigt wird.</span></span>
Würde es Ihnen etwas ausmachen, den Code noch einmal als Text zu veröffentlichen?
defparam drawonlastbaronly=true
Decalage=4
Point1=average[21] (close)
point2=BollingerDown[21](close)
Distance=Point1-Point2
if islastbarupdate then
//61.80% line
DRAWTEXT(“61.80%”, barindex+5, Point2+Distance*0.618+Decalage*PointSize)
DRAWRAY(barindex, Point2+Distance*0.618, barindex+1, Point2+Distance*0.618) STYLE(DOTTEDLINE,1)”
Return
Ist es das was du meinst?
defparam drawonlastbaronly=true
Decalage=4
Point1=average[21] (close)
point2=BollingerDown[21](close)
Distance=Point1-Point2
//if islastbarupdate then
//61.80% line
DRAWTEXT("61.80%", barindex+5, Point2+Distance*0.618+Decalage*PointSize)
DRAWRAY(barindex, Point2+Distance*0.618, barindex+1, Point2+Distance*0.618) STYLE(DOTTEDLINE,1)
//endif
Return Point2+Distance*0.618 style(Histogram) AS "Fibo 61.8%"
danke Roberto !! Aber ich meinte vom aktuell Kurs bis zur 61.8% fibo die Entfernung in Prozent Angabe.
Beispiel
aktueller Kurs von immer 61.80 sind 1.25% oder 0.51 er sollte mir in Prozent die Entfernung vom aktuellen Kurs.
ich hoffe das war verständlich gruss dogan
Was sind 1,25 % und 0,51?
Der Abstand zwischen kurs und fibo 61.80% in prozent Angabe
Vollendet:
defparam drawonlastbaronly=true
Decalage=4
Point1=average[21] (close)
point2=BollingerDown[21](close)
Distance=Point1-Point2
//if islastbarupdate then
//61.80% line
DRAWTEXT("61.80%", barindex+5, Point2+Distance*0.618+Decalage*PointSize)
DRAWRAY(barindex, Point2+Distance*0.618, barindex+1, Point2+Distance*0.618) STYLE(DOTTEDLINE,1)
//endif
Diff    = close-(Point2+Distance*0.618)
PerCent = Diff * 100 / close
//Return close-(Point2+Distance*0.618) style(Histogram) AS "difference from Fibo 61.8%"
Return PerCent style(Histogram) AS "difference from Fibo 61.8%"
Hallo Roberto
beim probacktest wie schreiben ich das Programmierte
defparam drawonlastbaronly=true
Decalage=4
Point1=average[21] (close)
point2=BollingerDown[21](close)
Distance=Point1-Point2
//if islastbarupdate then
//61.80% line
DRAWTEXT(“61.80%”, barindex+5, Point2+Distance*0.618+Decalage*PointSize)
DRAWRAY(barindex, Point2+Distance*0.618, barindex+1, Point2+Distance*0.618) STYLE(DOTTEDLINE,1)
//endif
Diff = close-(Point2+Distance*0.618)
PerCent = Diff * 100 / close
//Return close-(Point2+Distance*0.618) style(Histogram) AS “difference from Fibo 61.8%”
Return PerCent style(Histogram) AS “difference from Fibo 61.8%”
ich das denn Kaufe wenn der wert Gösser als ist 0 oder kleiner. Könne Sie mir ein Beispiel geben.
Hab vielen dank gruss dogan
so was
VAl=call"Indicateur"

if val>0 then
buy 1 contract at market
endif
Hallo Reboto!!!
code:
a=CALL “fibo 34 55”
b=CALL “Fibo 34/ 21”
c=CALL “fibo 89 144”
D=CALL “fibo 233”
I=0
Diff = close-(a )
PerCent = Diff * 100 / close
//Return close-(Point2+Distance*0.618) style(Histogram) AS “difference from Fibo 61.8%”
Diff1 = close-(b )
PerCent1 = Diff1 * 100 / close
//Return close-(Point2+Distance*0.618) style(Histogram) AS “difference from Fibo 61.8%”
Diff2 = close-(c )
PerCent3 = Diff2 * 100 / close
//Return close-(Point2+Distance*0.618) style(Histogram) AS “difference from Fibo 61.8%”
Diff3 = close-(d )
PerCent4= Diff3 * 100 / close
//Return close-(Point2+Distance*0.618) style(Histogram) AS “difference from Fibo 61.8%”
Return PerCent ,percent2, percent3, percent4,style(line) AS “difference from Fibo 61.8%”, I as “zero”
Wie kann ich das machen das Percent 1 2 3 4 ein wert ergibt oder a,b,c,d zusammen addieren und ein wert. ich habe so wie grade es ist 4 linen möchte das zu 1 wert.
gruss dogan
Indikator
I=0

Diff = close-(a )
PerCent = Diff * 100 / close
//Return close-(Point2+Distance*0.618) style(Histogram) AS "difference from Fibo 61.8%"

Diff1 = close-(b )
PerCent1 = Diff1 * 100 / close
//Return close-(Point2+Distance*0.618) style(Histogram) AS "difference from Fibo 61.8%"
Diff2 = close-(c )
PerCent3 = Diff2 * 100 / close
//Return close-(Point2+Distance*0.618) style(Histogram) AS "difference from Fibo 61.8%"
Diff3 = close-(d )
PerCent4= Diff3 * 100 / close
//Return close-(Point2+Distance*0.618) style(Histogram) AS "difference from Fibo 61.8%"
Return PerCent ,percent2, percent3, percent4 AS "difference from Fibo 61.8%", I as "zero"
Algorithmus
PerCent,percent2, percent3, percent4,I=call"Indikator"