


Indicator with conditional formated histogram

Viewing 3 posts - 1 through 3 (of 3 total)
  • Author
    Posts
  • #16562 quote
    XerxesXerxes
    Participant
    New

    Good morning,

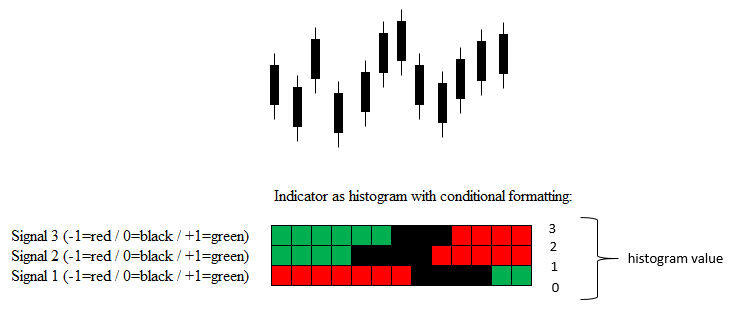
    is there a possibility to get an Indicator as a histogram where several signals have different colours according to there value.

    Thanks in advance!

    histogram.png histogram.png
    #16572 quote
    NicolasNicolas
    Keymaster
    Legend

    Yes you need to make 3 different variables with their own color and value.

    Someone did something like this, not so long ago, this is called a “tape” indicator. You can find an example here:  http://www.prorealcode.com/prorealtime-indicators/3-linear-regression-tapes-indicator/

    #16582 quote
    XerxesXerxes
    Participant
    New

    Thank you very much Nicolas,

    unfortunately the command “coloured by” does not work properly for me. The indicator gets calculated but the different colours for positive or negative values are not working if there are more then one output variables (I am using v10.2).

    However here is a solution that works for me. Not nice but who cares 😉

    In this “dummy” example on the top level every second bar will be green every forth bar will be red and the rest will be black. On the bottom level every third bar will be green every sixth bar will be red and the rest will be black.

    // Set each output variable to be shown as histogram
    // Set the correct colour for each output variable (Lev1Black="black", Lev1Green="green"...)
    iBar=IntradayBarIndex
    Lev1Black=0
    Lev1Green=0
    Lev1Red=0
    Level=5
    if (ibar MOD 2 =0) and (ibar mod 4 <>0) then
    Lev1Green=Level
    elsif  ibar MOD 4 =0 then
    Lev1Red=Level
    else
    Lev1Black=Level
    endif
    
    Lev2Black=0
    Lev2Green=0
    Lev2Red=0
    Level=2.5
    if (ibar MOD 3 =0) and (ibar mod 6 <>0) then
    Lev2Green=Level
    elsif  ibar MOD 6 =0 then
    Lev2Red=Level
    else
    Lev2Black=Level
    endif
    return 0 as "Zero",Lev1Black  as "Level-1 (black)",Lev1Green as "Level-1 (green)",Lev1Red as "Level-1 (red)",Lev2Black  as "Level-2 (black)",Lev2Green as "Level-2 (green)",Lev2Red as "Level-2 (red)"
    histogram-1.png histogram-1.png
Viewing 3 posts - 1 through 3 (of 3 total)

  • You must be logged in to reply to this topic.

ProRealAI ProRealAI New

Stuck on this ProBuilder code?

Describe what this topic is trying to build, in plain English, and ProRealAI writes the ProRealTime™ indicator, screener or system for you.

Available in 7 languages
Try ProRealAI

Indicator with conditional formated histogram


ProBuilder: Indicators & Custom Tools

New Reply
Author
author-avatar
Xerxes @xerxes Participant
Summary

This topic contains 2 replies,
has 2 voices, and was last updated by XerxesXerxes

9 years, 10 months ago.

Topic Details
Forum: ProBuilder: Indicators & Custom Tools
Language: English
Started: 11/15/2016
Status: Active
Attachments: No files
ProRealCode ProRealCode
Loading...


