Hello,
I need help with an indicator I created. It shows me the high , low, and close of the prio day in my today intraday chart. Nothing special and it works right so far.
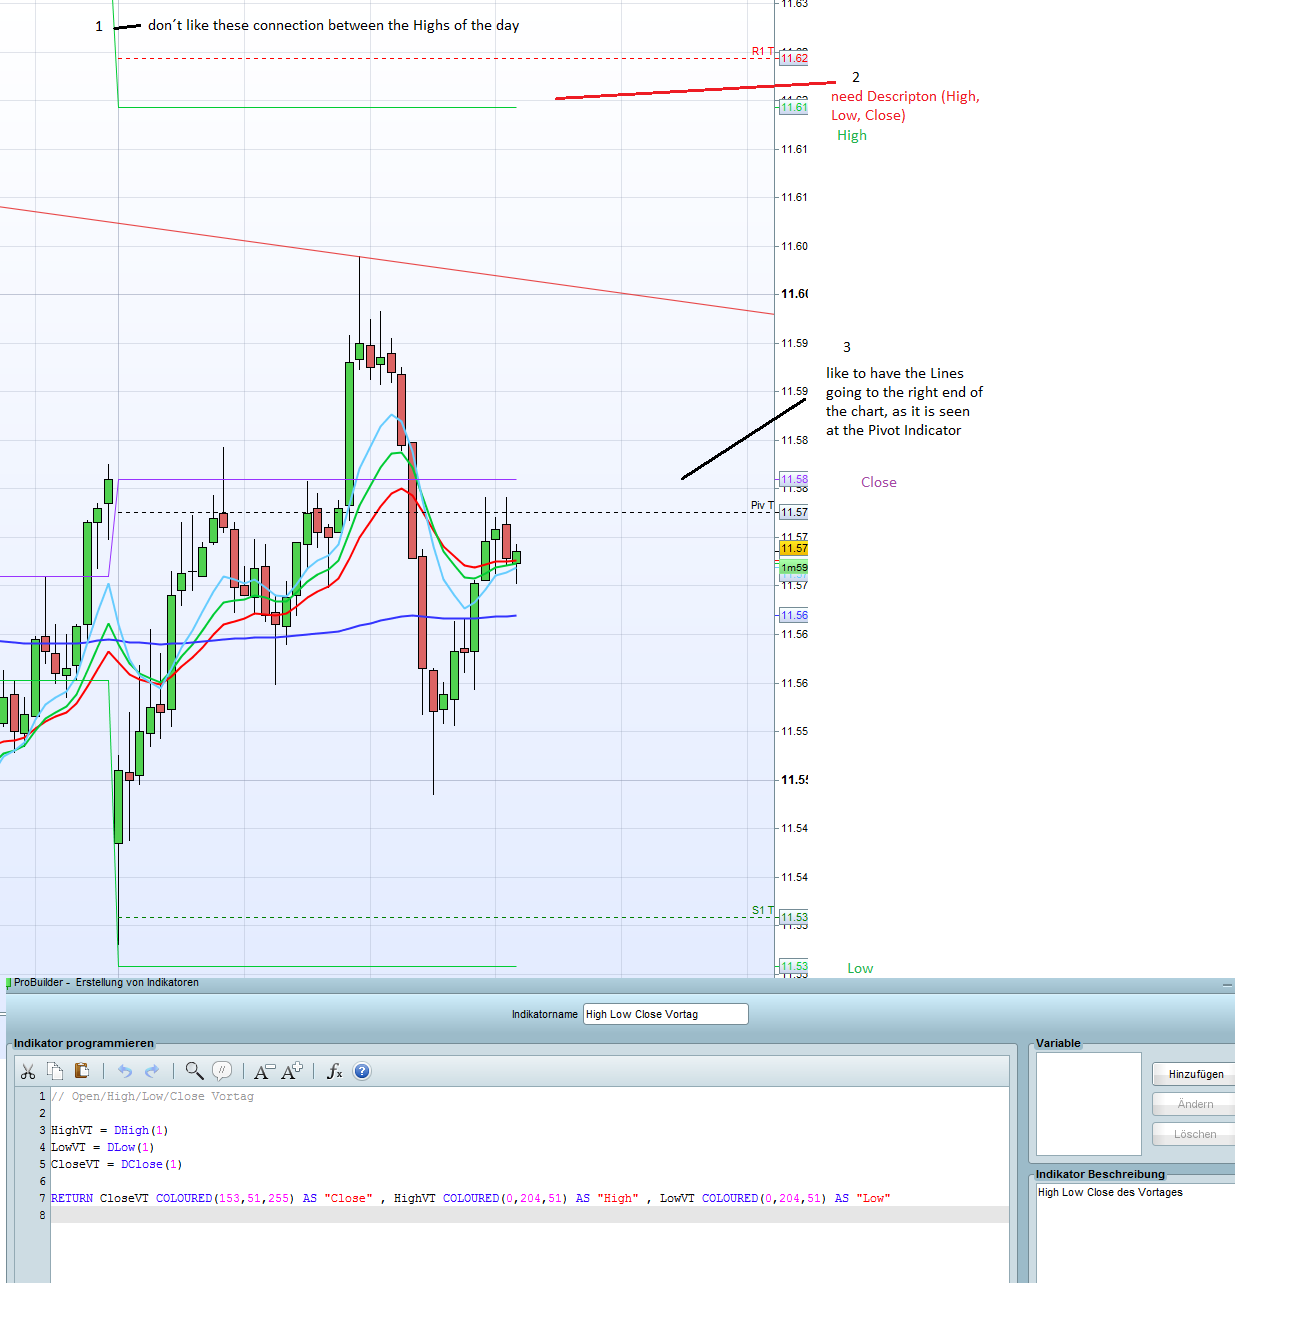
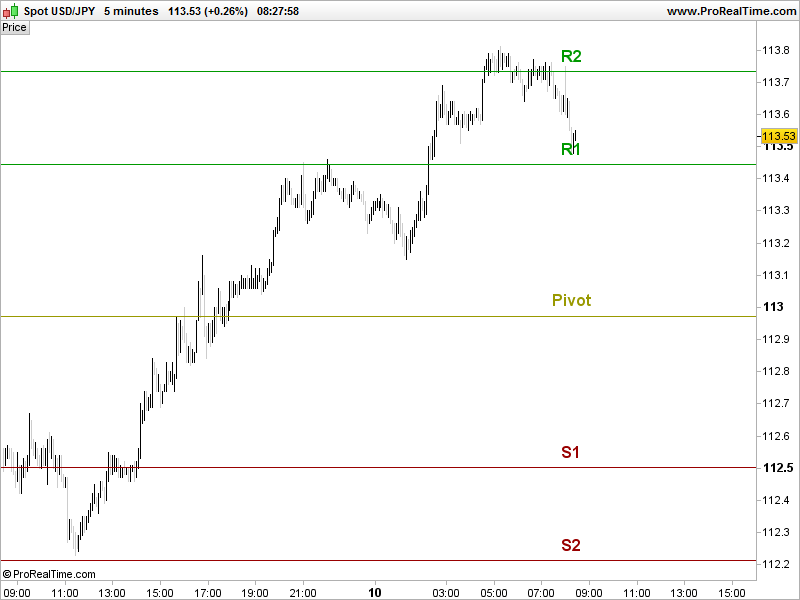
I like to optimize the following points, but don´t know commands for this. To say it in easy words: it has to look like the Pivot points indicator, which is already in PRT, but where I can´t take a look at the code, to see how it is managed there:
- don´t like the connection lines between the highs etc, with the day before
- need description high etc at the right side of the chart (as it is seen in the Pivot indicator)
- like to have the lines going through to the right end of the chart (also look at the pivot indicator)
Maybe someone can help me. It seems to be very simple, but I´m just right new in creating indicators and stockscreeners in PRT, but it works good so far 😉
Thanks a lot.
Ringo
I used to make something similar in the documentation example of the DRAWLINE instruction about the Fibonacci pivot points drawing. In this example, lines are drawn accordingly to the Fibo pivot points calculation and names of retrace levels are written at the very last candlestick.
If you only want to draw a line than begin on the first bar of the day you should use the DRAWSEGMENT instruction instead, but in this case, the segment will not continue to the right side of the chart (after price)..
Thanks a lot for help. I guess the draw function does only works with PRT 10.3 and is not possivle in V 10.2?
Is it possible in 10.2, that the indicator only shows results for the last day in the chart of the current day?
Maybe with a restriction to plot only the result of the day(1) in day(o)?
So I just want to see the High/low/close of the previous day plotted in the chart of the current day. Don´t want to see the results of the past days. Hope I explained in an understanding way 😉
Yes it’s possible, please provide your code to see what can be done.
Code is in the screenshot above, but here it is again.
Thanks for help.
// Open/High/Low/Close Vortag

HighVT = DHigh(1)
LowVT = DLow(1)
CloseVT = DClose(1)

RETURN CloseVT COLOURED(153,51,255) AS "Close" , HighVT COLOURED(0,204,51) AS "High" , LowVT COLOURED(0,204,51) AS "Low"
If the Date of history is not the current one, then variables must be set to ‘undefined’:
// Open/High/Low/Close Vortag

if date=today then
HighVT = DHigh(1)
LowVT = DLow(1)
CloseVT = DClose(1)
else
HighVT = undefined
LowVT = undefined
CloseVT = undefined
endif

RETURN CloseVT COLOURED(153,51,255) AS "Close" , HighVT COLOURED(0,204,51) AS "High" , LowVT COLOURED(0,204,51) AS "Low"
That way, lines are only visible on the current day, not all the previous ones of past history. Hope it helps.
That is exactly what I need, thanks a lot for help.
Hello,
the indicator above worked fine the last weeks until IG updated to 10.3 yesterday. Since that it does not give the results I want.
I restricted the session time for the Dax 30 Kassa (CFD Indication) from 09:00-17:30 German Time.
And before the update the indicator shows me the 17:30 Close and High and Low over this period.
After the update to 10.3 the indicator does not care about my restricted session time. For example: Close is the Daily Close 00:00 / High and Low over the full (also overnight) session.
Is it possible to adjust this in the code?
In the standard Pivot Points indicator for example I saw, that one can adjust the time period for the indicator in the Indicator settings now.
Indicator Code see above in Nicolas post.
Thanks for help
Do yuo guys have an indicator plotting monthly high lows for undefined period a time, or how to change some existing indicator?
 Bel
BelParticipant
Veteran
Also would be interesting to see weekly, monthly, quarterly and yearly open levels on chart:)
Hi,
Is it possible to customize this code to show the Previous Week’s High and Low on the Daily chart?
Thank you very much.
Jitan