


Indicator Matrix Series From Pinescript to Pro real time

Viewing 4 posts - 1 through 4 (of 4 total)

  • Author
    Posts
  • #213255 quote
    GianlucaGianluca
    Participant
    Master

    Hi i tried to translate an indicator from Pinescript to ProBuilder, I think i mixed up something :p anyone wants to help?


    Here the original code in pinescript

    study("Matrix Series",shorttitle="MS",precision=1)
    Smoother=input(5)
    nn = Smoother
    //--Sup/Res Detail
    SupResPeriod = input(50)
    SupResPercentage =input(100)
    PricePeriod = input(16)
    ob = input(200,title="Overbought")
    os = input(-200,title="Oversold")
    OBOS= input(type=bool,defval=false,title="Show OB/OS") 
    dynamic=input(true,title="Dynamic zones")
    ys1 = ( high + low + close * 2 ) / 4
    rk3 = ema( ys1, nn )
    rk4 = stdev(ys1, nn)
    rk5 = (ys1 - rk3 ) * 200 / rk4
    rk6 = ema( rk5, nn )
    up = ema(rk6, nn )
    down = ema( up, nn )
    Oo = iff( up < down, up, down )
    Hh = Oo
    Ll = iff( up < down, down, up )
    Cc = Ll
    vcolor= Oo > Cc ? red : up > down? green:red 
    
    plotcandle(Oo,Hh,Ll,Cc,color=vcolor)
    
    
    //-------S/R Zones------
    Lookback = SupResPeriod
    PerCent = SupResPercentage
    Pds = PricePeriod
    
    C3 = cci(close,Pds )
    
    Osc = C3
    Value1 = Osc
    Value2 = highest( Value1, Lookback )
    Value3 = lowest( Value1, Lookback )
    Value4 = Value2 - Value3
    Value5 = Value4 * ( PerCent / 100 )
    ResistanceLine = Value3 + Value5
    SupportLine = Value2 - Value5
    plot(dynamic?ResistanceLine:na,color=green,transp=0)
    plot(dynamic?SupportLine:na,color=red,transp=0)
    
    //--Overbought/Oversold/Warning Detail
    UPshape = up > ob and up>down ? highest(up,1) + 20:up > ob and up<down?highest(down,1) + 20:na
    DOWNshape = down < os and up>down ? lowest(down,1) - 20:down < os and up<down?lowest(up,1) - 20 :na
    plot(UPshape,style=cross,color=aqua,linewidth=2,transp=0)
    plot(DOWNshape,style=cross,color=aqua,linewidth=2,transp=0)
    x1=OBOS?ob:false
    x2=OBOS?os:false
    hline(x1)
    hline(x2)
    //http://www.wisestocktrader.com/indicators/2739-flower-indicator
    

    and here my translation :p

    // Conversion from Pine Script 
    
    Smoother = 5
    nn = easier
    
    // Details Sup/Res
    SupResPeriod = 50
    SupResPercentage = 100
    PricePeriod = 16
    ob = 200
    os = -200
    OBOS = 0
    dynamic = 1
    ys1 = (high + low + close * 2) / 4
    rk3 = ExponentialAverage[nn](ys1)
    rk4 = std[nn](ys1)
    rk5 = (ys1 - rk3) * 200 / rk4
    rk6 = ExponentialAverage[nn](rk5)
    su = ExponentialAverage[nn](rk6)
    down = ExponentialAverage[nn](on)
    
    If up < down then
    Oo = on
    Ll = down
    elsif up > down then
    Oo = below
    Ll = on
    endif
    Hh = Oo
    Cc = Ll


    // Support and resistance zones
    Lookback = SupResPeriod
    Percentage = SupResPercentage
    Pds = PricePeriod
    
    C3 = CCI[PricePeriod](close)
    
    Osc = C3
    Value1 = Osc
    Value2 = highest[Lookback](Value1)
    Value3 = Lowest[Lookback](Value1)
    Value4 = Value2 - Value3
    Value5 = Value4 * (percentage / 100)
    ResistanceLine = value 3 + value 5
    SupportLine = Value2 - Value5
    
    If up > ob E up > down then
    UPshape = Maximum[1](up) + 20
    elsif up > ob and up < down then
    UPshape = highest[1](down) + 20
    other
    UPforma = -1
    endif
    
    If down < os And up > down then
    DOWNforma = lowest[1](down) - 20
    elsif down < os And up < down then
    DOWNforma = lowest[1](up) - 20
    other
    DOWNform = -1
    endif
    
    If OBOS then
    x1 = ob
    other
    x1 = -1
    endif
    
    If OBOS then
    x2 = os
    other
    x2 = -1
    endif


    // Draw support and resistance lines if 'dynamic' is true
    IF dynamic THEN
    DRAWLINE(barindex, ResistanceLine, barindex, ResistanceLine) COLOURED(0, 255, 0)
    DRAWLINE(barindex, SupportLine, barindex, SupportLine) COLOURED(255, 0, 0)
    ENDIF
    
    // Draw ob/os lines if 'OBOS' is true
    IF OBOS THEN
    DRAWLINE(barindex, x1, barindex, x1) COLOURED(0, 0, 0, 50)
    DRAWLINE(barindex, x2, barindex, x2) COLOURED(0, 0, 0, 50)
    ENDIF
    
    // Draw an "X" above the overbought zone if 'UPshape' is different from -1
    IF UPshape <> -1 THEN
    DRAWTEXT("X", barindex[1], UPshape) COLOURED(0, 255, 255, 0) // Add barindex[1] to correctly position the "X"
    ENDIF
    
    // Draw an "X" under the oversold if 'DOWNshape' is different from -1
    IF DOWNshape <> -1 THEN
    DRAWTEXT("X", barindex[1], DOWNshape) COLOURED(0, 255, 255, 0) // Add barindex[1] to correctly position the "X"
    ENDIF
    // Use this row to return candles and color
    RETURN Oo AS "Oo", Hh AS "Hh", Ll AS "Ll", Cc AS "Cc"


    #213256 quote
    GianlucaGianluca
    Participant
    Master

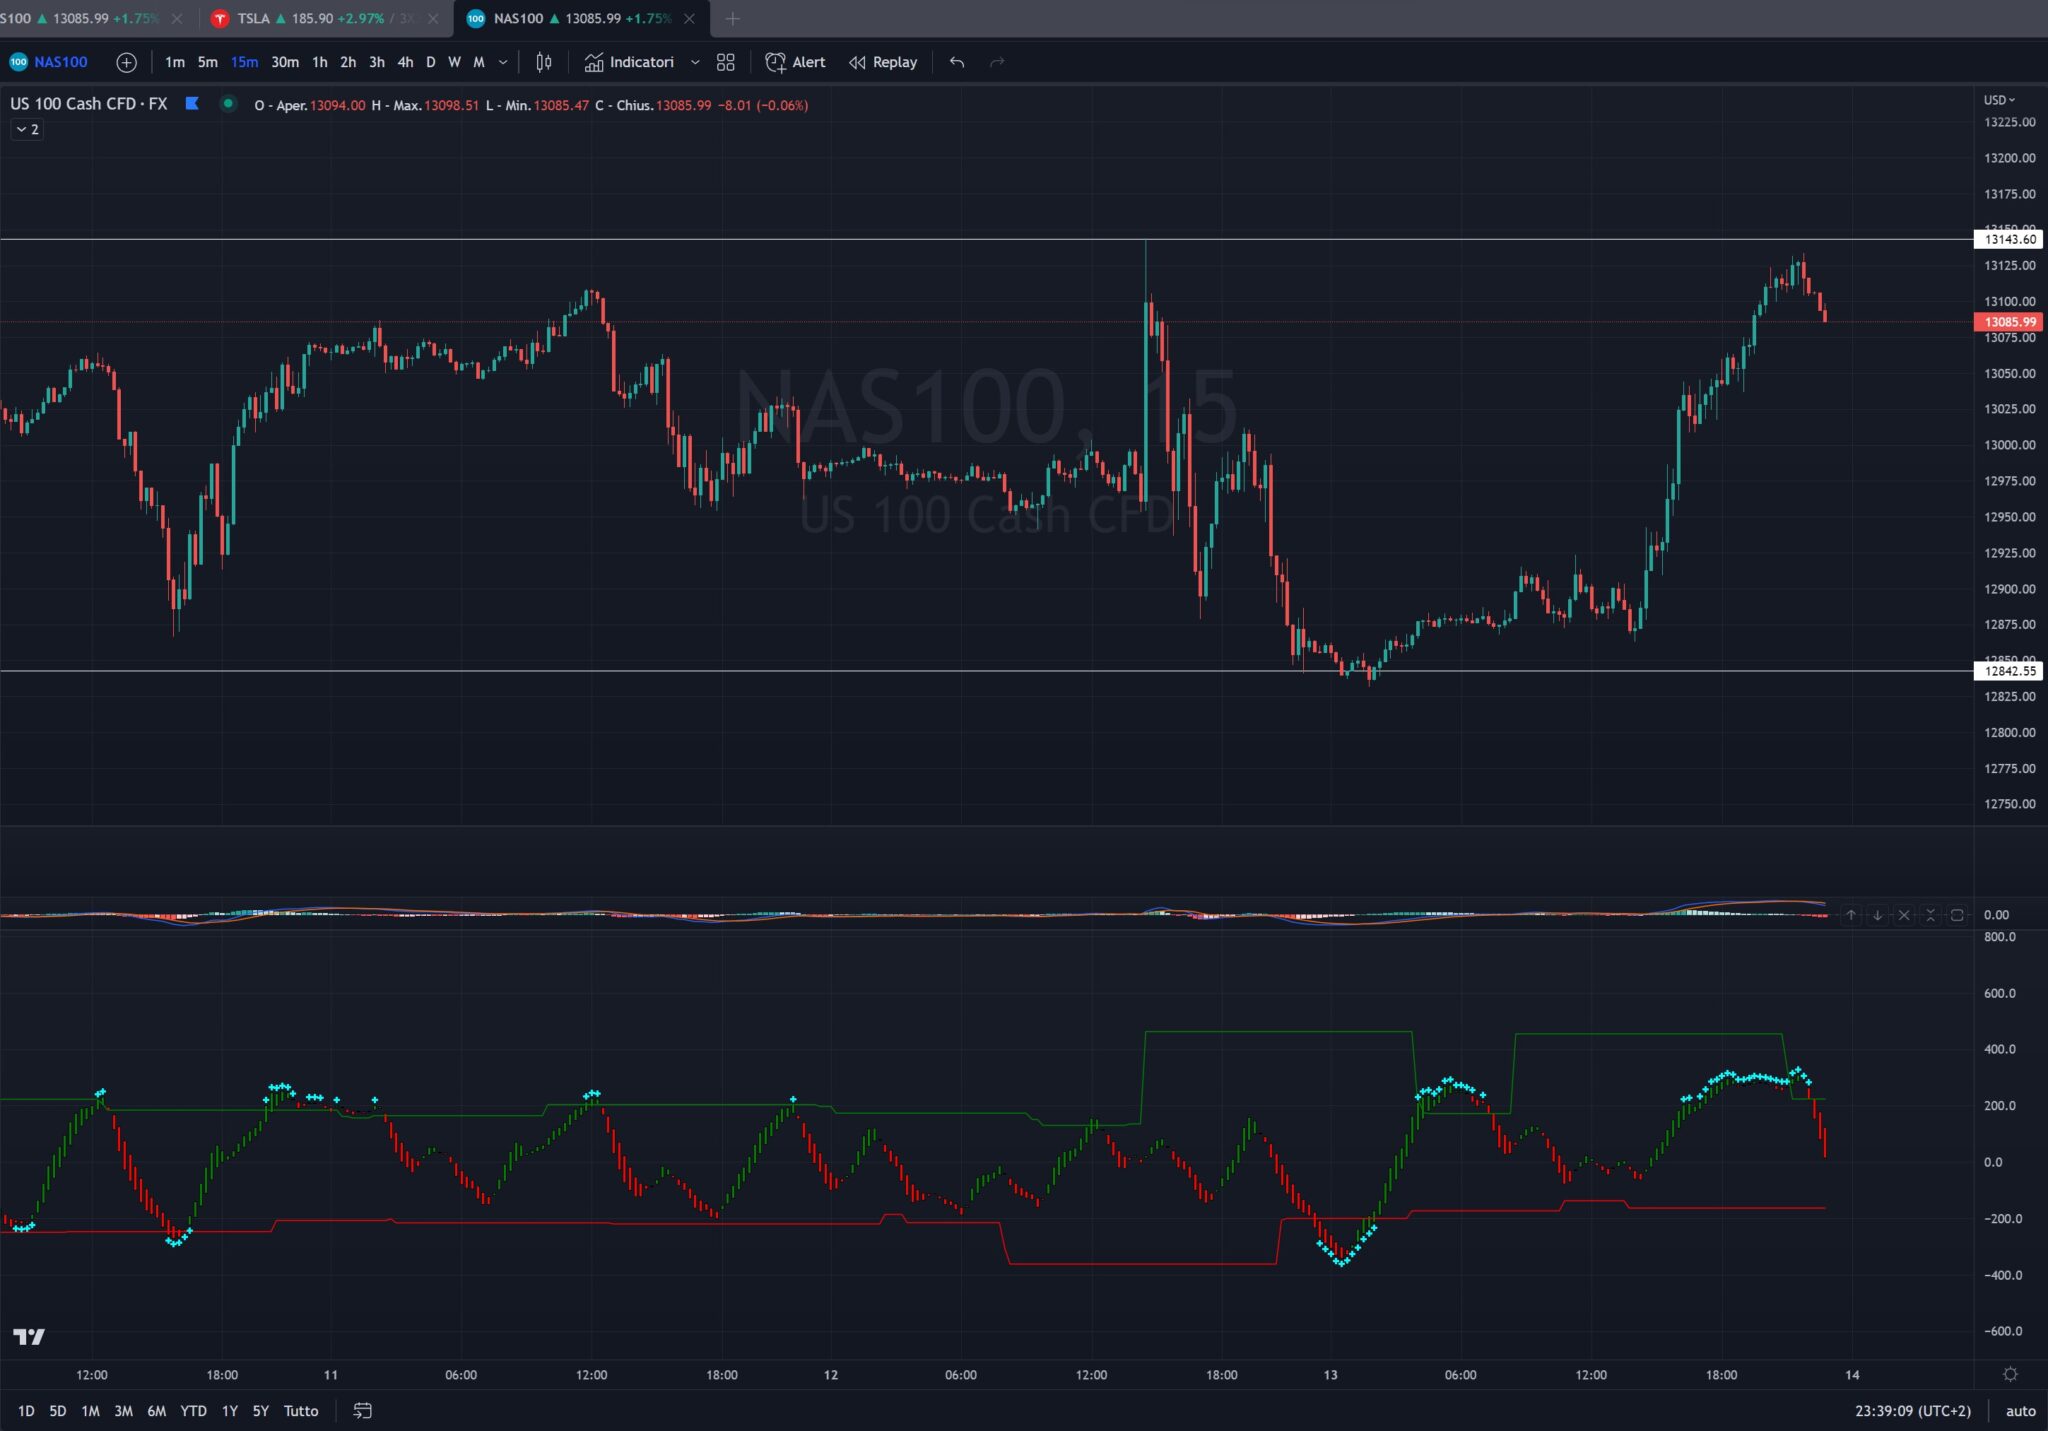
    here also an example of the indicator

    Immagine-2023-04-13-233938.jpg Immagine-2023-04-13-233938.jpg
    #213275 quote
    NicolasNicolas
    Keymaster
    Legend

    Matrix Series indicator is available here since 2016: https://www.prorealcode.com/prorealtime-indicators/matrix-series-flower-indicator/

    Thanks for posting conversion tryout, I’m sure you enjoyed doing this! Don’t hesitate to post more and help others asking for code conversion 😉

    Gianluca thanked this post
    #213284 quote
    robertogozzirobertogozzi
    Moderator
    Legend

    @Gianluca

    Do not embed documents and/or pictures in your text, or the loading of the pages will slow down. Use only “Select File” to attach them, instead. Thank you 🙂

Viewing 4 posts - 1 through 4 (of 4 total)
  • You must be logged in to reply to this topic.

ProRealAI ProRealAI New

Stuck on this ProBuilder code?

Describe what this topic is trying to build, in plain English, and ProRealAI writes the ProRealTime™ indicator, screener or system for you.

Available in 7 languages
Try ProRealAI

Indicator Matrix Series From Pinescript to Pro real time


ProBuilder: Indicators & Custom Tools

New Reply
Author
author-avatar
Gianluca @altares Participant
Summary

This topic contains 3 replies,
has 3 voices, and was last updated by robertogozzirobertogozzi
3 years, 5 months ago.

Topic Details
Forum: ProBuilder: Indicators & Custom Tools
Language: English
Started: 04/13/2023
Status: Active
Attachments: 1 files
ProRealCode ProRealCode
Loading...


