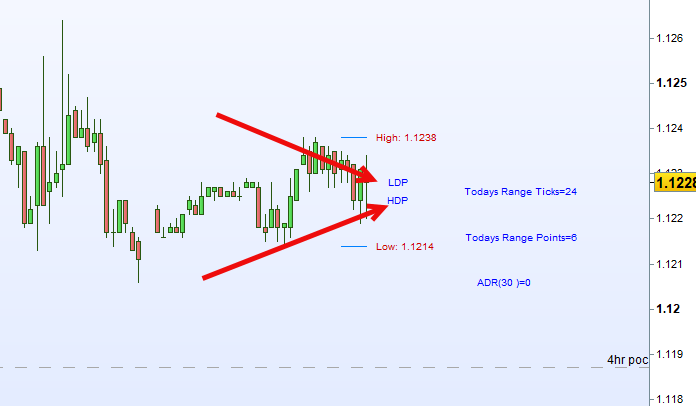
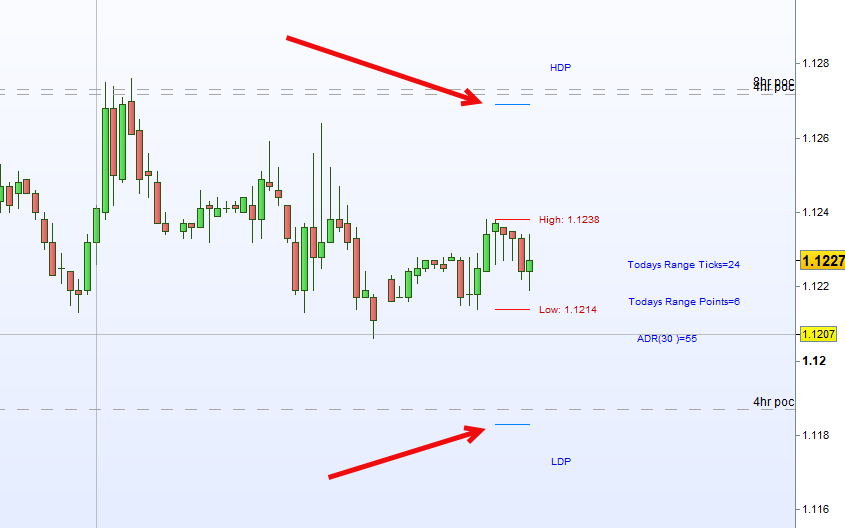
You can see in the screenshots. On the hourly or above, my daily ADR projection works.
but when I move to the 30 minutes chart, it says the ADR is zero.
Anyone know why?
//Grantx ADR

defparam drawonlastbaronly=true

//--- settings
ADRperiod = 30
//--- end of settings

DayRngeSum = 0
FOR a = 0 to ADRperiod DO
DayRngeSum = DayRngeSum + (DHigh(a) - DLow(a))
NEXT
adr = DayRngeSum / ADRperiod

//vertical offset to draw text correctly over horizontal lines
if(ticksize=1) THEN //Dow
//Voffset = 15*ticksize
Voffset2 = 100*ticksize
multiplier = 1
TodayRange = dhigh(0)- dlow(0)
TodayRangePoints = TodayRange
MidRange = dhigh(0) - ((dhigh(0)- dlow(0)) / 2)
adr = Round(adr * multiplier)

ELSIF(ticksize=0.0001) THEN //Euro
//Voffset = 3*ticksize
Voffset2 = 10*ticksize
multiplier = 10000
TodayRange = (dhigh(0)- dlow(0))*multiplier
TodayRangePoints = TodayRange/4
MidRange = dhigh(0) - ((dhigh(0)- dlow(0)) / 2)
adr = Round(adr * multiplier)

ELSIF(ticksize=0.1) THEN //Gold
//Voffset = 1*ticksize
Voffset2 = 25*ticksize
multiplier = 10
TodayRange = (dhigh(0)- dlow(0))*multiplier
TodayRangePoints = TodayRange/10
MidRange = dhigh(0) - ((dhigh(0)- dlow(0)) / 2)
adr = Round(adr * multiplier)

ELSIF(ticksize=0.25) THEN //S&P500
//Voffset = 4*ticksize
Voffset2 = 20*ticksize
multiplier = 4
TodayRange = (dhigh(0)- dlow(0))*multiplier //Because ticksize is 0.25
TodayRangePoints = TodayRange/4
MidRange = dhigh(0) - ((dhigh(0)- dlow(0)) / 2)
adr = Round(adr * multiplier)

ELSE
//Voffset = 3*ticksize
//Voffset2 = 5*ticksize
ENDIF


//Have to multiply ticksize by the ADR because ADR could be 42 which pushes the indicator off eh chart
ts = ticksize * adr
//tsize = ticksize
//DayConstant = day


HIDaily1 = dhigh(0)
LOWDaily1 = dlow(0)
HIGHDailyProjection = LOWDaily1 + ts
LOWDailyProjection = HIDaily1 - ts
//bar0 = Range * multiplier
//bar1 = Range[1] * multiplier
//bar2 = Range[2] * multiplier
//bar3 = Range[3] * multiplier
//bar4 = Range[4] * multiplier

//Show us where the start of ADR calculation is
//This wont work because when you change timeframe
//DRAWARROWDOWN(barindex[60],high[60] +Voffset2)coloured(0,102,204)
//DRAWARROWUP(barindex[60],low[60]-Voffset2)coloured(0,102,204)

DRAWSEGMENT(barindex[4], HIDaily1, barindex, HIDaily1) coloured(255,10,10)
DRAWSEGMENT(barindex[4], LOWDaily1, barindex, LOWDaily1) coloured(255,10,10)
DRAWSEGMENT(barindex[4], HIGHDailyProjection, barindex, HIGHDailyProjection) coloured(0,128,255)
DRAWSEGMENT(barindex[4], LOWDailyProjection, barindex, LOWDailyProjection) coloured(0,128,255)
//DRAWHLINE(HIGHDailyProjection)coloured(255,128,10)
//DRAWHLINE(LOWDailyProjection)coloured(255,128,10)

//center=barindex+10
drawtext("                            High: #HIDaily1#",barindex,dhigh(0),Dialog,Standard,10) coloured(204,0,0)
drawtext("                           Low: #LOWDaily1#",barindex,dlow(0),Dialog,Standard,10) coloured(204,0,0)
drawtext("                     HDP",barindex,HIGHDailyProjection+Voffset2,Dialog,Standard,10) coloured(0,0,255)
drawtext("                     LDP",barindex,LOWDailyProjection-Voffset2,Dialog,Standard,10) coloured(0,0,255)

drawtext("                                                                                                        Todays Range Ticks=#TodayRange#",barindex,MidRange,Dialog,Standard,10) coloured(0,0,255)
drawtext("                                                                                                        Todays Range Points=#TodayRangePoints#",barindex,MidRange-Voffset2,Dialog,Standard,10) coloured(0,0,255)
drawtext("                                                                                             ADR(#ADRperiod#)=#adr#",barindex,MidRange-(Voffset2*2),Dialog,Standard,10) coloured(0,0,255)
//drawtext("                                                                                                    Bar (0) Range=#bar0#",barindex,MidRange-(Voffset2*2),Dialog,Standard,10) coloured(0,0,255)
//drawtext("                                                                                                    Bar (1) Range= #bar1#",barindex,MidRange-(Voffset2*3),Dialog,Standard,10) coloured(0,0,255)
//drawtext("                                                                                                    Bar (2) Range= #bar2#",barindex,MidRange-(Voffset2*4),Dialog,Standard,10) coloured(0,0,255)
//drawtext("                                                                                                    Bar (3) Range= #bar3#",barindex,MidRange-(Voffset2*5),Dialog,Standard,10) coloured(0,0,255)
//drawtext("                                                                                                    Bar (4) Range= #bar4#",barindex,MidRange-(Voffset2*6),Dialog,Standard,10) coloured(0,0,255)
//drawtext("             ADR*ticksize=#ts#",barindex,LOWDailyProjection-Voffset4,Dialog,Standard,10) coloured(0,0,255)
//drawtext("             HighProjectionPrice=#HIGHDailyProjection#",barindex,LOWDailyProjection-Voffset5,Dialog,Standard,10) coloured(0,0,255)
//drawtext("             LowProjectionPrice=#LOWDailyProjection#",barindex,LOWDailyProjection-Voffset6,Dialog,Standard,10) coloured(0,0,255)
//drawtext("             Day Constant=#DayConstant#",barindex,LOWDailyProjection-Voffset7,Dialog,Standard,10) coloured(0,0,255)
RETURN