hello, how can i displacement or shift indicator to left with number bars or something like that
 JS
JSParticipant
Veteran
Hello
To “shift” a moving average, you can use the following code:
Avg = Average[20](Close)
AvgShift = Average[20](Close[5])
In this example, the “shift” is determined by the number 5, meaning the calculation looks back 5 candles into the past. The Average effectively starts 5 candles earlier.
Visually, on the chart, it appears as though the average is shifted to the right because the values from 5 candles ago are being displayed in the current period…
Technically, the moving average itself is not shifted. Instead, it is calculated using older data (from 5 candles ago). This creates the appearance of a rightward shift while simply using a different dataset for the calculation…
i’m using for example highest[5](high) and I want it to appear 5 candles behind the current candle and not appear in line with the current candle.
JSParticipant
Veteran
I believe that in ProRealTime, it is only possible to simulate a left shift by storing the values in an array and then visualizing them as ‘shifted.’ However, this requires a relatively complex approach and is not the simplest method…
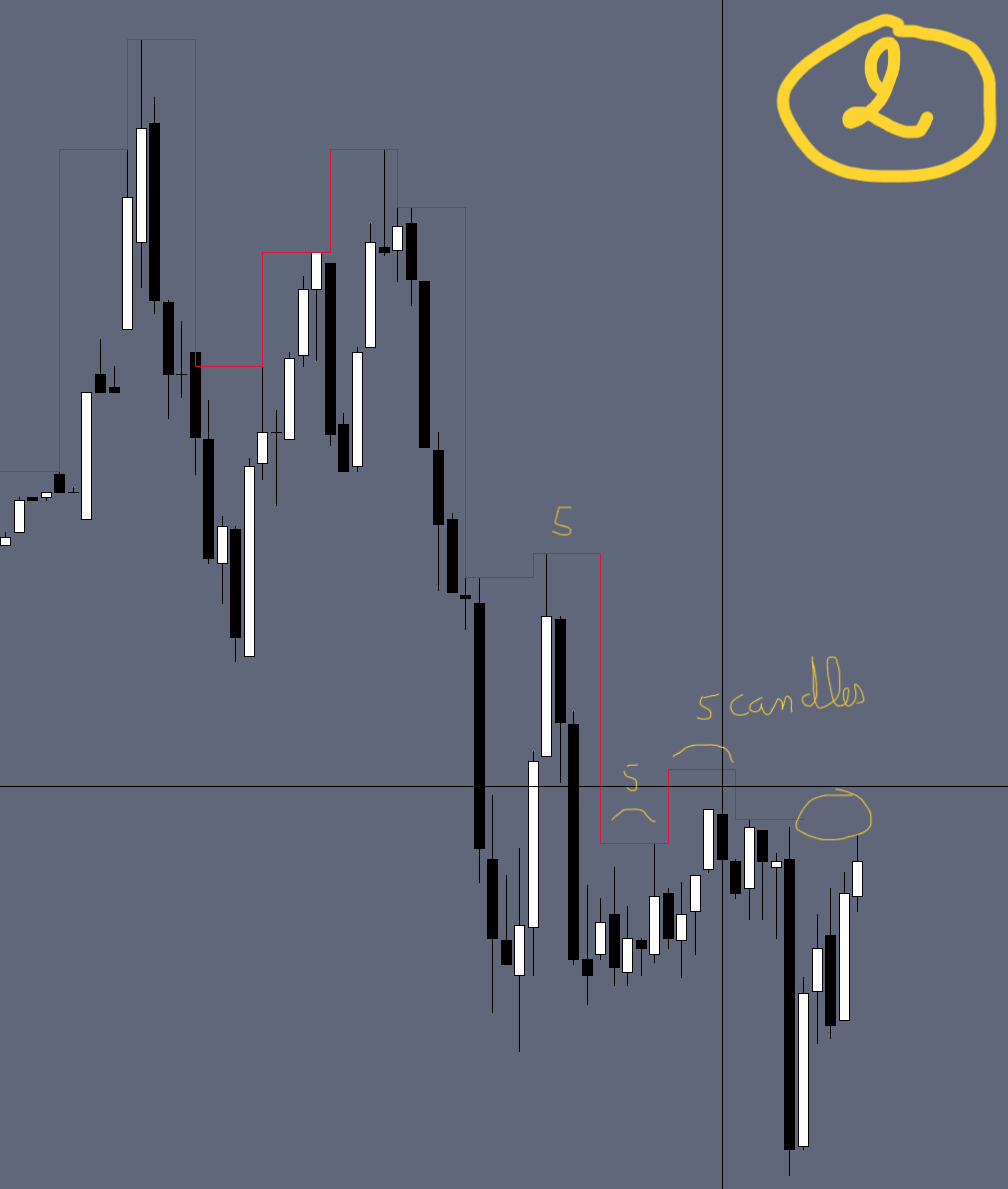
i will simplfly it. for example in 1min TF i want every 5 candles draw line above them which represent highest high and wait for update another 5 candles then draw another line … i have solve this by draw segement chart be too laggy when zoom out so i want to make it like indicator with return…
JSParticipant
Veteran
Do you mean something like this…
I don’t know if this is any use, so here goes.
When using the RETURN line in an indicator, the lines displayed and hence their value’s are bound by the values on each bar.
Though you can offset a bars value used, high[5], the resultant value is displayed with respect to the bar being executed.
Using some of the DRAW commands, you have the option, not only to offset which bar value is used, but the bar where its drawn.
So, DRAWSEGMENT(x1,y1,x2,y2) could be DRAWSEGMENT(x1[v+1],y1[1],x2[v],y2) where ‘v’ is the offset bar position value.
The downsides, are that you can’t use the DEFPARAM DrawOnLastBarOnly = true, which would omits prior drawn segment lines between bars and may interfere with other code elements used.
Also, configure line options, like colour, etc., need hard coding or the addition of dynamic variables and additional code, as well as the line value’s don’t show up in the cursor info.
This then leads into #JS reference to using array’s, to store each value and then re-drawing them every bar with an offset.
You still have some limitations, but a few other option open up.
In general the more code being executed and things being drawn, the execution time is going to increase.
hi = highest[5](high)

v = 5

x1 = barindex[v+1]
y1 = hi[1]
x2 = barindex[v]
y2 = hi

drawSegment(x1,y1,x2,y2) coloured("violet")  // line segments offset from original position

return hi style(dottedline) // comparison hi of original position
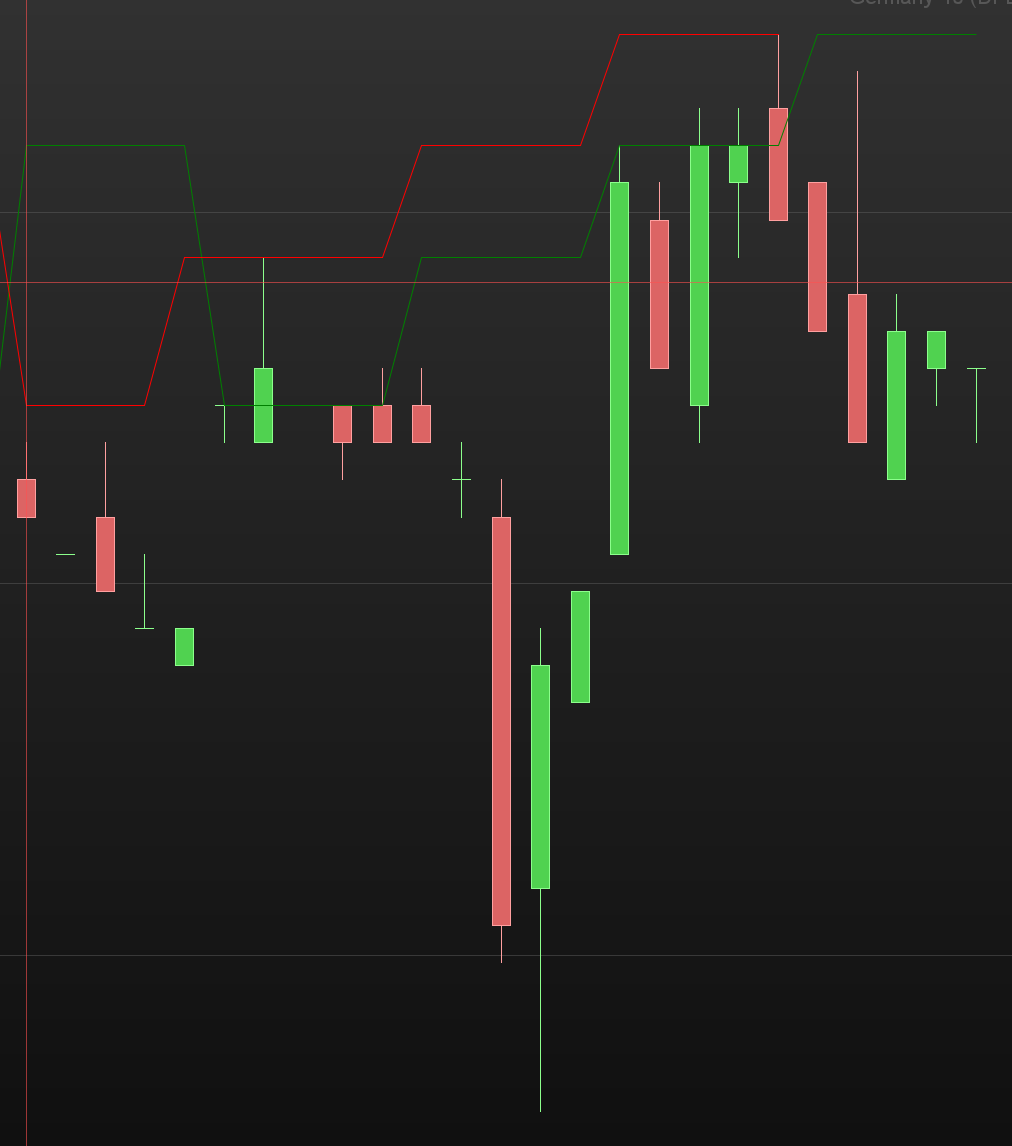
chart 01 :
TimeFrame(5 Minutes, UpdateOnClose)
H5m = Highest[1](High)
TimeFrame(default)

return H5m COLOURED ("green")
chart 02 :
once is5M = 0
TimeFrame(5 Minutes, UpdateOnClose)
once C5M = 0
C5M = C5M+1
H5m = Highest[1](High)
TimeFrame(default)

IF is15M <> C15M THEN
DRAWSEGMENT (NDX, H5m, BarIndex, H5m) COLOURED ("Crimson") STYLE (LINE, 1)
DRAWSEGMENT (NDX, PH5m, NDX, H5m) COLOURED ("Crimson") STYLE (LINE, 1)
PH5m = H5m
PL5m = L5m
is5M = C5M
NDX15m = BarIndex
ENDIF

return
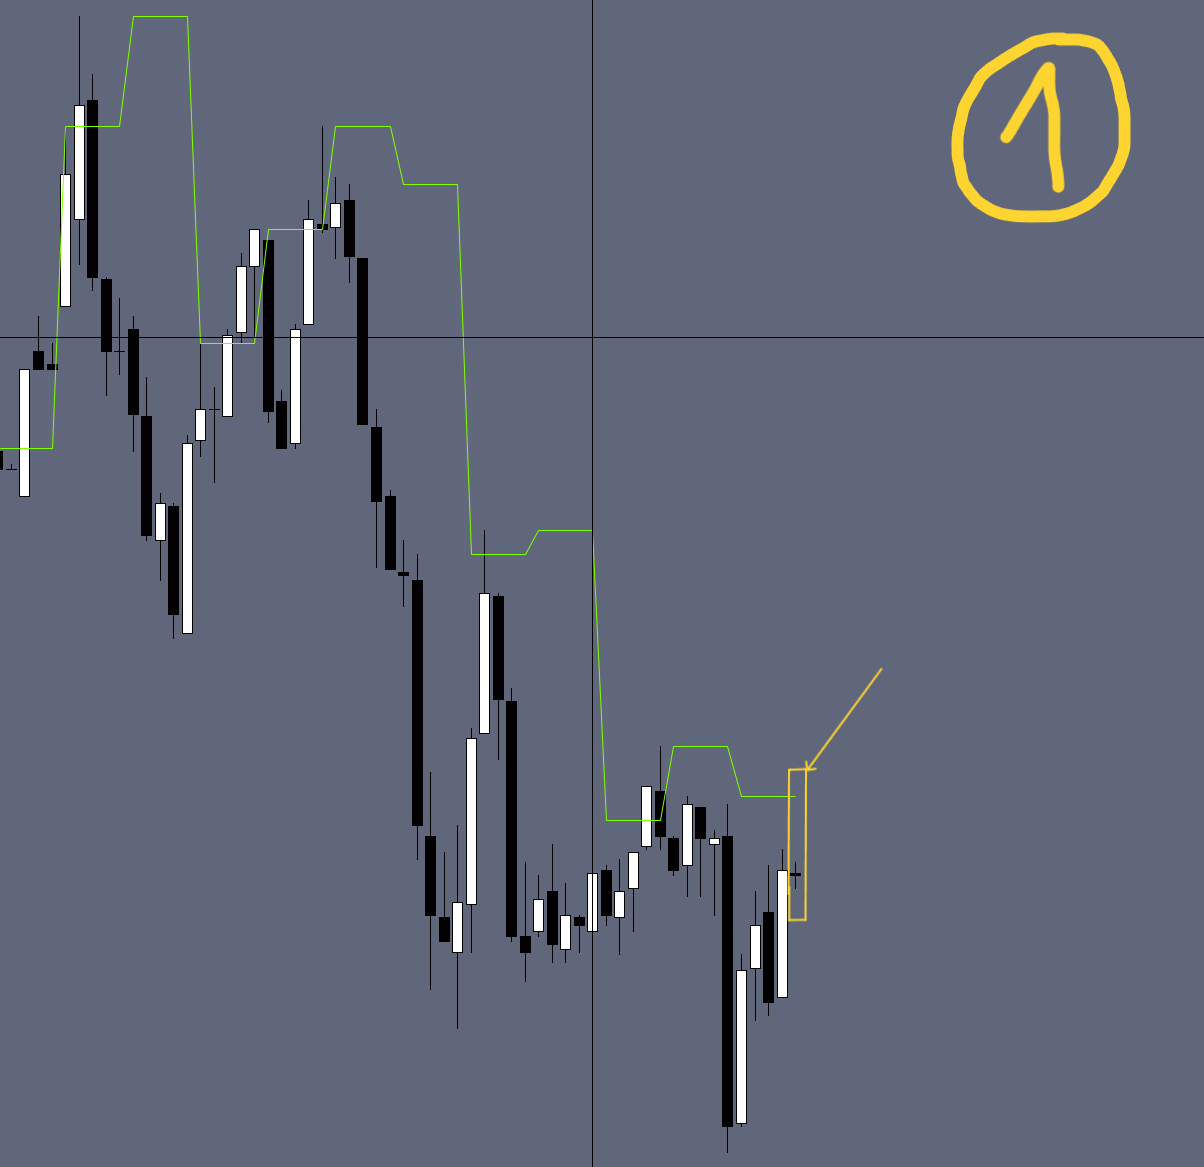
the calculation is still the same just i want to shift indicator to the left.
with return H5m it’s draw high of 5 candels in new 5 candels but in what i want i want to draw high on the same candles as shown in chart 2
TimeFrame(5 Minutes, UpdateOnClose)
H5m = Highest[1](High)

TimeFrame(default)

OS = 5 // offset
drawsegment(barindex[OS+1],H5m[1],barindex[OS],H5m) coloured("red")


return H5m COLOURED ("green")
so there is no way to get red line with return without using drawsegement ?
Though you can offset a values position with drawSegment and array’s, you can not do it on the return line.
A variable on the return line displays all its values relative to each bar.
The values are, the current bar value, and all the historical values from bar 0 to barindex.
At the bar end update, the current bars value is historicised and becomes read only.
Its value can be read with the [n] syntax, but not re-written at its historic bar position .
So there’s no way to take the current value, and store it in an earlier historicised bar location, which is what I think your after.
With arrays, you can only display one element value per variable on the return line, so that’s no help either in that regards.
Explain the reasons why you want the line drawn with the return line.
What do you want to do with the return line, what can’t you do with the draw segment.
Though you can offset a values position with drawSegment and array’s, you can not do it on the return line.
A variable on the return line displays all its values relative to each bar.
Yes, it’s pretty much like Ichimoku’s CHIKOU. On the chart it’s just the current CLOSE shifted 26 bars leftwards. Actually it’s CLOSE[26].