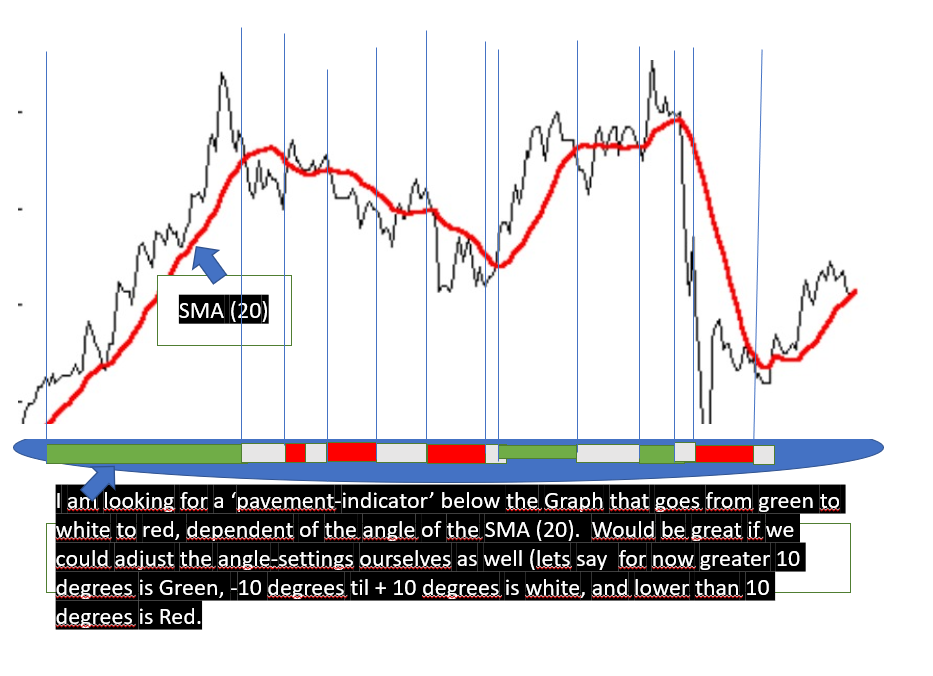
Hi Everyone, maybe its developed yet? I am looking for an indicator that indicates the amount of degree of angle the SMA (20) has.
So is SMA (20) is > 15 degrees? than below its green on the bar. (there is a trendingmarket upward)
SMA (20) is between -15 and + 15 degrees angle? than below the colour is white (and then there is a horizontal tradingmarket)
SMA (20) is below 15 degrees angle? than below the graph the colour is red. There is a trendingmarket downward)
See the draft that i made as well of what i think that might be a nice indicator.
Most nicely would be if we could “adjust/play” a bit ourselves as well with the SMA numbers (sma 20, 10, 30 etc) by typing in, and as well with the degreenumbers (10 degrees, 15, 20 etc) . But thats for the programmers to figure out here 😉
Greetings,
Angle is not something that it is possible to calculate as it requires an x distance to compare with our y distance and all we know about our x distance is that it is one candle more than the last candle whereas we have a value in price for our y distance. So all you can do is calculate a ratio of this average compared to the last average as it is impossible to calculate an angle.
Hi Vonasi,
I don’t need a true degrees angle. Let’s explain the idea in easier terms.
The Simple Moving Average, or SMA, is nothing more than the average rate over a certain period. This is calculated by adding up all closing prices in this period and dividing by the number of days.
To determine the percentage increase in the price, only the previous SMA needs to be compared with the current SMA.
If this increase is greater than, for example, 15%, then we state that the trend is upwards.
The formula to determine that is:
(SMA (new) – SMA (old)) / SMA (old) x 100%. => in words… => (SMA new minus SMA old) divided by SMA (old) and then the result multiplied by 100%.
So on a daily basis it becomes SMA (today) – SMA (yesterday) / SMA (yesterday) X 100% ..
On an hourly basis, it becomes (SMA (hour x) – SMA (hour x -1) / SMA (hour x -1) x 100%
etc..
For the downward trend, the decrease is greater than 15% and the same calculation applies.
I hope that the idea is clearer now, and I hope possible to program?
Yes that is a ratio of current SMA compared to previous SMA. That we can calculate – angles we can’t.
You virtually wrote the code.
period = 20
avg = average[period]
angleratio = ((avg-avg[1])/avg[1])*100

return angleratio
Hi Nicolas and Vonasi,
Thanks for all the effort so far in helping me,
I looked at the different contributions on this forum.
However, they all miss for me an important part; and that is the phase in which you should not trade. That is the ‘white’ phase i will explain below.
In other words, when starts the trending phase (long) when start the trendingphase (short), when start trading phase (horizontal) is the phase in which you do not trade. The idea is then to avoid the horizontal trading phases, and catch as early as possible the new possible trendingphases..
In short the idea is (for instance we take in this example 15%):
Long (green color): if the SMA makes more than 15% upward movement.
Horizontal (white color): if the SMA stays between minimal changes up and down and up and down -15% and + 15% so … stays more or less horizontally, the stock / indices will not go “anywhere” to make money.
Short (red color): if the SMA makes more than 15% downward movement.
So there is an extra phase in it, which is not yet included in the ideas already made. Per share or index it is then possible to see for yourself via trial and error what the best percentage would be .. eg 5% or 10% or 15% etc ..
Would be nice below the grafh visual to see, see my draw 😉 . But if its easier it can be placed right into the SMA itsself that changes of colour from Red tot White to Green and back.. depending of the percentage one chooses, is also nice!. And if its possible in the code to change the SMA(20) in a lets say SMA (14) would also be great! We all can try different settings and calculate the system in a normal backtest, with no optimalisation that makes it more ‘wishfull thinking’ to the future ahead. And even to use intraday.
If i could program, i would program it and share it, but i am more a idea-man than a programming-man unfortunately.
This one? https://www.prorealcode.com/prorealtime-indicators/b-m-i-angle-of-ma/
or even these other ones?
https://www.prorealcode.com/topic/rate-of-ma/#post-50731
https://www.prorealcode.com/topic/angle-moving-average/
or this snippet that calculate a 2 moving average percentage spread distance:
//MA percentage distance
a = average[7]
b = average[20]
upper = max(a,b)
lower = min(a,b)
d = ((upper - lower) / lower) *100

return d