Bonjour,
est-il possible d’ajouter sur un timeframe 1h un indicateur en UT weekly ?
Merci.
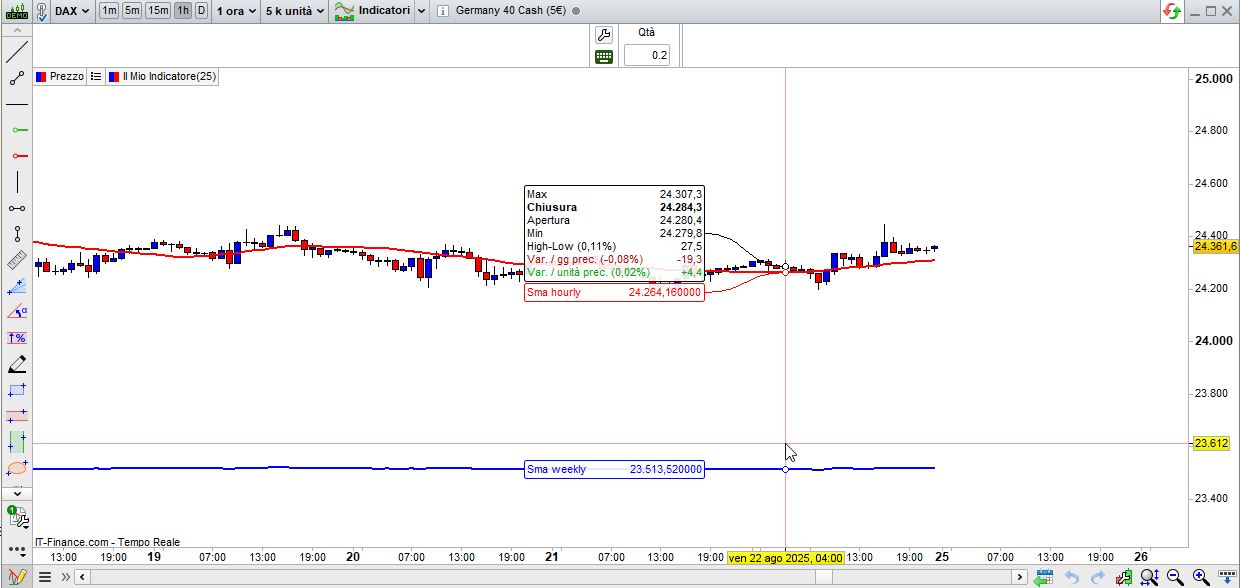
Oui, voici un exemple sur le DAX (1h). Bien entendu, vous devez utiliser suffisamment d’unités sur le graphique horaire pour calculer l’indicateur hebdomadaire :
Timeframe(Weekly)
SmaW  = average[20,0](close)
//
Timeframe(1h)
Sma1h = average[20,0](close)
//
Timeframe(default)
RETURN SmaW AS "Sma weekly",Sma1h AS "Sma hourly"
// Original Script > @DonovanWall
// Adapted Version > @guikroth
//////////////////////////////////////////////////////////////////////////
// Settings for 5min chart, BTCUSDC. For Other coin, change the parameters
//////////////////////////////////////////////////////////////////////////
Timeframe (weekly)
// Source
src = customclose
// Sampling Period
// Settings for 5min chart, BTCUSDC. For Other coin, change the paremeters
// per = defval=100, minval=1, "Sampling Period"
// Range Multiplier
// mult = defval=3.0, minval=0.1, "Range Multiplier"
PER = 150
MULT = 3
// Smooth Average Range
wper = per*2 -1
avrng = exponentialaverage[per](abs(src-src[1]))
smrng = mult * exponentialaverage[wper](avrng)
// Range Filter
rngfilt = src
If src > rngfilt[1] then
If rngfilt[1] > src-smrng then
rngfilt = rngfilt[1]
Else
rngfilt = src-smrng
endif
elsif rngfilt[1] < src+smrng then
rngfilt = rngfilt[1]
else
rngfilt = src+smrng
endif
filt = rngfilt
// Filter Direction
upward = 0
If filt > filt[1] then
upward = upward[1]+1
elsif filt < filt[1] then
upward = 0
else
upward = upward[1]
endif
downward = 0
If filt < filt[1] then
downward = downward[1]+1
elsif filt > filt[1] then
downward = 0
else
downward = downward[1]
endif
// Target Bands
hband = filt + smrng
lband = filt - smrng
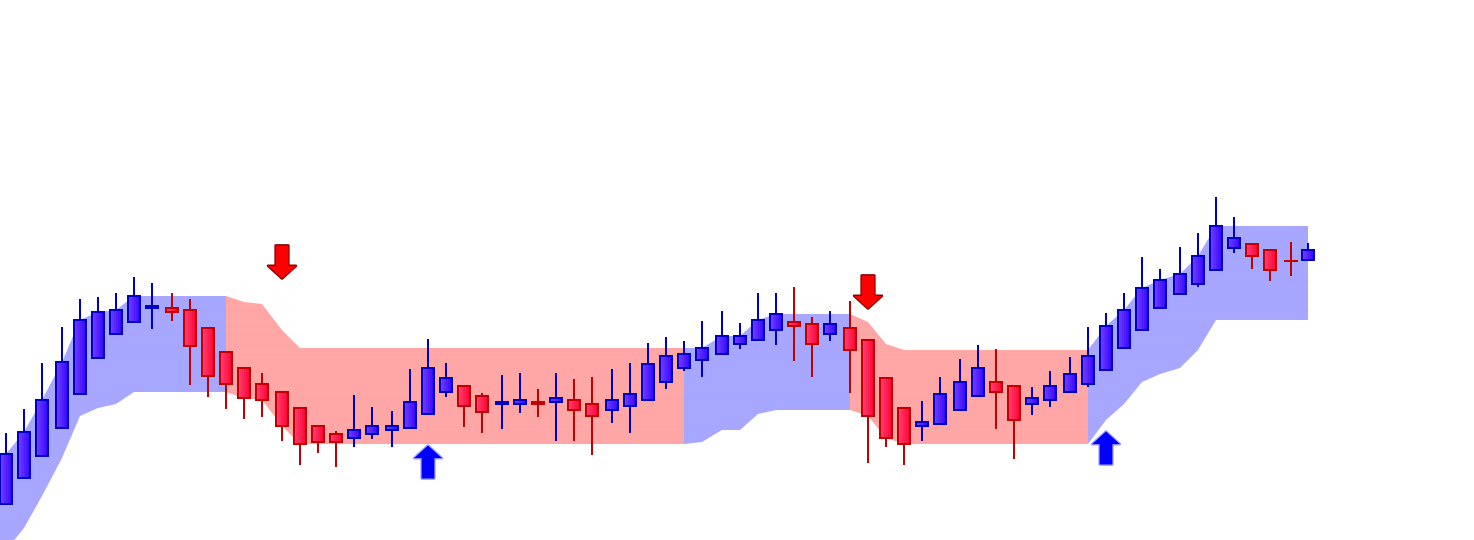
//// Zone de couleurs : selon des conditions
////////////////////////////////////////////////////////////////////////////
mbTendance = (Average[3](filt) + filt)/2
if mbTendance > mbTendance[1] then
red=0
green=0
blue=255
elsif mbTendance < mbTendance[1] then
red=255
green=0
blue=0
endif
colorbetween(lband,hband,red,Green,Blue,88)
Timeframe (1 hour)
// Source
src1h = customclose
// Smooth Average Range
per1h = 150
mult1h = 3
wper1h = per1h*2 -1
avrng1h = exponentialaverage[per1h](abs(src1h-src1h[1]))
smrng1h = mult1h * exponentialaverage[wper1h](avrng1h)
// Range Filter
rngfilt1h = src1h
If src1h > rngfilt1h[1] then
If rngfilt1h[1] > src1h-smrng1h then
rngfilt1h = rngfilt1h[1]
Else
rngfilt1h = src1h-smrng1h
endif
elsif rngfilt1h[1] < src1h+smrng1h then
rngfilt1h = rngfilt1h[1]
else
rngfilt1h = src1h+smrng1h
endif
filt1h = rngfilt1h
// Filter Direction
upward1h = 0
If filt1h > filt1h[1] then
upward1h = upward1h[1]+1
elsif filt1h < filt1h[1] then
upward1h = 0
else
upward1h = upward1h[1]
endif
downward1h = 0
If filt1h < filt1h[1] then
downward1h = downward1h[1]+1
elsif filt1h > filt1h[1] then
downward1h = 0
else
downward1h = downward1h[1]
endif
// Target Bands
hband1h = filt1h + smrng1h
lband1h = filt1h - smrng1h
//// Zone de couleurs : selon des conditions
////////////////////////////////////////////////////////////////////////////
mbTendance1h = (Average[3](filt1h) + filt1h)/2
if mbTendance1h > mbTendance1h[1] then
red1h=0
green1h=0
blue1h=255
elsif mbTendance1h < mbTendance1h[1] then
red1h=255
green1h=0
blue1h=0
endif
Timeframe(default)
Return filt as "Range Filter", hband as "High Target", lband as "Low Target", mbtendance as "tendance", filt1h as "Range Filter1H", hband1h as "High Target1H", lband1h as "Low Target1H", mbtendance1h as "tendance1H"
Bonsoir Roberto,
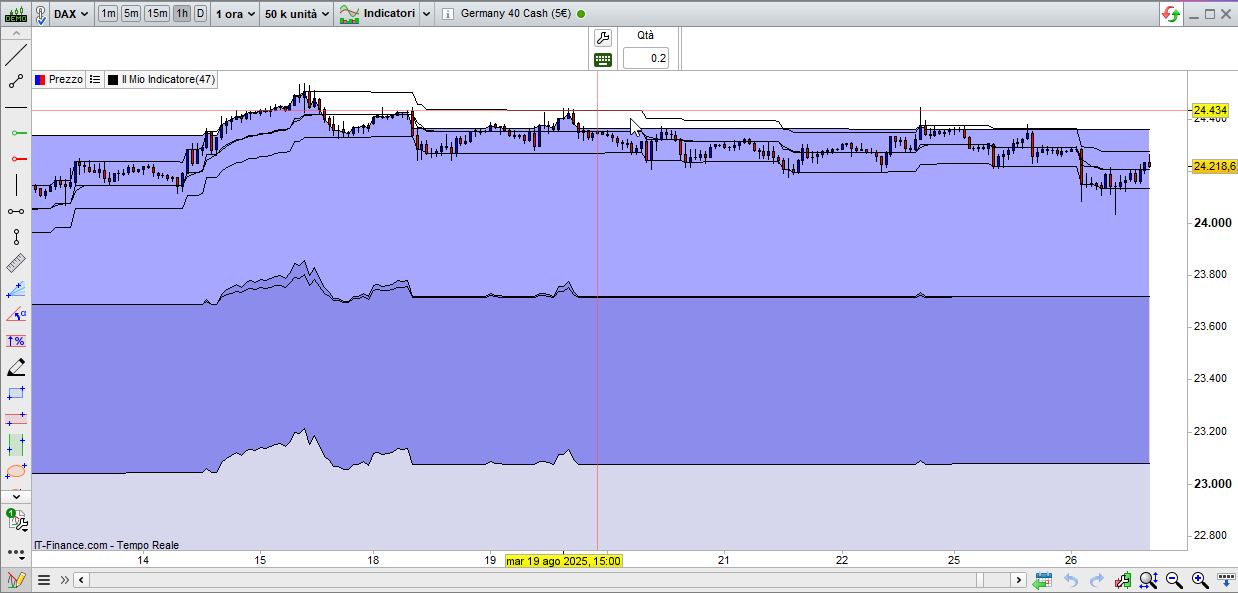
ci-joint le code que j’ai essayé de transformer en weekly et 1h.
je m’attendais à voir deux graphes mais ce n’est pas le cas.
Pourriez-vous me dire où est le problème ?
Merci.
ci-dessous le graphique que je voudrais dupliquer en weekly en le superposant à un graphique 1h.
Comme je l’ai dit plus haut “vous devez utiliser suffisamment d’unités sur le graphique horaire pour calculer l’indicateur hebdomadaire“.
Une moyenne exponentielle nécessite environ deux fois plus d’unités que de périodes, soit environ 300 unités par semaine. Comme une semaine compte 5 jours et que chaque jour dure 24 heures, le nombre total d’unités horaires nécessaires sera d’environ 36 000 (300 x 5 x 24), voire plus.