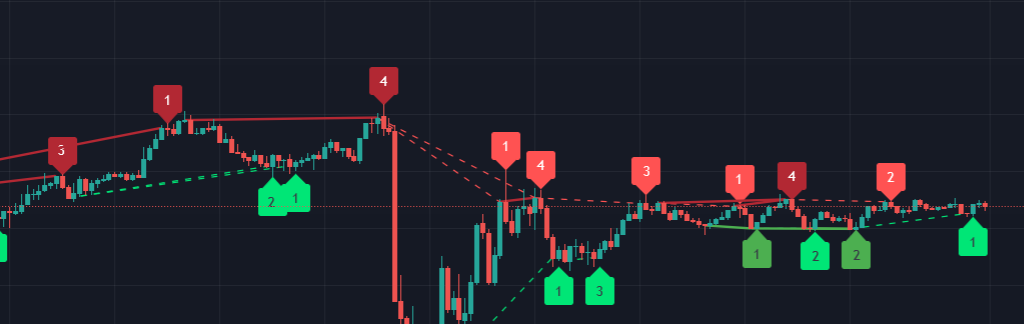
Bonjour, j’ai un indicateur sur TV que j’utilise depuis assez longtemps mais j’aimerais le mettre sur PRT pour pouvoir programmer ma strat. SI quelqu’un peut m’aider svp ; ) .
/@version=4
study(“Divergence for Many Indicators v4”, overlay = true, max_bars_back = 1000, max_lines_count = 400, max_labels_count = 400)
prd = input(defval = 5, title = “Pivot Period”, minval = 1, maxval = 50)
source = input(defval = “Close”, title = “Source for Pivot Points”, options = [“Close”, “High/Low”])
searchdiv = input(defval = “Regular”, title = “Divergence Type”, options = [“Regular”, “Hidden”, “Regular/Hidden”])
showindis = input(defval = “Full”, title = “Show Indicator Names”, options = [“Full”, “First Letter”, “Don’t Show”])
showlimit = input(1, title=”Minimum Number of Divergence”, minval = 1, maxval = 11)
maxpp = input(defval = 10, title = “Maximum Pivot Points to Check”, minval = 1, maxval = 20)
maxbars = input(defval = 100, title = “Maximum Bars to Check”, minval = 30, maxval = 200)
shownum = input(defval = true, title = “Show Divergence Number”)
showlast = input(defval = false, title = “Show Only Last Divergence”)
dontconfirm = input(defval = false, title = “Don’t Wait for Confirmation”)
showlines = input(defval = true, title = “Show Divergence Lines”)
showpivot = input(defval = false, title = “Show Pivot Points”)
calcmacd = input(defval = true, title = “MACD”)
calcmacda = input(defval = true, title = “MACD Histogram”)
calcrsi = input(defval = true, title = “RSI”)
calcstoc = input(defval = true, title = “Stochastic”)
calccci = input(defval = true, title = “CCI”)
calcmom = input(defval = true, title = “Momentum”)
calcobv = input(defval = true, title = “OBV”)
calcvwmacd = input(true, title = “VWmacd”)
calccmf = input(true, title = “Chaikin Money Flow”)
calcmfi = input(true, title = “Money Flow Index”)
calcext = input(false, title = “Check External Indicator”)
externalindi = input(defval = close, title = “External Indicator”)
pos_reg_div_col = input(defval = color.yellow, title = “Positive Regular Divergence”)
neg_reg_div_col = input(defval = color.navy, title = “Negative Regular Divergence”)
pos_hid_div_col = input(defval = color.lime, title = “Positive Hidden Divergence”)
neg_hid_div_col = input(defval = color.red, title = “Negative Hidden Divergence”)
pos_div_text_col = input(defval = color.black, title = “Positive Divergence Text Color”)
neg_div_text_col = input(defval = color.white, title = “Negative Divergence Text Color”)
reg_div_l_style_ = input(defval = “Solid”, title = “Regular Divergence Line Style”, options = [“Solid”, “Dashed”, “Dotted”])
hid_div_l_style_ = input(defval = “Dashed”, title = “Hdden Divergence Line Style”, options = [“Solid”, “Dashed”, “Dotted”])
reg_div_l_width = input(defval = 2, title = “Regular Divergence Line Width”, minval = 1, maxval = 5)
hid_div_l_width = input(defval = 1, title = “Hidden Divergence Line Width”, minval = 1, maxval = 5)
showmas = input(defval = false, title = “Show MAs 50 & 200”, inline = “ma12”)
cma1col = input(defval = color.lime, title = “”, inline = “ma12”)
cma2col = input(defval = color.red, title = “”, inline = “ma12”)
plot(showmas ? sma(close, 50) : na, color = showmas ? cma1col : na)
plot(showmas ? sma(close, 200) : na, color = showmas ? cma2col: na)
// set line styles
var reg_div_l_style = reg_div_l_style_ == “Solid” ? line.style_solid :
reg_div_l_style_ == “Dashed” ? line.style_dashed :
line.style_dotted
var hid_div_l_style = hid_div_l_style_ == “Solid” ? line.style_solid :
hid_div_l_style_ == “Dashed” ? line.style_dashed :
line.style_dotted
// get indicators
rsi = rsi(close, 14) // RSI
[macd, signal, deltamacd] = macd(close, 12, 26, 9) // MACD
moment = mom(close, 10) // Momentum
cci = cci(close, 10) // CCI
Obv = obv // OBV
stk = sma(stoch(close, high, low, 14), 3) // Stoch
maFast = vwma(close, 12), maSlow = vwma(close, 26), vwmacd = maFast – maSlow // volume weighted macd
Cmfm = ((close-low) – (high-close)) / (high – low), Cmfv = Cmfm * volume, cmf = sma(Cmfv, 21) / sma(volume,21) // Chaikin money flow
Mfi = mfi(close, 14) // Moneyt Flow Index
// keep indicators names and colors in arrays
var indicators_name = array.new_string(11)
var div_colors = array.new_color(4)
if barstate.isfirst
// names
array.set(indicators_name, 0, showindis == “Full” ? “MACD” : “M”)
array.set(indicators_name, 1, showindis == “Full” ? “Hist” : “H”)
array.set(indicators_name, 2, showindis == “Full” ? “RSI” : “E”)
array.set(indicators_name, 3, showindis == “Full” ? “Stoch” : “S”)
array.set(indicators_name, 4, showindis == “Full” ? “CCI” : “C”)
array.set(indicators_name, 5, showindis == “Full” ? “MOM” : “M”)
array.set(indicators_name, 6, showindis == “Full” ? “OBV” : “O”)
array.set(indicators_name, 7, showindis == “Full” ? “VWMACD” : “V”)
array.set(indicators_name, 8, showindis == “Full” ? “CMF” : “C”)
array.set(indicators_name, 9, showindis == “Full” ? “MFI” : “M”)
array.set(indicators_name,10, showindis == “Full” ? “Extrn” : “X”)
//colors
array.set(div_colors, 0, pos_reg_div_col)
array.set(div_colors, 1, neg_reg_div_col)
array.set(div_colors, 2, pos_hid_div_col)
array.set(div_colors, 3, neg_hid_div_col)
// Check if we get new Pivot High Or Pivot Low
float ph = pivothigh((source == “Close” ? close : high), prd, prd)
float pl = pivotlow((source == “Close” ? close : low), prd, prd)
plotshape(ph and showpivot, text = “H”, style = shape.labeldown, color = color.new(color.white, 100), textcolor = color.red, location = location.abovebar, offset = -prd)
plotshape(pl and showpivot, text = “L”, style = shape.labelup, color = color.new(color.white, 100), textcolor = color.lime, location = location.belowbar, offset = -prd)
// keep values and positions of Pivot Highs/Lows in the arrays
var int maxarraysize = 20
var ph_positions = array.new_int(maxarraysize, 0)
var pl_positions = array.new_int(maxarraysize, 0)
var ph_vals = array.new_float(maxarraysize, 0.)
var pl_vals = array.new_float(maxarraysize, 0.)
// add PHs to the array
if ph
array.unshift(ph_positions, bar_index)
array.unshift(ph_vals, ph)
if array.size(ph_positions) > maxarraysize
array.pop(ph_positions)
array.pop(ph_vals)
// add PLs to the array
if pl
array.unshift(pl_positions, bar_index)
array.unshift(pl_vals, pl)
if array.size(pl_positions) > maxarraysize
array.pop(pl_positions)
array.pop(pl_vals)
// functions to check Regular Divergences and Hidden Divergences
// function to check positive regular or negative hidden divergence
// cond == 1 => positive_regular, cond == 2=> negative_hidden
positive_regular_positive_hidden_divergence(src, cond)=>
divlen = 0
prsc = source == “Close” ? close : low
// if indicators higher than last value and close price is higher than las close
if dontconfirm or src > src[1] or close > close[1]
startpoint = dontconfirm ? 0 : 1 // don’t check last candle
// we search last 15 PPs
for x = 0 to maxpp – 1
len = bar_index – array.get(pl_positions, x) + prd
// if we reach non valued array element or arrived 101. or previous bars then we don’t search more
if array.get(pl_positions, x) == 0 or len > maxbars
break
if len > 5 and
((cond == 1 and src[startpoint] > src[len] and prsc[startpoint] < nz(array.get(pl_vals, x))) or
(cond == 2 and src[startpoint] < src[len] and prsc[startpoint] > nz(array.get(pl_vals, x))))
slope1 = (src[startpoint] – src[len]) / (len – startpoint)
virtual_line1 = src[startpoint] – slope1
slope2 = (close[startpoint] – close[len]) / (len – startpoint)
virtual_line2 = close[startpoint] – slope2
arrived = true
for y = 1 + startpoint to len – 1
if src[y] < virtual_line1 or nz(close[y]) < virtual_line2
arrived := false
break
virtual_line1 := virtual_line1 – slope1
virtual_line2 := virtual_line2 – slope2
if arrived
divlen := len
break
divlen
// function to check negative regular or positive hidden divergence
// cond == 1 => negative_regular, cond == 2=> positive_hidden
negative_regular_negative_hidden_divergence(src, cond)=>
divlen = 0
prsc = source == “Close” ? close : high
// if indicators higher than last value and close price is higher than las close
if dontconfirm or src < src[1] or close < close[1]
startpoint = dontconfirm ? 0 : 1 // don’t check last candle
// we search last 15 PPs
for x = 0 to maxpp – 1
len = bar_index – array.get(ph_positions, x) + prd
// if we reach non valued array element or arrived 101. or previous bars then we don’t search more
if array.get(ph_positions, x) == 0 or len > maxbars
break
if len > 5 and
((cond == 1 and src[startpoint] < src[len] and prsc[startpoint] > nz(array.get(ph_vals, x))) or
(cond == 2 and src[startpoint] > src[len] and prsc[startpoint] < nz(array.get(ph_vals, x))))
slope1 = (src[startpoint] – src[len]) / (len – startpoint)
virtual_line1 = src[startpoint] – slope1
slope2 = (close[startpoint] – nz(close[len])) / (len – startpoint)
virtual_line2 = close[startpoint] – slope2
arrived = true
for y = 1 + startpoint to len – 1
if src[y] > virtual_line1 or nz(close[y]) > virtual_line2
arrived := false
break
virtual_line1 := virtual_line1 – slope1
virtual_line2 := virtual_line2 – slope2
if arrived
divlen := len
break
divlen
// calculate 4 types of divergence if enabled in the options and return divergences in an array
calculate_divs(cond, indicator)=>
divs = array.new_int(4, 0)
array.set(divs, 0, cond and (searchdiv == “Regular” or searchdiv == “Regular/Hidden”) ? positive_regular_positive_hidden_divergence(indicator, 1) : 0)
array.set(divs, 1, cond and (searchdiv == “Regular” or searchdiv == “Regular/Hidden”) ? negative_regular_negative_hidden_divergence(indicator, 1) : 0)
array.set(divs, 2, cond and (searchdiv == “Hidden” or searchdiv == “Regular/Hidden”) ? positive_regular_positive_hidden_divergence(indicator, 2) : 0)
array.set(divs, 3, cond and (searchdiv == “Hidden” or searchdiv == “Regular/Hidden”) ? negative_regular_negative_hidden_divergence(indicator, 2) : 0)
divs
// array to keep all divergences
var all_divergences = array.new_int(44) // 11 indicators * 4 divergence = 44 elements
// set related array elements
array_set_divs(div_pointer, index)=>
for x = 0 to 3
array.set(all_divergences, index * 4 + x, array.get(div_pointer, x))
// set divergences array
array_set_divs(calculate_divs(calcmacd, macd), 0)
array_set_divs(calculate_divs(calcmacda, deltamacd), 1)
array_set_divs(calculate_divs(calcrsi, rsi), 2)
array_set_divs(calculate_divs(calcstoc, stk), 3)
array_set_divs(calculate_divs(calccci, cci), 4)
array_set_divs(calculate_divs(calcmom, moment), 5)
array_set_divs(calculate_divs(calcobv, Obv), 6)
array_set_divs(calculate_divs(calcvwmacd, vwmacd), 7)
array_set_divs(calculate_divs(calccmf, cmf), 8)
array_set_divs(calculate_divs(calcmfi, Mfi), 9)
array_set_divs(calculate_divs(calcext, externalindi), 10)
// check minimum number of divergence, if less than showlimit then delete all divergence
total_div = 0
for x = 0 to array.size(all_divergences) – 1
total_div := total_div + round(sign(array.get(all_divergences, x)))
if total_div < showlimit
array.fill(all_divergences, 0)
// keep line in an array
var pos_div_lines = array.new_line(0)
var neg_div_lines = array.new_line(0)
var pos_div_labels = array.new_label(0)
var neg_div_labels = array.new_label(0)
// remove old lines and labels if showlast option is enabled
delete_old_pos_div_lines()=>
if array.size(pos_div_lines) > 0
for j = 0 to array.size(pos_div_lines) – 1
line.delete(array.get(pos_div_lines, j))
array.clear(pos_div_lines)
delete_old_neg_div_lines()=>
if array.size(neg_div_lines) > 0
for j = 0 to array.size(neg_div_lines) – 1
line.delete(array.get(neg_div_lines, j))
array.clear(neg_div_lines)
delete_old_pos_div_labels()=>
if array.size(pos_div_labels) > 0
for j = 0 to array.size(pos_div_labels) – 1
label.delete(array.get(pos_div_labels, j))
array.clear(pos_div_labels)
delete_old_neg_div_labels()=>
if array.size(neg_div_labels) > 0
for j = 0 to array.size(neg_div_labels) – 1
label.delete(array.get(neg_div_labels, j))
array.clear(neg_div_labels)
// delete last creted lines and labels until we met new PH/PV
delete_last_pos_div_lines_label(n)=>
if n > 0 and array.size(pos_div_lines) >= n
asz = array.size(pos_div_lines)
for j = 1 to n
line.delete(array.get(pos_div_lines, asz – j))
array.pop(pos_div_lines)
if array.size(pos_div_labels) > 0
label.delete(array.get(pos_div_labels, array.size(pos_div_labels) – 1))
array.pop(pos_div_labels)
delete_last_neg_div_lines_label(n)=>
if n > 0 and array.size(neg_div_lines) >= n
asz = array.size(neg_div_lines)
for j = 1 to n
line.delete(array.get(neg_div_lines, asz – j))
array.pop(neg_div_lines)
if array.size(neg_div_labels) > 0
label.delete(array.get(neg_div_labels, array.size(neg_div_labels) – 1))
array.pop(neg_div_labels)
// variables for Alerts
pos_reg_div_detected = false
neg_reg_div_detected = false
pos_hid_div_detected = false
neg_hid_div_detected = false
// to remove lines/labels until we met new // PH/PL
var last_pos_div_lines = 0
var last_neg_div_lines = 0
var remove_last_pos_divs = false
var remove_last_neg_divs = false
if pl
remove_last_pos_divs := false
last_pos_div_lines := 0
if ph
remove_last_neg_divs := false
last_neg_div_lines := 0
// draw divergences lines and labels
divergence_text_top = “”
divergence_text_bottom = “”
distances = array.new_int(0)
dnumdiv_top = 0
dnumdiv_bottom = 0
top_label_col = color.white
bottom_label_col = color.white
old_pos_divs_can_be_removed = true
old_neg_divs_can_be_removed = true
startpoint = dontconfirm ? 0 : 1 // used for don’t confirm option
for x = 0 to 10
div_type = -1
for y = 0 to 3
if array.get(all_divergences, x * 4 + y) > 0 // any divergence?
div_type := y
if (y % 2) == 1
dnumdiv_top := dnumdiv_top + 1
top_label_col := array.get(div_colors, y)
if (y % 2) == 0
dnumdiv_bottom := dnumdiv_bottom + 1
bottom_label_col := array.get(div_colors, y)
if not array.includes(distances, array.get(all_divergences, x * 4 + y)) // line not exist ?
array.push(distances, array.get(all_divergences, x * 4 + y))
new_line = showlines ? line.new(x1 = bar_index – array.get(all_divergences, x * 4 + y),
y1 = (source == “Close” ? close[array.get(all_divergences, x * 4 + y)] :
(y % 2) == 0 ? low[array.get(all_divergences, x * 4 + y)] :
high[array.get(all_divergences, x * 4 + y)]),
x2 = bar_index – startpoint,
y2 = (source == “Close” ? close[startpoint] :
(y % 2) == 0 ? low[startpoint] :
high[startpoint]),
color = array.get(div_colors, y),
style = y < 2 ? reg_div_l_style : hid_div_l_style,
width = y < 2 ? reg_div_l_width : hid_div_l_width
)
: na
if (y % 2) == 0
if old_pos_divs_can_be_removed
old_pos_divs_can_be_removed := false
if not showlast and remove_last_pos_divs
delete_last_pos_div_lines_label(last_pos_div_lines)
last_pos_div_lines := 0
if showlast
delete_old_pos_div_lines()
array.push(pos_div_lines, new_line)
last_pos_div_lines := last_pos_div_lines + 1
remove_last_pos_divs := true
if (y % 2) == 1
if old_neg_divs_can_be_removed
old_neg_divs_can_be_removed := false
if not showlast and remove_last_neg_divs
delete_last_neg_div_lines_label(last_neg_div_lines)
last_neg_div_lines := 0
if showlast
delete_old_neg_div_lines()
array.push(neg_div_lines, new_line)
last_neg_div_lines := last_neg_div_lines + 1
remove_last_neg_divs := true
// set variables for alerts
if y == 0
pos_reg_div_detected := true
if y == 1
neg_reg_div_detected := true
if y == 2
pos_hid_div_detected := true
if y == 3
neg_hid_div_detected := true
// get text for labels
if div_type >= 0
divergence_text_top := divergence_text_top + ((div_type % 2) == 1 ? (showindis != “Don’t Show” ? array.get(indicators_name, x) + “\n” : “”) : “”)
divergence_text_bottom := divergence_text_bottom + ((div_type % 2) == 0 ? (showindis != “Don’t Show” ? array.get(indicators_name, x) + “\n” : “”) : “”)
// draw labels
if showindis != “Don’t Show” or shownum
if shownum and dnumdiv_top > 0
divergence_text_top := divergence_text_top + tostring(dnumdiv_top)
if shownum and dnumdiv_bottom > 0
divergence_text_bottom := divergence_text_bottom + tostring(dnumdiv_bottom)
if divergence_text_top != “”
if showlast
delete_old_neg_div_labels()
array.push(neg_div_labels,
label.new( x = bar_index,
y = max(high, high[1]),
text = divergence_text_top,
color = top_label_col,
textcolor = neg_div_text_col,
style = label.style_label_down
))
if divergence_text_bottom != “”
if showlast
delete_old_pos_div_labels()
array.push(pos_div_labels,
label.new( x = bar_index,
y = min(low, low[1]),
text = divergence_text_bottom,
color = bottom_label_col,
textcolor = pos_div_text_col,
style = label.style_label_up
))
alertcondition(pos_reg_div_detected, title=’Positive Regular Divergence Detected’, message=’Positive Regular Divergence Detected’)
alertcondition(neg_reg_div_detected, title=’Negative Regular Divergence Detected’, message=’Negative Regular Divergence Detected’)
alertcondition(pos_hid_div_detected, title=’Positive Hidden Divergence Detected’, message=’Positive Hidden Divergence Detected’)
alertcondition(neg_hid_div_detected, title=’Negative Hidden Divergence Detected’, message=’Negative Hidden Divergence Detected’)
alertcondition(pos_reg_div_detected or pos_hid_div_detected, title=’Positive Divergence Detected’, message=’Positive Divergence Detected’)
alertcondition(neg_reg_div_detected or neg_hid_div_detected, title=’Negative Divergence Detected’, message=’Negative Divergence Detected’)