Indicateur RSI divergence +HA

Viewing 5 posts - 1 through 5 (of 5 total)
  • Author
    Posts
  • #211713 quote
    rebreb
    Participant
    Master

    Bonjour à tous,

    J’aurais besoin d’aide pour coder un indicateur qui associe le code RSI divergences élaboré par Francesco (https://www.prorealcode.com/prorealtime-indicators/rsi-classical-hidden-divergences-indicator/) et les bougies Heiken Ashi.
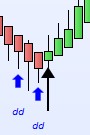
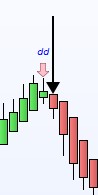
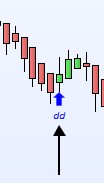
    Je souhaiterais avoir  un histogramme -1/0/1 qui se déclenche si une divergence apparait et la bougie HA est de couleur opposée au mouvement précédent  (ex1 et ex2) ou que la bougie HA suivante à l’apparition de la divergence change de sens (ex 3 et 4)

    J’ai essayé de regrouper ces 2 idées, mais çà ne me donne pas du tout le résultat souhaité

    Merci de votre aide

    Reb

    //RSI Divergences By Frank (Francesco)
    
    //Description: the indicator draws arrows on chart as entry points when a direct or an hidden RSI divergence is found.
    //When a DIRECT divergence is found, "dd" (direct divergence) text is added to chart over (Sell signal) or under (Buy signal) the arrow
    
    //When an HIDDEN or INVERSE divergence is found, "hd" (hidden divergence) text is added to chart over (Sell signal) or under (Buy signal) the arrow
    
    //Variables:
    //RsiPeriod: number of bars to calculare RSI value
    //RsiOverSold: Oversold Level
    //RsiOverBought: OverBought Level
    //MinBarRange: minimum distance from two consecutive RSI Highs or RSI Lows
    RsiPeriod=10
    RsiOverSold=30
    RsiOverBought=70
    MinBarRange=3
    Rge = averagetruerange[10](close)
    MyRSI = rsi[RsiPeriod](Close)
    
    ONCE ShiftText = 3
    
    RsiMax = MyRSI < MyRSI[1] and MyRSI[1] > MyRSI[2] and MyRSI[1] > RsiOverBought
    RsiMin = MyRSI > MyRSI[1] and MyRSI[1] < MyRSI[2] and MyRSI[1] < RsiOverSold
    
    if RsiMax then
    RSIMax1 = MyRSI[1]
    High1 = High[1]
    
    for I = MinBarRange to  80
    if RsiMax[I] then
    RSIMax2 = MyRSI[I + 1]
    High2 = High[I + 1]
    If High1 > High2 and RSIMax1 < RSIMax2 then
     X=-1
    //DRAWARROWDOWN(barindex, High + Rge / ShiftText)coloured(255,192,203,255)
    //DRAWTEXT("dd", barindex, High + Rge / ShiftText / 0.3,SansSerif,Italic,10)coloured(0,0,255,255)
    //elsif High1 < High2 and RSIMax1 > RSIMax2 then
    //DRAWARROWDOWN(barindex, High + Rge / ShiftText)coloured(255,192,203,255)
    //DRAWTEXT("hd", barindex, High + Rge / ShiftText / //0.2,SansSerif,Italic,10)coloured(0,0,255,255)
    endif
    break
    endif
    next
    endif
    
    if RsiMin then
    RSIMin1 = MyRSI[1]
    Low1 = Low[1]
    for I = MinBarRange to  80
    if RSIMin[I] then
    RSIMin2 = MyRSI[I + 1]
    Low2 = Low[I + 1]
    If Low1 < Low2 and RSIMin1 > RSIMin2 then
    X=1
    //DRAWARROWUP(barindex, lOW - Rge / ShiftText)coloured(0,0,255,255)
    //DRAWTEXT("dd", barindex, lOW - Rge / ShiftText / 0.3,SansSerif,Italic,10)coloured(0,0,255,255)
    //elsif Low1 > Low2 and RSIMin1 < RSIMin2 then
    //DRAWARROWUP(barindex, lOW - Rge / ShiftText)coloured(0,0,255,255)
    //DRAWTEXT("hd", barindex, lOW - Rge / ShiftText / //0.2,SansSerif,Italic,10)/coloured(0,0,255,255)
    endif
    break
    endif
    next
    endif
    
    
    //heiken ashi
    xClose = (Open+High+Low+Close)/4
    if(barindex>2) then
    xOpen= (xOpen[1] + xClose[1])/2
    xHigh= Max(xOpen, xClose)
    xLow= Min(xOpen, xClose)
    endif
    
    If X=1 and xOpen<xclose then
    Y = 1
    ELSIF X[1]=1 and xOpen<xclose then
    Y=0.5
    else
     Y= 0
    endif
    
    return Y
    ex1.jpg ex1.jpg ex2.jpg ex2.jpg ex3.jpg ex3.jpg ex4.jpg ex4.jpg
    #211772 quote
    NicolasNicolas
    Keymaster
    Legend

    Les divergences doivent être aussi calculés via le lissage des prix des Heikin Ashi, ou doit on utiliser le prix normal ?

    #211779 quote
    rebreb
    Participant
    Master

    Bonjour Nicolas

    Le prix normal

    #211789 quote
    NicolasNicolas
    Keymaster
    Legend

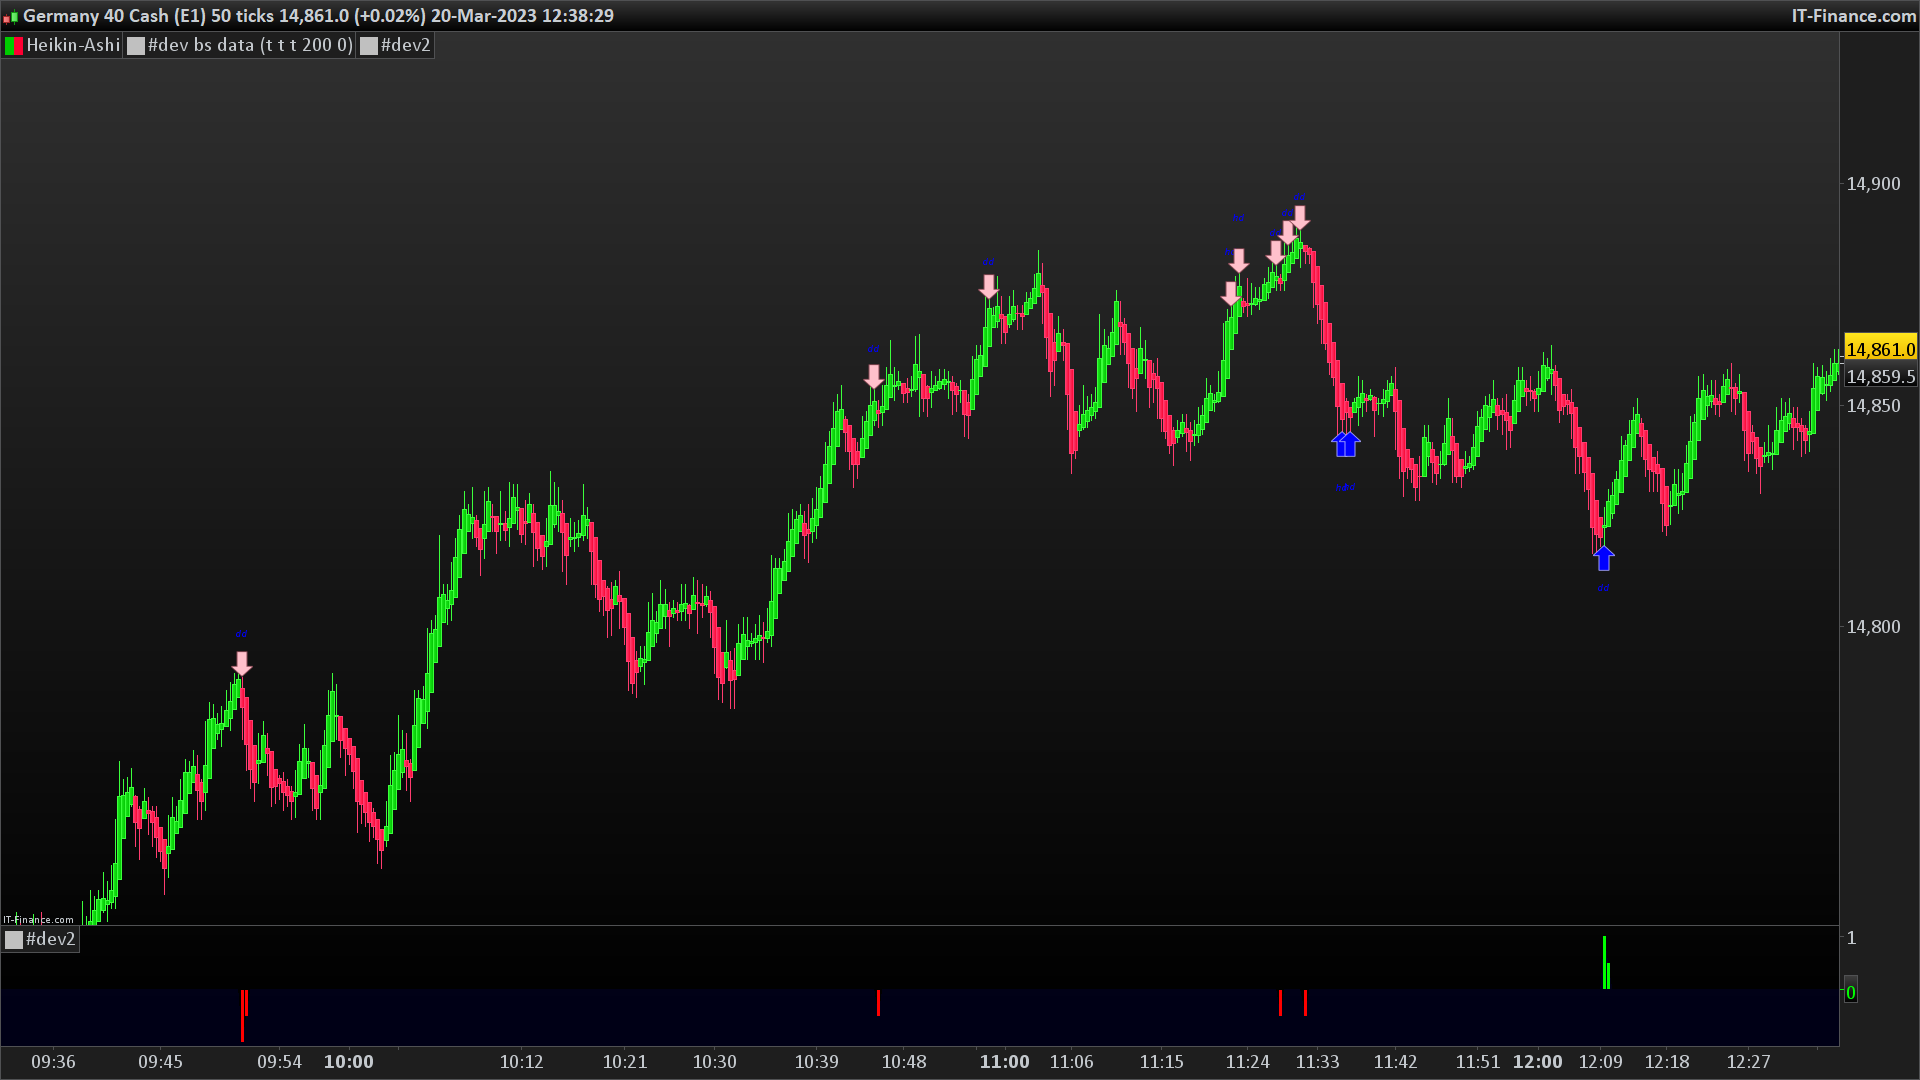
    Selon ma compréhension de ta demande, le code ci-dessous trace un histogramme des signaux sur N et N+1, selon un retournement Heikin Ashi consécutif à une divergence haussière ou baissière de type “dd” du code original.

    //RSI Divergences By Frank (Francesco)
    
    //Description: the indicator draws arrows on chart as entry points when a direct or an hidden RSI divergence is found.
    //When a DIRECT divergence is found, "dd" (direct divergence) text is added to chart over (Sell signal) or under (Buy signal) the arrow
    
    //When an HIDDEN or INVERSE divergence is found, "hd" (hidden divergence) text is added to chart over (Sell signal) or under (Buy signal) the arrow
    
    //Variables:
    //RsiPeriod: number of bars to calculare RSI value
    //RsiOverSold: Oversold Level
    //RsiOverBought: OverBought Level
    //MinBarRange: minimum distance from two consecutive RSI Highs or RSI Lows
    RsiPeriod=10
    RsiOverSold=30
    RsiOverBought=70
    MinBarRange=3
    Rge = averagetruerange[10](close)
    MyRSI = rsi[RsiPeriod](Close)
    
    ONCE ShiftText = 3
    
    RsiMax = MyRSI < MyRSI[1] and MyRSI[1] > MyRSI[2] and MyRSI[1] > RsiOverBought
    RsiMin = MyRSI > MyRSI[1] and MyRSI[1] < MyRSI[2] and MyRSI[1] < RsiOverSold
    
    X=0
    if RsiMax then
    RSIMax1 = MyRSI[1]
    High1 = High[1]
    for I = MinBarRange to  80
    if RsiMax[I] then
    RSIMax2 = MyRSI[I + 1]
    High2 = High[I + 1]
    If High1 > High2 and RSIMax1 < RSIMax2 then
    X=-1
    endif
    break
    endif
    next
    endif
    
    if RsiMin then
    RSIMin1 = MyRSI[1]
    Low1 = Low[1]
    for I = MinBarRange to  80
    if RSIMin[I] then
    RSIMin2 = MyRSI[I + 1]
    Low2 = Low[I + 1]
    If Low1 < Low2 and RSIMin1 > RSIMin2 then
    X=1
    endif
    break
    endif
    next
    endif
    
    
    //heiken ashi
    xClose = (Open+High+Low+Close)/4
    if(barindex>2) then
    xOpen= (xOpen[1] + xClose[1])/2
    xHigh= Max(xOpen, xClose)
    xLow= Min(xOpen, xClose)
    endif
    
    y=0
    If X=1 and xOpen<xclose then
    Y = 1
    ELSIF X[1]=1 and xOpen<xclose then
    Y= 0.5
    endif
    
    If X=-1 and xOpen>xclose then
    Y = -1
    ELSIF X[1]=-1 and xOpen>xclose then
    Y= -0.5
    endif
    
    if y>0 then 
    r=0
    g=255
    endif
    if y<0 then 
    r=255
    g=0
    endif 
    
    return Y style(histogram) coloured(r,g,0)
    divergences-avec-heikin-ashi.png divergences-avec-heikin-ashi.png
    #211838 quote
    rebreb
    Participant
    Master

    C’est ce que je n’arrivait pas à coder
    Merci beaucoup Nicolas

Viewing 5 posts - 1 through 5 (of 5 total)
  • You must be logged in to reply to this topic.

ProRealAI ProRealAI New

Stuck on this ProBuilder code?

Describe what this topic is trying to build, in plain English, and ProRealAI writes the ProRealTime™ indicator, screener or system for you.

Available in 7 languages
Try ProRealAI

Indicateur RSI divergence +HA


ProBuilder : Indicateurs & Outils Personnalisés

New Reply
Author
author-avatar
reb @reb Participant
Summary

This topic contains 4 replies,
has 2 voices, and was last updated by rebreb

3 years, 6 months ago.

Topic Details
Forum: ProBuilder : Indicateurs & Outils Personnalisés
Language: French
Started: 03/18/2023
Status: Active
Attachments: 5 files
ProRealCode ProRealCode
Loading...