


Indicateur PPivot tracé sur une période

Viewing 3 posts - 1 through 3 (of 3 total)
  • Author
    Posts
  • #66138 quote
    FaabiienFaabiien
    Participant
    Junior

    Bonjour,

    J’utilise un indicateur Point pivot pour tracer manuellement les point pivot du cash.

    Lorsque je trace les PP J, H ou M, les lignes sont tracées  sur toutes les périodes.

    1. Est-ce possible de ne tracer que sur un jour, une semaine, un mois?
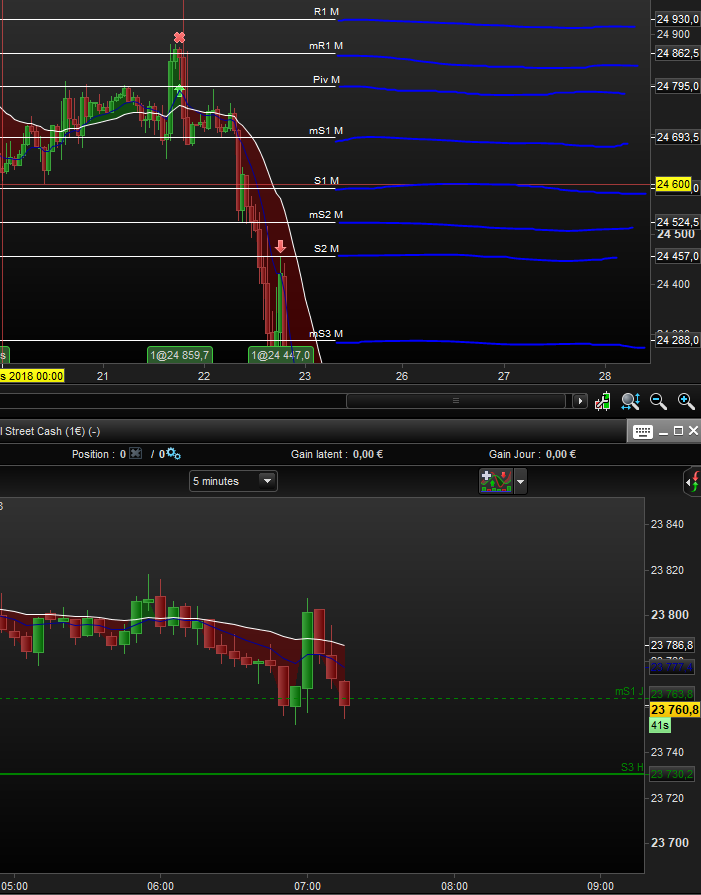
    2. Est-il possible de tracer en continu à droite du prix? (trait bleu sur mon image jointe)

    En résumé, je cherche à reproduire le rendu de l’indicateur PP de Prorealtime avec mes données (H, B, C).


    DefParam DrawOnLastBarOnly = true
    
    Haut=24998
    Bas=24660
    C=24727
    
    Voffset =15
    
    Pivot = (Haut+Bas+C) / 3
    R3=Pivot + ((Haut - Bas)*2)
    R22= Pivot + Haut - Bas
    R1 = (2 * Pivot) - Bas
    S1 = (2 * Pivot) - Haut
    S2 = Pivot - (Haut - Bas)
    S3 = Pivot - ((Haut - Bas)*2)
    
    mR1=Pivot+(R1-Pivot)/2
    mR2=R1+(R22-R1)/2
    mR3=R22+(R3-R22)/2
    mS1=Pivot-(Pivot-S1)/2
    mS2=S1-(S1-S2)/2
    mS3=S2-(S2-S3)/2
    
    //draw pivot points text
    DRAWTEXT("Piv M",barindex-2,Pivot+Voffset,SansSerif,Standard)
    DRAWTEXT("R3 M",barindex-2,R3+Voffset,SansSerif,Standard)
    DRAWTEXT("mR3 M",barindex-2,mR3+Voffset,SansSerif,Standard)
    DRAWTEXT("R2 M",barindex-2,R22+Voffset,SansSerif,Standard)
    DRAWTEXT("mR2 M",barindex-2,mR2+Voffset,SansSerif,Standard)
    DRAWTEXT("R1 M",barindex-2,R1+Voffset,SansSerif,Standard)
    DRAWTEXT("mR1 M",barindex-2,mR1+Voffset,SansSerif,Standard)
    DRAWTEXT("S1 M",barindex-2,S1+Voffset,SansSerif,Standard)
    DRAWTEXT("mS1 M",barindex-2,mS1+Voffset,SansSerif,Standard)
    DRAWTEXT("S2 M",barindex-2,S2+Voffset,SansSerif,Standard)
    DRAWTEXT("mS2 M",barindex-2,mS2+Voffset,SansSerif,Standard)
    DRAWTEXT("S3 M",barindex-2,S3+Voffset,SansSerif,Standard)
    DRAWTEXT("mS3 M",barindex-2,mS3+Voffset,SansSerif,Standard)
    
    return Pivot as "Pivot",R3 as "R3",mR3 as "mR3",R22 as "R2",mR2 as "mR2",R1 as "R1",mR1 as "mR1",S1 as "S1",mS1 as "mS1",S2 as "S2",mS2 as "mS2",S3 as "S3",mS3 as "mS3"
    
    Pivot.png Pivot.png
    #66142 quote
    NicolasNicolas
    Keymaster
    Legend

    Sujet déplacé dans le forum de programmation ProBuilder.

    Pour tracer sur la droite, il faudra utiliser des lignes horizontales, avec l’instruction DRAWLINE

    Il y a d’ailleurs un exemple pour tracer les points pivots de la façon dont tu le souhaites dans ce lien de notre documentation en ligne. Bon courage.

    Faabiien thanked this post
    #66163 quote
    FaabiienFaabiien
    Participant
    Junior

    Yes merci, l’option DRAWLINE me convient très bien!

    D’autant plus que lorsque je fais une mise à l’échelle du graphique, le zoom se fait correctement 🙂

Viewing 3 posts - 1 through 3 (of 3 total)

  • You must be logged in to reply to this topic.

ProRealAI ProRealAI New

Stuck on this ProBuilder code?

Describe what this topic is trying to build, in plain English, and ProRealAI writes the ProRealTime™ indicator, screener or system for you.

Available in 7 languages
Try ProRealAI

Indicateur PPivot tracé sur une période


ProBuilder : Indicateurs & Outils Personnalisés

New Reply
Author
author-avatar
Faabiien @faabiien Participant
Summary

This topic contains 2 replies,
has 2 voices, and was last updated by FaabiienFaabiien

8 years, 6 months ago.

Topic Details
Forum: ProBuilder : Indicateurs & Outils Personnalisés
Language: French
Started: 03/23/2018
Status: Active
Attachments: 1 files
ProRealCode ProRealCode
Loading...

