// …but credit is always nice 🙂
//@version=4
//@author=JayRogers
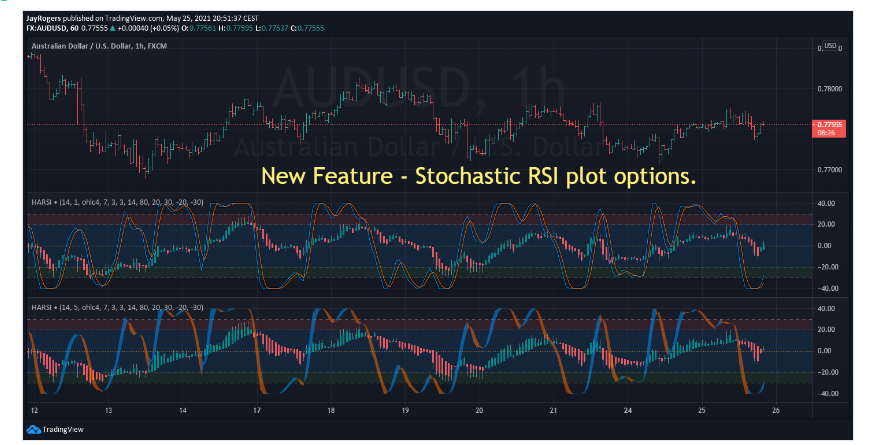
study( “Heikin Ashi RSI Oscillator”, “HARSI •”, false, format.price, 2 )
////////////////////////////////////////////////////////////////////////////////
// //
// ====== ABOUT THIS INDICATOR //
// //
// – RSI based Heikin Ashi candle oscillator //
// //
// ====== ARTICLES and FURTHER READING //
// //
// – https://www.investopedia.com/terms/h/heikinashi.asp //
// //
// “Heikin-Ashi is a candlestick pattern technique that aims to reduce //
// some of the market noise, creating a chart that highlights trend //
// direction better than typical candlestick charts” //
// //
// ====== REASON FOR STUDY //
// //
// – Mostly experimental. I wanted to see if I could translate RSI into a //
// Heikin Ashi function and retain it’s oscillating nature. That goal //
// was met more easily than I anticipated with quite delightful results. //
// //
// ====== DISCLAIMER //
// //
// Any trade decisions you make are entirely your own responsibility. //
// I’ve made an effort to squash all the bugs, but you never know! //
// //
////////////////////////////////////////////////////////////////////////////////
////////////////////////////////////////////////////////////////////////////////
// //
// ====== TOOLTIPS ====== //
// //
////////////////////////////////////////////////////////////////////////////////
string TT_HARSI = “Period for the RSI calculations used to generate the” +
“candles. This seperate from the RSI plot/histogram length.”
string TT_PBIAS = “Smoothing feature for the OPEN of the HARSI candles.” +
“\n\nIncreases bias toward the prior open value which can” +
” help provide better visualisation of trend strength.” +
“\n\n** By changing the Open values, High and Low can also” +
” be distorted – however Close will remain unchanged.”
string TT_SMRSI = “This option smoothes the RSI in a manner similar to HA” +
” open, but uses the realtime rsi rather than the prior” +
” close value.”
string TT_STOCH = “Uses the RSI generated by the above settings, and as such” +
” will be affected by the smoothing option.”
string TT_STFIT = “Adjusts the vertical scaling of the stochastic, can help” +
” to prevent distortion of other data in the channel.” +
“\n\nHas no impact cross conditions.”
////////////////////////////////////////////////////////////////////////////////
// //
// ====== INPUTS ====== //
// //
////////////////////////////////////////////////////////////////////////////////
// — Candle config
string GROUP_CAND = “Config » HARSI Candles”
i_lenHARSI = input( 14, “Length”, input.integer, group = GROUP_CAND,
minval = 1, tooltip = TT_HARSI )
i_smoothing = input( 1, “Open Smoothing”, input.integer, group = GROUP_CAND,
minval = 1, maxval = 100, tooltip = TT_PBIAS )
string INLINE_COL = “Colour Pallette”
i_colUp = input( color.teal, “Colour Pallette ”, input.color, group = GROUP_CAND, inline = INLINE_COL )
i_colDown = input( color.red, ” “, input.color, group = GROUP_CAND, inline = INLINE_COL )
i_colWick = input( color.gray, ” “, input.color, group = GROUP_CAND, inline = INLINE_COL )
// — RSI plot config
string GROUP_PLOT = “Config » RSI Plot”
i_source = input( ohlc4, “Source”, input.source, group = GROUP_PLOT )
i_lenRSI = input( 7, “Length”, input.integer, group = GROUP_PLOT,
minval = 1 )
i_mode = input( true, “Smoothed Mode RSI?”, input.bool, group = GROUP_PLOT,
tooltip = TT_SMRSI )
i_showPlot = input( true, “Show RSI Plot?”, input.bool, group = GROUP_PLOT )
i_showHist = input( true, “Show RSI Histogram?”, input.bool, group = GROUP_PLOT )
// — Stochastic RSI plots config
string GROUP_STOCH = “Config » Stochastic RSI Plot”
string INLINE_STDS = “Stoch Draw States”
i_showStoch = input( false, “Show Stochastic? ”, input.bool, group = GROUP_STOCH, inline = INLINE_STDS,
tooltip = TT_STOCH )
i_ribbon = input( true, “Ribbon?”, input.bool, group = GROUP_STOCH, inline = INLINE_STDS )
i_smoothK = input( 3, “Smoothing K”, input.integer, group = GROUP_STOCH,
minval = 1 )
i_smoothD = input( 3, “Smoothing D”, input.integer, group = GROUP_STOCH,
minval = 1 )
i_stochLen = input( 14, “Stochastic Length”, input.integer, group = GROUP_STOCH,
minval = 1 )
i_stochFit = input( 80, “Stoch Scaling %”, input.integer, group = GROUP_STOCH,
minval = 1, maxval = 100, tooltip = TT_STFIT )
// — Channel OB/OS config
string GROUP_CHAN = “Config » OB/OS Boundaries”
i_upper = input( 20, “OB”, input.integer, group = GROUP_CHAN, inline = “OB”,
minval = 1, maxval = 50 )
i_upperx = input( 30, “OB Extreme”, input.integer, group = GROUP_CHAN, inline = “OB”,
minval = 1, maxval = 50 )
i_lower = input( -20, “OS”, input.integer, group = GROUP_CHAN, inline = “OS”,
minval = -50, maxval = -1 )
i_lowerx = input( -30, “OS Extreme”, input.integer, group = GROUP_CHAN, inline = “OS”,
minval = -50, maxval = -1 )
////////////////////////////////////////////////////////////////////////////////
// //
// ====== FUNCTIONS ====== //
// //
////////////////////////////////////////////////////////////////////////////////
// zero median rsi helper function, just subtracts 50.
f_zrsi( _source, _length ) => rsi( _source, _length ) – 50
// zero median stoch helper function, subtracts 50 and includes % scaling
f_zstoch( _source, _length, _smooth, _scale ) =>
float _zstoch = stoch( _source, _source, _source, _length) – 50
float _smoothed = sma( _zstoch, _smooth )
float _scaled = ( _smoothed / 100 ) * _scale
// mode selectable rsi function for standard, or smoothed output
f_rsi( _source, _length, _mode ) =>
// get base rsi
float _zrsi = f_zrsi( _source, _length )
// smoothing in a manner similar to HA open, but rather using the realtime
// rsi in place of the prior close value.
var float _smoothed = na
_smoothed := na( _smoothed[1] ) ? _zrsi : ( _smoothed[1] + _zrsi ) / 2
// return the requested mode
_mode ? _smoothed : _zrsi
// RSI Heikin-Ashi generation function
f_rsiHeikinAshi( _length ) =>
// get close rsi
float _closeRSI = f_zrsi( close, _length )
// emulate “open” simply by taking the previous close rsi value
float _openRSI = nz( _closeRSI[1], _closeRSI )
// the high and low are tricky, because unlike “high” and “low” by
// themselves, the RSI results can overlap each other. So first we just go
// ahead and get the raw results for high and low, and then..
float _highRSI_raw = f_zrsi( high, _length )
float _lowRSI_raw = f_zrsi( low, _length )
// ..make sure we use the highest for high, and lowest for low
float _highRSI = max( _highRSI_raw, _lowRSI_raw )
float _lowRSI = min( _highRSI_raw, _lowRSI_raw )
// ha calculation for close
float _close = ( _openRSI + _highRSI + _lowRSI + _closeRSI ) / 4
// ha calculation for open, standard, and smoothed/lagged
var float _open = na
_open := na( _open[ i_smoothing ] ) ? ( _openRSI + _closeRSI ) / 2 :
( ( _open[1] * i_smoothing ) + _close[1] ) / ( i_smoothing + 1 )
// ha high and low min-max selections
float _high = max( _highRSI, max( _open, _close ) )
float _low = min( _lowRSI, min( _open, _close ) )
// return the OHLC values
[ _open, _high, _low, _close ]
////////////////////////////////////////////////////////////////////////////////
// //
// ====== SERIES, LINES and LABELS ====== //
// //
////////////////////////////////////////////////////////////////////////////////
// standard, or ha smoothed rsi for the line plot and/or histogram
float RSI = f_rsi( i_source, i_lenRSI, i_mode )
// stoch stuff
float StochK = f_zstoch( RSI, i_stochLen, i_smoothK, i_stochFit )
float StochD = sma( StochK, i_smoothD )
// get OHLC values to use in the plotcandle()
[ O, H, L, C ] = f_rsiHeikinAshi( i_lenHARSI )
// candle body colouring
color bodyColour = C > O ? i_colUp : i_colDown
color wickColour = i_colWick
// shadow, invisible
color colShadow = color.rgb( 0, 0, 0, 20 )
color colNone = color.rgb( 0, 0, 0, 100 )
// rsi color
color colRSI = color.rgb( 250, 200, 50, 0 )
// stoch ribbon fill
color colStochK = color.new( #0094FF, 0 )
color colStochD = color.new( #FF6A00, 0 )
color colStochFill = StochK >= StochD ? color.new( colStochK, 50 ) : color.new( colStochD, 50 )
////////////////////////////////////////////////////////////////////////////////
// //
// ====== DRAWING and PLOTTING ====== //
// //
////////////////////////////////////////////////////////////////////////////////
// zero median RSI channel hlines
upperx = hline( i_upperx, “OB Extreme”, color.new( color.silver, 60 ) )
upper = hline( i_upper, “OB”, color.new( color.silver, 80 ) )
median = hline( 0, “Median”, color.orange, hline.style_dotted )
lower = hline( i_lower, “OS”, color.new( color.silver, 80 ) )
lowerx = hline( i_lowerx, “OS Extreme”, color.new( color.silver, 60 ) )
// channel fill
fill( upper, upperx, color.new( color.red, 90 ), title = “Background Fill OB” )
fill( upper, lower, color.new( color.blue, 90 ), title = “Background Channel” )
fill( lower, lowerx, color.new( color.green, 90 ), title = “Background Fill OS” )
// histogram first, so it is on the bottom of the plot/candle draw stack
plot( i_showHist ? RSI : na, “RSI Histogram”, color.new( color.silver, 80 ), 1, plot.style_histogram )
// make our HA rsi candles
plotcandle( O, H, L, C, “HARSI”, bodyColour, wickColour, bordercolor = bodyColour )
// RSI overlay plot
plot( i_showPlot ? RSI : na, “RSI Shadow”, colShadow, 3 )
plot_rsi = plot( i_showPlot ? RSI : na, “RSI Overlay”, colRSI, 1 )
// Stochastic RSI plots and fill
plot( i_showStoch ? StochK : na, “Stoch K Shadow”, not i_ribbon ? colShadow : colNone, 3 )
plot( i_showStoch ? StochD : na, “Stoch D Shadow”, not i_ribbon ? colShadow : colNone, 3 )
plot_stochK = plot( i_showStoch ? StochK : na, “Stoch K”, not i_ribbon ? colStochK : colNone, 1 )
plot_stochD = plot( i_showStoch ? StochD : na, “Stoch D”, not i_ribbon ? colStochD : colNone, 1 )
fill( plot_stochK, plot_stochD, i_ribbon ? colStochFill : na )
// — PEANUT