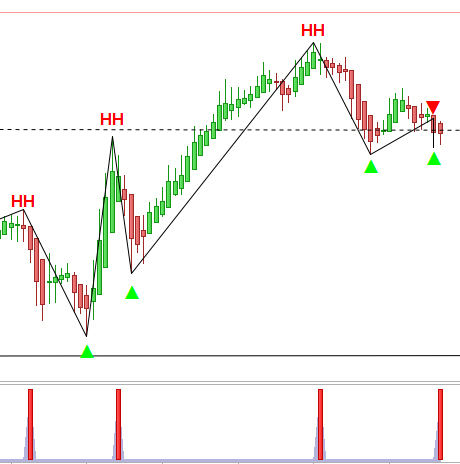
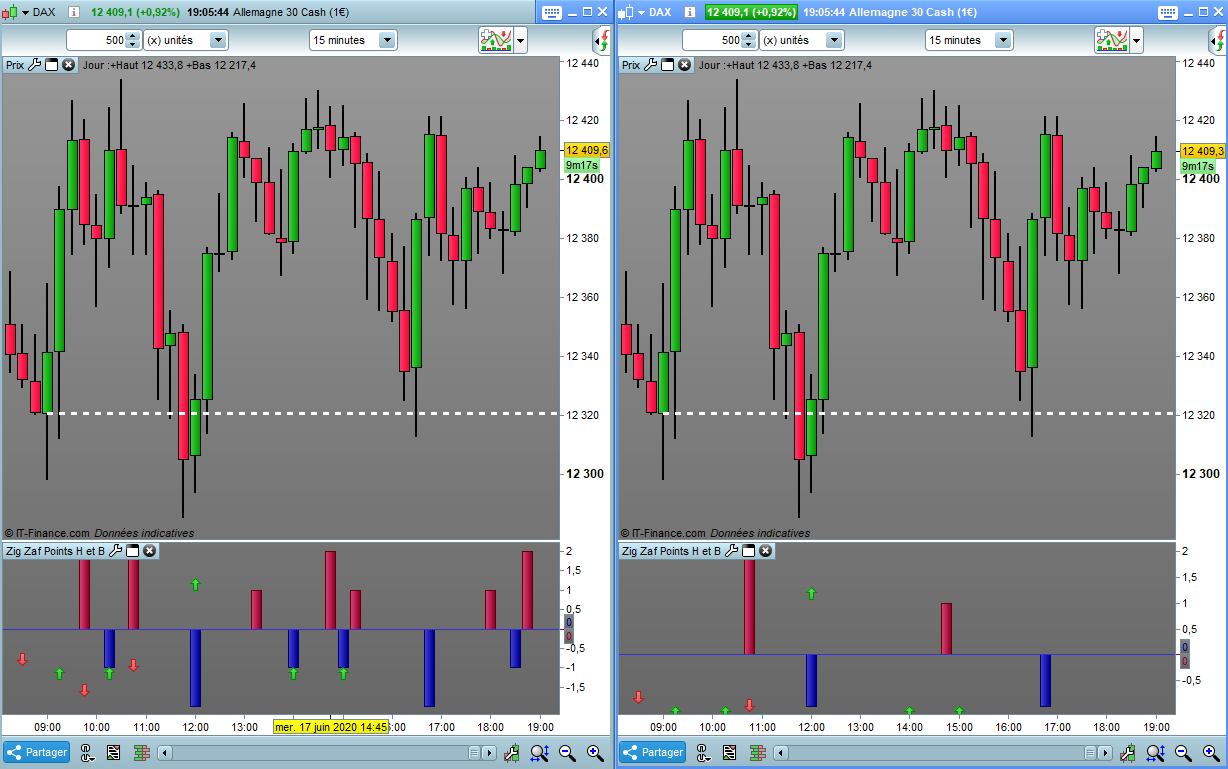
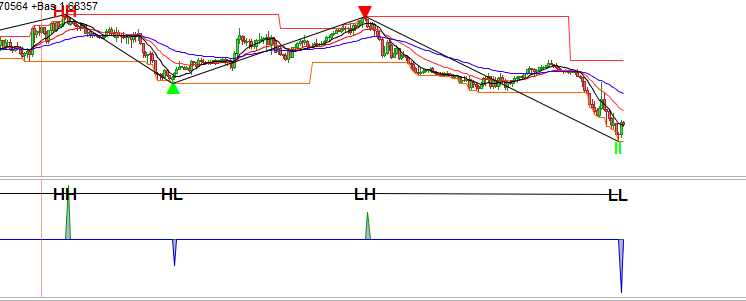
Bonjour,
Faisant suite à l’excellent indicateur des +haut et +bas zig-zag du post https://www.prorealcode.com/topic/help-with-higher-high-lower-low-price-swing-indicator-and-segment-drawings/.
Je tente de prendre ce code pour en créer un second en parallèle sous le graph, mais sans succès.
J’ai tenté pour le hauts et les bas, si :
LH > signal = 1
HH > signal = 2
HL > bas = -1
LL > bas = -2
Les hauts seulement s’affichent dans un même signal… et les + bas ne s’affichent même pas… bref c’est la cata….
Ci-joint la photo de mon resultat qui n’est pas bon.
Merci beaucoup 🙂
Voici le code d’origine ainsi que mes modifs:
//https://www.prorealcode.com/topic/help-with-higher-high-lower-low-price-swing-indicator-and-segment-drawings/#post-80673
//plus haut, et un plus haut plus bas fait allusion à une possible inversion de tendance vers le haut
percent = 0.5
zzh = ZigZag[percent](high)
zzl = zigzag[percent](low)
//
top = zzh<zzh[1] and zzh[1]>zzh[2]
bot = zzl>zzl[1] and zzl[1]<zzl[2]
//once lastzz=1
//atr = averagetruerange[10]
//peaks
if top then
//segment
//if lastzz<0 then
//drawsegment(barindex[1],zzh[1],prevlbar,prevl)
//LH == plus bas haut
if zzh[1]<prevh then
//drawtext("LH",barindex[1],zzh[1]+atr/2,dialog,bold,16)
signal = 1
else
//HH == haut
//drawtext("HH",barindex[1],zzh[1]+atr/2,dialog,bold,16)coloured(255,0,0)
signal = 2
endif
else
signal = 0
endif
//lastzz=1
//prevhbar=barindex[1]
prevh=zzh[1]
//endif
//troughs
if bot then
////segment
if lastzz>0 then
//drawsegment(barindex[1],zzl[1],prevhbar,prevh)
//HL
if zzl[1]>prevl then
bas=-1
// drawtext("▲",barindex[1],zzl[1]-atr/2,dialog,bold,16)coloured(0,255,0)
else
//LL
bas=-2
//drawtext("ll",barindex[1],zzl[1]-atr/2,dialog,bold,16)coloured(0,255,0)
endif
else
bas=0
//drawsegment(barindex[1],zzl[1],prevlbar,prevl)
endif
lastzz=-1
//prevlbar=barindex[1]
prevl=zzl[1]
endif
return signal , bas