Indicador sweep internacional tradingview

Viewing 15 posts - 1 through 15 (of 16 total)
  • Author
    Posts
  • #228909 quote
    deletedaccount22102025
    Participant
    New

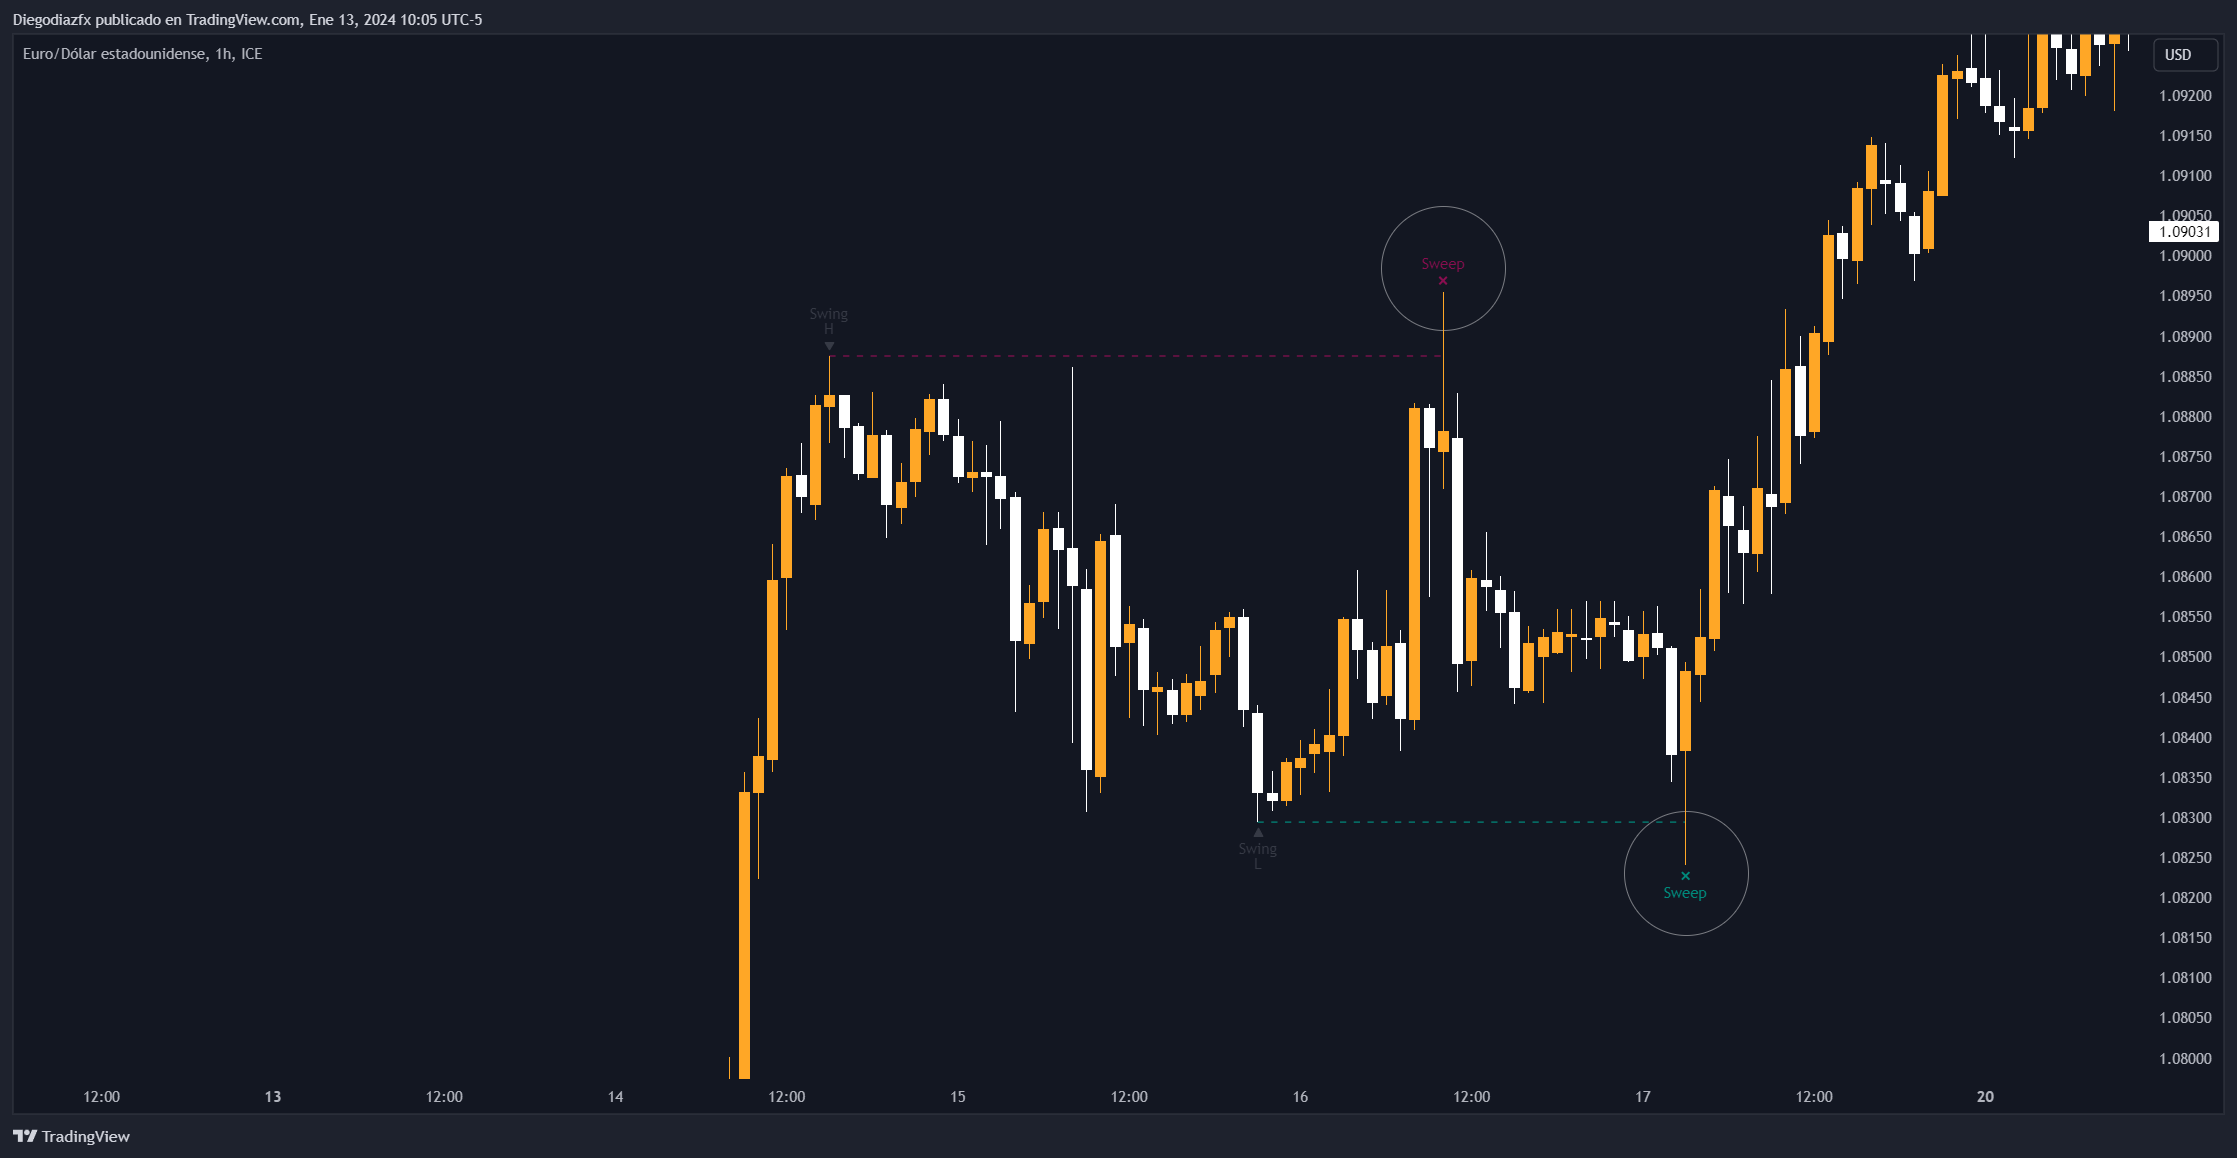
    Hola todos, me podéis ayudar a transcribir el siguiente indicador de Tradingview llamado Sweep Institutional. Gracias

    //@version=5
    indicator(‘Sweep institutional’, overlay=true, max_lines_count=500, max_labels_count = 500)
    //INPUTS
    cooldownPeriod = input.int(10,title=”Cooldown Period”, minval=0, group = “Settings”)
    lbLeft = 20
    lbRight = 20
    showSwing = input.bool(true,title=”Show Swings?”, inline=”s_1″, group = ‘Swing Detaction’)
    swingClr = input.color(color.new(color.black, 0), title=”, inline=”s_1″, group = ‘Swing Detaction’)
    bullWidth = input.int(1, title=’Line Width:’, group=’Bullish Sweep’)
    bullStyle = input.string(‘Dashed’, title=’Line Style:’, options=[‘Solid’, ‘Dotted’, ‘Dashed’], group=’Bullish Sweep’)
    bullColor = input.color(color.new(color.teal, 0), title=’Bullish Color:’, group=’Bullish Sweep’)
    bearWidth = input.int(1, title=’Line Width:’, group=’Bearish Sweep’)
    bearStyle = input.string(‘Dashed’, title=’Line Style:’, options=[‘Solid’, ‘Dotted’, ‘Dashed’], group=’Bearish Sweep’)
    bearColor = input.color(color.new(color.maroon, 0), title=’Bearish Color:’, group=’Bearish Sweep’)
    //FUNCTIONS
    lineStyle(s) =>
        if s == ‘Solid’
            line.style_solid
        else if s == ‘Dotted’
            line.style_dotted
        else
            line.style_dashed
    //VARS
    var int bullSignalIndex = 0
    var int bearSignalIndex = 0
    var line bullLine = na
    var line bearLine = na
    var line highLine = na
    var line lowLine = na
    var label swingHighLbl = na
    var label swingLowLbl = na
    var label swingHighLblTxt = na
    var label swingLowLblTxt = na
    var float swingLowVal = na
    var float swingHighVal = na
    //CALCULATIONS
    pLow = ta.pivotlow(low, lbLeft, lbRight)
    pHigh = ta.pivothigh(high, lbLeft, lbRight)
    pLowVal = ta.valuewhen(not na(pLow), low[lbRight], 0)
    pHighVal = ta.valuewhen(not na(pHigh), high[lbRight], 0)
    prevLowIndex = ta.valuewhen(not na(pLow), bar_index[lbRight], 0)
    prevHighIndex = ta.valuewhen(not na(pHigh), bar_index[lbRight], 0)
    lp = ta.lowest(low, lbLeft)
    hp = ta.highest(high, lbLeft)
    highestClose = ta.highest(close, lbLeft)
    lowestClose = ta.lowest(close, lbLeft)
    bullishSFP = low < pLowVal and close > pLowVal and open > pLowVal and low == lp and lowestClose >= pLowVal
    bearishSFP = high > pHighVal and close < pHighVal and open < pHighVal and high == hp and highestClose <= pHighVal
    bullCond = bullishSFP[3] and (close > pLowVal) and  (close[1] > pLowVal[1]) and (close[2] > pLowVal[2]) and bar_index >= bullSignalIndex + cooldownPeriod
    bearCond = bearishSFP[3] and (close < pHighVal) and  (close[1] < pHighVal[1]) and (close[2] < pHighVal[2]) and bar_index >= bearSignalIndex + cooldownPeriod
    //Check Swing H/L Stopper
    var int swingLowCounter = 0
    var int swingHighCounter = 0
    var bool isSwingLowCheck = false
    var bool isSwingHighCheck = false
    var bool stopPrintingLow = false
    var bool stopPrintingHigh = false
    if high < swingLowVal and isSwingLowCheck
        swingLowCounter := swingLowCounter+1
    if low > swingHighVal and isSwingHighCheck
        swingHighCounter := swingHighCounter+1
    if ta.crossunder(close, swingLowVal) and isSwingLowCheck == false
        isSwingLowCheck := true
        swingLowCounter := 1
    if ta.crossover(close, swingHighVal) and isSwingHighCheck == false
        isSwingHighCheck := true
        swingHighCounter := 1
    if swingLowCounter == 5 and isSwingLowCheck
        stopPrintingLow := true
        isSwingLowCheck := false
        line.set_x2(lowLine,bar_index[4])
    if swingHighCounter == 5 and isSwingHighCheck
        stopPrintingHigh := true
        isSwingHighCheck := false
        line.set_x2(highLine,bar_index[4])
    //Draw sweep lines
    if bullCond
        bullSignalIndex := bar_index
        bullLine := line.new(prevLowIndex, pLowVal, bar_index-3, pLowVal, color=bullColor, width=bullWidth, style=lineStyle(bullStyle))
    if bearCond
        bearSignalIndex := bar_index
        bearLine := line.new(prevHighIndex, pHighVal, bar_index-3, pHighVal, color=bearColor, width=bearWidth, style=lineStyle(bearStyle))
    var swingHighArr = array.new_label(0)
    var swingHighTextArr = array.new_label(0)
    var swingLowArr = array.new_label(0)
    var swingLowTextArr = array.new_label(0)
    if array.size(swingHighArr) >= 3
        label.delete(array.shift(swingHighArr))
        label.delete(array.shift(swingHighTextArr))
    if array.size(swingLowArr) >= 3
        label.delete(array.shift(swingLowArr))
        label.delete(array.shift(swingLowTextArr))
    //Draw range lines
    if showSwing
        ifstopPrintingHigh==false
            line.set_x2(highLine,bar_index+5)
        if stopPrintingLow == false
            line.set_x2(lowLine,bar_index+5)
    if showSwing and not na(pHigh) and bearishSFP[lbRight] == false
        stopPrintingHigh := false
        swingHighVal := high[lbRight]
        line.delete(highLine)
        highLine := line.new(bar_index[lbRight], high[lbRight], bar_index+10, high[lbRight], color = swingClr, width = 2)
        swingHighLbl := label.new(bar_index[lbRight], high[lbRight], text=””, yloc=yloc.abovebar, color = swingClr, textcolor = swingClr, style = label.style_triangledown, size = size.auto)
        swingHighLblTxt := label.new(bar_index[lbRight], high[lbRight], text=”Swing\nH”, yloc=yloc.abovebar, color = swingClr, textcolor = swingClr, style = label.style_none, size = size.small)
        array.push(swingHighArr, swingHighLbl)
        array.push(swingHighTextArr, swingHighLblTxt)
    if showSwing and not na(pLow) and bullishSFP[lbRight] == false
        stopPrintingLow := false
        swingLowVal := low[lbRight]
        line.delete(lowLine)
        lowLine := line.new(bar_index[lbRight], low[lbRight], bar_index+10, low[lbRight], color = swingClr, width = 2)
        swingLowLbl := label.new(bar_index[lbRight], low[lbRight], text=””, yloc=yloc.belowbar, color = swingClr, textcolor = swingClr, style = label.style_triangleup, size = size.auto)
        swingLowLblTxt := label.new(bar_index[lbRight], low[lbRight], text=”Swing\nL”, yloc=yloc.belowbar, color = swingClr, textcolor = swingClr, style = label.style_none, size = size.small)
        array.push(swingLowArr, swingLowLbl)
        array.push(swingLowTextArr, swingLowLblTxt)
    //PLOTS
    plotshape(bullCond, text=’Sweep’, color=bullColor, textcolor=bullColor, location=location.belowbar, offset = -3)
    plotshape(bearCond, text=’Sweep’, color=bearColor, textcolor=bearColor, location=location.abovebar, offset = -3)
    //ALERTS
    alertcondition(bullishSFP, title=’Bullish Sweep’, message='{{ticker}} Bullish Sweep, Price:{{close}}’)
    alertcondition(bearishSFP, title=’Bearish Sweep’, message='{{ticker}} Bearish Sweep, Price:{{close}}’)
    Fj3MZ7n6.png Fj3MZ7n6.png
    #228942 quote
    Iván González
    Moderator
    Master

    Muy buenas

    Aquí tienes el código:


    //PRC_Sweep Institucional
    //version = 0
    //28.02.24
    //Iván González @ www.prorealcode.com
    //Sharing ProRealTime knowledge
    ///////////////////////////////////////////////
    /////////////inputs////////////////////////////
    cooldownPeriod =10 //"Cooldown Period"
    prd = 20
    src1 = low
    src2 = high
    showswing = 1
    ////////Calculations//////////////////////////
    /////pivots low
    if src1 > src1[prd] and lowest[prd](src1) > src1[prd] and src1[prd] < lowest[prd](src1)[prd+1] then
    $prevpivotlowy[lastset($prevpivotlowy)+1] = $pivotlowy[max(lastset($pivotlowy),1)]
    $prevpivotlowx[lastset($prevpivotlowx)+1] = $pivotlowx[max(lastset($pivotlowx),1)]
    $pivotlowy[lastset($pivotlowy)+1] = src1[prd]
    $pivotlowx[lastset($pivotlowx)+1] = barindex[prd]
    z = z + 1
    drawpoint(barindex[prd],src1[prd],1)coloured("White")
    drawtext("L",barindex[prd],src1[prd]-0.5*tr)coloured("green")
    endif
    /////pivots high
    if src2 < src2[prd] and highest[prd](src2)<src2[prd] and src2[prd]>highest[prd](src2)[prd+1] then
    $prevpivothighy[lastset($prevpivothighy)+1] = $pivothighy[max(lastset($pivothighy),1)]
    $prevpivothighx[lastset($prevpivothighx)+1] = $pivothighx[max(lastset($pivothighx),1)]
    $pivothighy[lastset($pivothighy)+1]=src2[prd]
    $pivothighx[lastset($pivothighx)+1]=barindex[prd]
    t=t+1
    drawpoint(barindex[prd],src2[prd],1)coloured("White")
    drawtext("H",barindex[prd],src2[prd]+0.5*tr)coloured("red")
    endif
    ////////////////////////////////////////////////////////
    pLow = $pivotlowy[max(1,lastset($pivotlowy))]
    pHigh = $pivothighy[max(1,lastset($pivothighy))]
    pLowindex = $pivotlowx[max(1,lastset($pivotlowx))]
    pHighindex = $pivothighx[max(1,lastset($pivothighx))]
    
    lp = lowest[prd](low)
    hp = highest[prd](high)
    lowestclose = lowest[prd](close)
    highestclose = highest[prd](close)
    
    ////////////////////////Sweep conditions///////////////////////////////////////////
    bullishSFP = low < pLow and close > pLow and open > pLow and low = lp and lowestClose >= pLow
    
    bearishSFP = high > pHigh and close < pHigh and open < pHigh and high = hp and highestClose <= pHigh
    
    bullCond = bullishSFP[3] and (close > pLow) and  (close[1] > pLow[1]) and (close[2] > pLow[2]) and barindex >= bullSignalIndex + cooldownPeriod
    
    bearCond = bearishSFP[3] and (close < pHigh) and  (close[1] < pHigh[1]) and (close[2] < pHigh[2]) and barindex >= bearSignalIndex + cooldownPeriod
    
    //Draw sweep lines
    if bullcond then
    bullsignalindex = barindex
    drawsegment(pLowindex,pLow,barindex[3],pLow)style(dottedline,2)coloured(120,255,120)
    drawtext("Sweep",barindex+1,plow-0.25*tr)coloured(120,255,120)
    elsif bearcond then
    bearSignalIndex = barindex
    drawsegment(pHighindex,pHigh,barindex[3],pHigh)style(dottedline,2)coloured(255,120,120)
    drawtext("Sweep",barindex+1,pHigh+0.25*tr)coloured(255,50,50)
    endif
    print bearSignalIndex+cooldownPeriod
    print barindex
    //Draw last Pivot High/Low line
    if islastbarupdate then
    if low > pHigh then
    x = barssince(low crosses over pHigh)
    drawsegment(pHighindex,pHigh,barindex-x,pHigh)style(line,2)coloured("red")
    elsif high < pLow then
    y = barssince(high crosses under pLow)
    drawsegment(pHighindex,pHigh,barindex-y,pLow)style(line,2)coloured("green")
    ELSE
    drawsegment(pHighindex,pHigh,barindex+10,pHigh)style(line,2)coloured("red")
    drawsegment(pLowindex,pLow,barindex+10,pLow)style(line,2)coloured("green")
    endif
    endif
    
    return 
    
    pror and thanked this post
    #228943 quote
    deletedaccount22102025
    Participant
    New

    Fabuloso Iván, tengo que decir que se ha notado tu incorporación al foro, ya había visto videos tuyos en youtube. Muchas gracias.

    #228982 quote
    Iván González
    Moderator
    Master

    de nada!!

    #228991 quote
    jacquesgermain
    Participant
    Senior

    Hola, en el código traducido, ¿ cómoswing=1 no sirve de nada?

    #228992 quote
    deletedaccount22102025
    Participant
    New

    No, aunque parece que podía tener una posible continuación en el código, en cuanto a poder reflejar una flecha para indicar un posible cambio de tendencia.

    #228995 quote
    Iván González
    Moderator
    Master

    Exacto… lo introduje al principio de la traducción de código y se me ha pasado borrarlo.

    jacquesgermain thanked this post
    #231423 quote
    Madrosat
    Participant
    Master

    hola iván
    ¿Tiene un ejemplo de una estrategia con este indicador?
    O cómo integrar la (H) (L) en una estrategia después de cuántas velas aparecen. No puedo entender bien este código.
    tu ayuda sería invaluable.
    Que tenga un buen día

    #231428 quote
    Iván González
    Moderator
    Master

    Hola
    No lo he utilizado en una estrategia. Me limité a traducir el código de tradingview a prt.
    Las H y L son pivot points, por lo tanto para que aparezcan tienen que ser los máximos y mínimos de las últimas “prd” velas por delante y por detrás.
    Una forma de integrarlo en un sistema sería aprovechar para introducir órdenes cuando se produzca el barrido (Sweep), ver líneas de código 54 a 63.

    #235116 quote
    deletedaccount22102025
    Participant
    New

    Disculpa Iván,

    cómo se desactiva la ventana que aparece en un indicador que se llama MODO DINÁMICO ?

    Gracias,

    Un saludo

    #235197 quote
    deletedaccount22102025
    Participant
    New

    Es que esa ventana es un coñazo cuando tienes varias abiertas y tener que estar cerrándolas cada vez que me pongo a trabajar.  Gracias de antemano Iván.

    #235724 quote
    deletedaccount22102025
    Participant
    New

    ????. PLEASEEE !!!

    #235728 quote
    Iván González
    Moderator
    Master

    Perdona…
    no sé a qué te refieres. Puedes mostrarlo con captura de pantalla?

    #235761 quote
    deletedaccount22102025
    Participant
    New

    Cuando adjuntas el indicador aparece esa ventana “Modo Dinámico” y es un coñazo muy gordo. Lo que necesito es que cuando use ese indicador no aparezca, por favor, esa ventana. Muchas gracias de antemano Iván. Cojonudo tu trabajo. Enhorabuena !!!

    Captura-de-pantalla-2024-07-25-122430.png Captura-de-pantalla-2024-07-25-122430.png
    #235775 quote
    Iván González
    Moderator
    Master

    ahhh….
    Abre el código y busca una línea que comience por print xxxxx.
    Puedes borrar esa línea.

Viewing 15 posts - 1 through 15 (of 16 total)
  • You must be logged in to reply to this topic.

Indicador sweep internacional tradingview


ProBuilder: Indicadores y Herramientas

New Reply
Summary

This topic contains 15 replies,
has 4 voices, and was last updated by deletedaccount22102025
1 year, 7 months ago.

Topic Details
Forum: ProBuilder: Indicadores y Herramientas
Language: Spanish
Started: 02/28/2024
Status: Active
Attachments: 2 files
Logo Logo
Loading...