Hi Deio, Sorry for the long delay due to family matters, I’ve only just been getting back into research in the last few weeks.
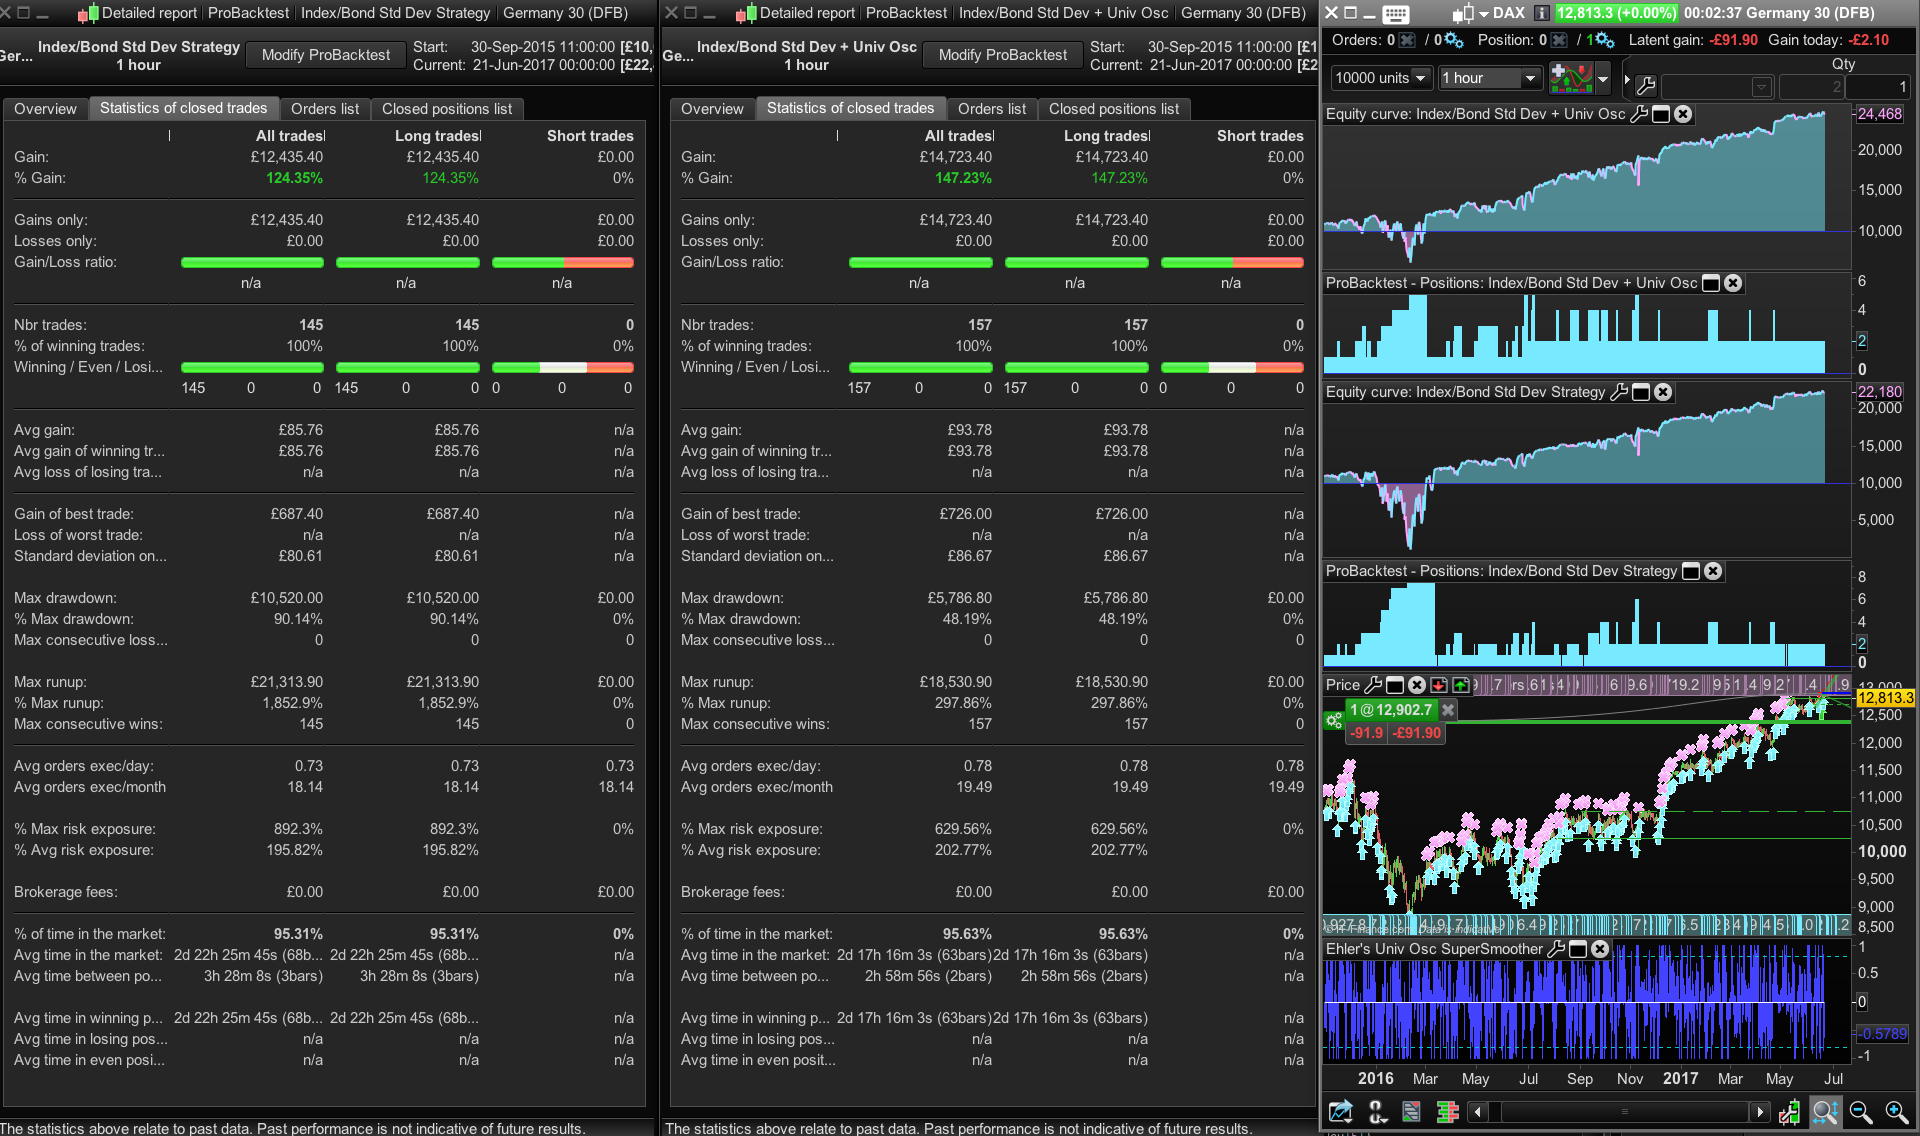
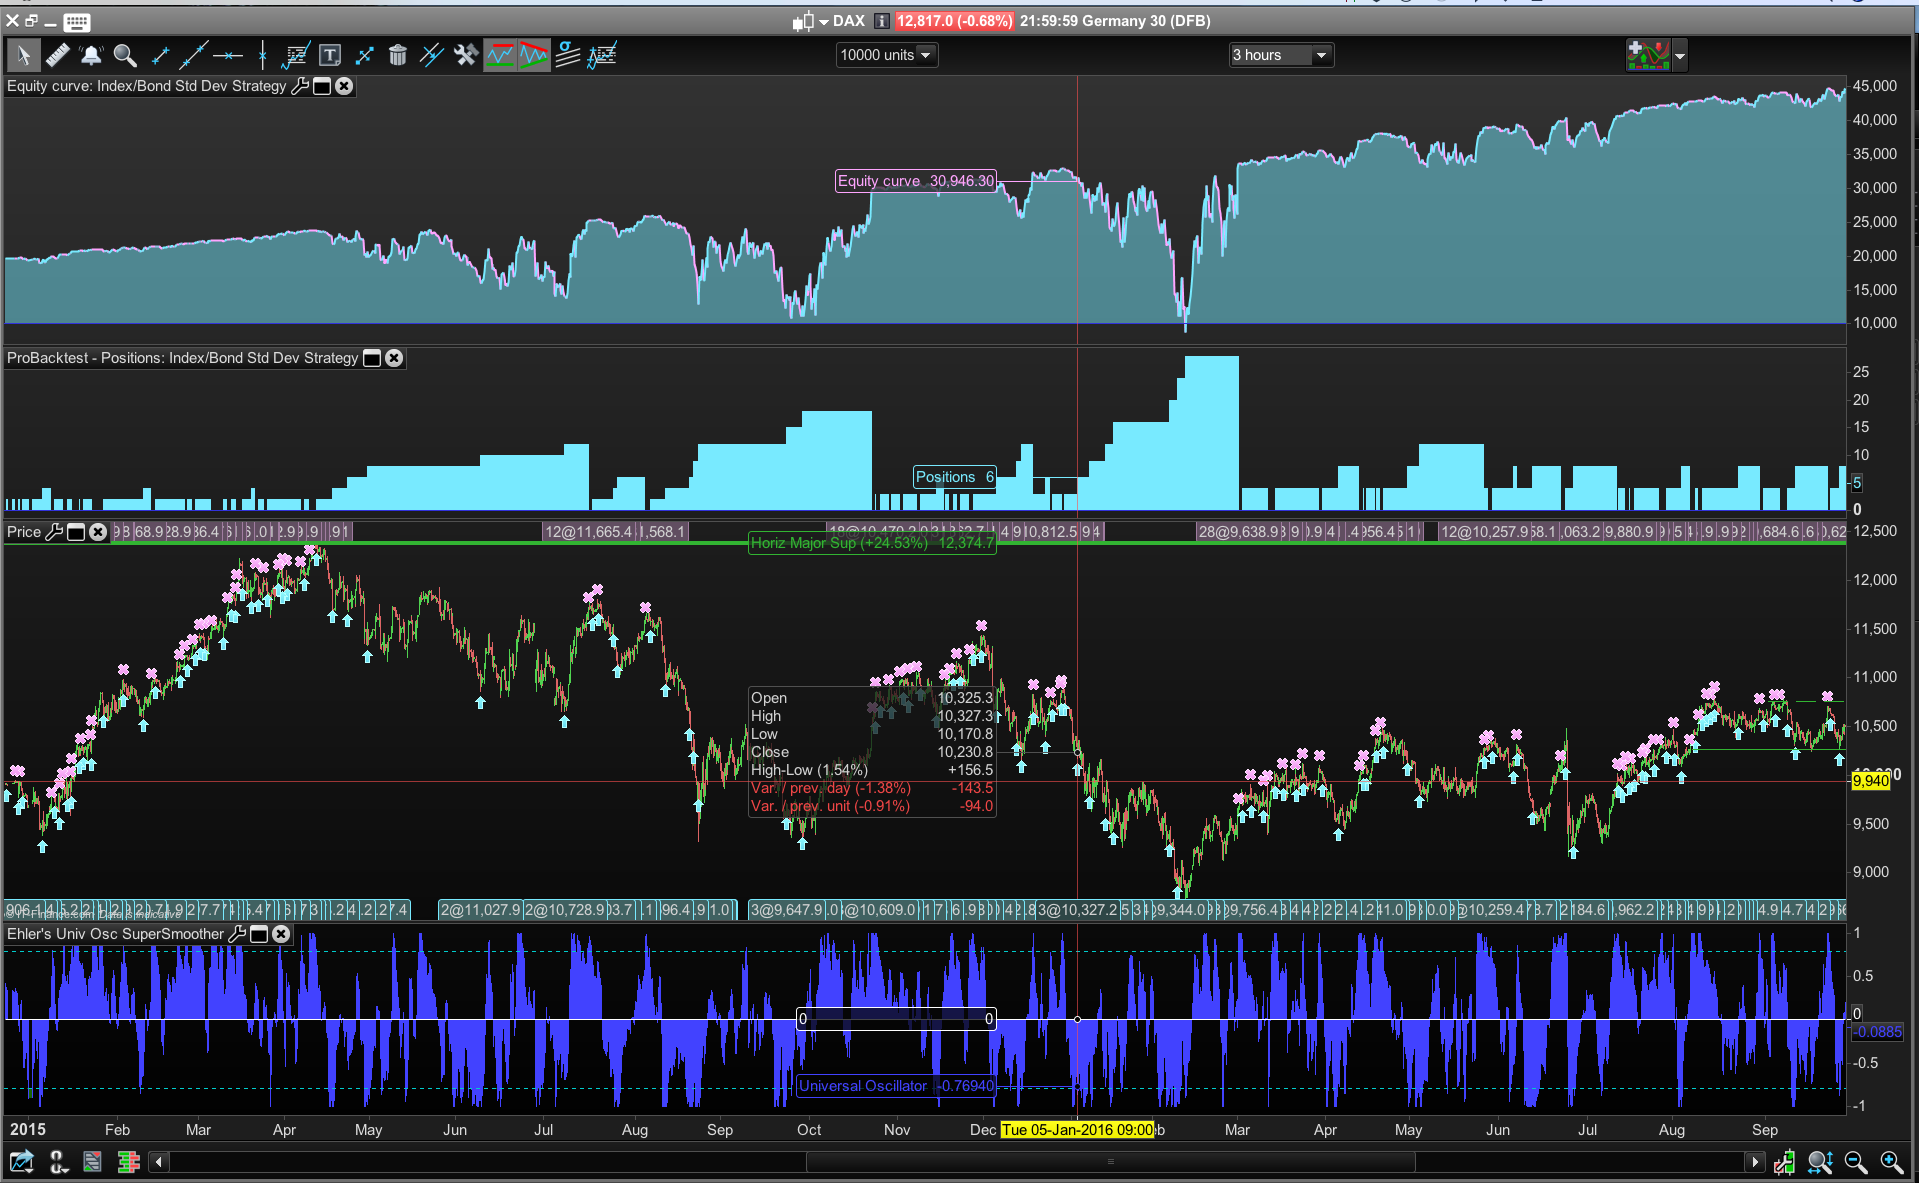
I thought about this strategy a lot. I tested it on many variations adding different indicators and altering parameters or hours traded and then tested it on other indexes. At times, you can get the profit up or the drawdown down in tests by adding the Ehler’s Universal Supersmoother Oscillator as a trend filter – but it still hasn’t totally stopped the system buying into steep declines and accumulating positions, although the Damiani Indicator can sometimes help on backtests with parameters:
//—settings
Viscosity=7 //Default=7 //try 5
Sedimentation=50 //Default 50 //try 60
Thresholdlevel=1.1 //Default 1.1
lagsupressor=1 //boolean value (default=true)
MAtype=2 //MA type variable (2=Weighted average) //Default 2
//—end of settings
(Nicolas kindly posted both the codes on this forum).
I don’t have reference to that particular exact Nikkei strategy mentioned in your original post but I changed the code slightly to something like this:
//-----------------------------------------------------------------------------------------------
//Deio
//TF a 12 h
//dax min 1 Eur.
//-----------------------------------------------------------------------------------------------
//TAKE PROFIT NEAR ZERO IN ORDER TO NOT ACCUMULATE TOO MUCH
//-----------------------------------------------------------------------------------------------
//IF NOT ON MARKET TRY TO ENTER AGAIN AS SOON A CORRECTION APPEARS, TRYING TO FOLLOW
//THE POTENTIAL CURRENT UPTREND
//-----------------------------------------------------------------------------------------------
//IF I BOUGHT THE PREVIOUS BAR DON'T BUY THE FOLLOWING BAR IN ORDER TO NOT ACCUMULATE TOO MUCH
//-----------------------------------------------------------------------------------------------
//MAIN PARAMETER IN ORDER TO CHANGE THE RISK LEVELS ARE:
//acc----> % of decrease of (price)of the instrument compared to the last buy price (THE LOWER IT
//IS THE MORE RISK AND CASH RETURN WILL OCCUR)
//-----------------------------------------------------------------------------------------------
//tp-----> % beyond which the entire position is closed (THE HIGHER IT IS AND MORE
// RISK AND CASH RETURN WILL APPEAR) - below zero is safer !
//-----------------------------------------------------------------------------------------------
//MONEY MANAGMENT "ANTIMARTINGALA" STYLE - I SUPPOSE CLEARER RESULTS ON A LONGER PERIOD OF BACKTEST
//-----------------------------------------------------------------------------------------------

DEFPARAM cumulateorders = true

TIMEWORK = 080000
TIMESTOP = 180000
acc = 2 //orig 5

if justone = 0 then
capital = 10000 * pointvalue
justone = 1
endif

perccap = 0.5 //0rig 0.5
margin = 0.5 * close * pointvalue / 100
period=5


// Conditions to enter long positions // Univ Osc Bandedge =25
indicator1, ignored = CALL "Ehler's Univ Osc SuperSmoother"
c1 = (indicator1 > -0.9)

// Conditions to enter long positions
indicator1, indicator2 = CALL "Damiani Volameter"(close)
c2 = (indicator1 > indicator2) //When Damiani is green


stdev=STD[period](close)
//LOOK FOR A LOCAL VOLATILITY DECREASE
//I WANT TO BUY AGAIN ONLY WHEN BEAR MARKET SHOWS A LOCAL PAUSE
if C1 AND C2 AND (stdev[0]+stdev[1]+stdev[2]+stdev[3]+stdev[4]) < (stdev[1]+stdev[2]+stdev[3]+stdev[4]+stdev[5]) then
SWBUY=1
else
SWBUY=0
ENDIF

//default Close > Close. Use <

IF TIME > TIMEWORK AND TIME < TIMESTOP THEN
if not onmarket then
sizebuy = ROUND((capital *perccap /100)/ margin)
tp = 0.25 //orig 0.25
IF CLOSE > CLOSE[100] THEN
BUY sizebuy SHARES AT MARKET
endif
endif

if LONGONMARKET then
perf = (close - POSITIONPRICE)/POSITIONPRICE * 100
if perf > tp then
SELL AT MARKET
perfc = (close - POSITIONPRICE) * POINTVALUE * COUNTOFPOSITION
capital = capital + PERFC
ELSE
IF LASTBARBUY = 0 THEN
if (((CLOSE-TRADEPRICE)/TRADEPRICE)*100) < -acc AND SWBUY=1 then
sizebuy = ROUND((capital *perccap /100)/ margin)
BUY sizebuy SHARES AT MARKET
LASTBARBUY = 1
ENDIF
ELSE
LASTBARBUY = 0
ENDIF
ENDIF
ENDIF
ENDIF
Note: I tried to add a graph of the std deviation but I am not sure it is correctly coded:
SWBUY = (stdev[0]+stdev[1]+stdev[2]+stdev[3]+stdev[4]) < (stdev[1]+stdev[2]+stdev[3]+stdev[4]+stdev[5])
Graph SWBUY=1
Creating code that stops the strategy from buying more positions if the equity curve is falling:
It occurred to me today that one way to stop it buying and accumulating positions in steep market declines maybe to add code that stops it doing that based on the equity curve. I have read threads on this forum that suggest that may not work, so what is needed is a “Black Swan” warning based on either a sharp momentum (proceeds price) move or very sharp increases in volatility.
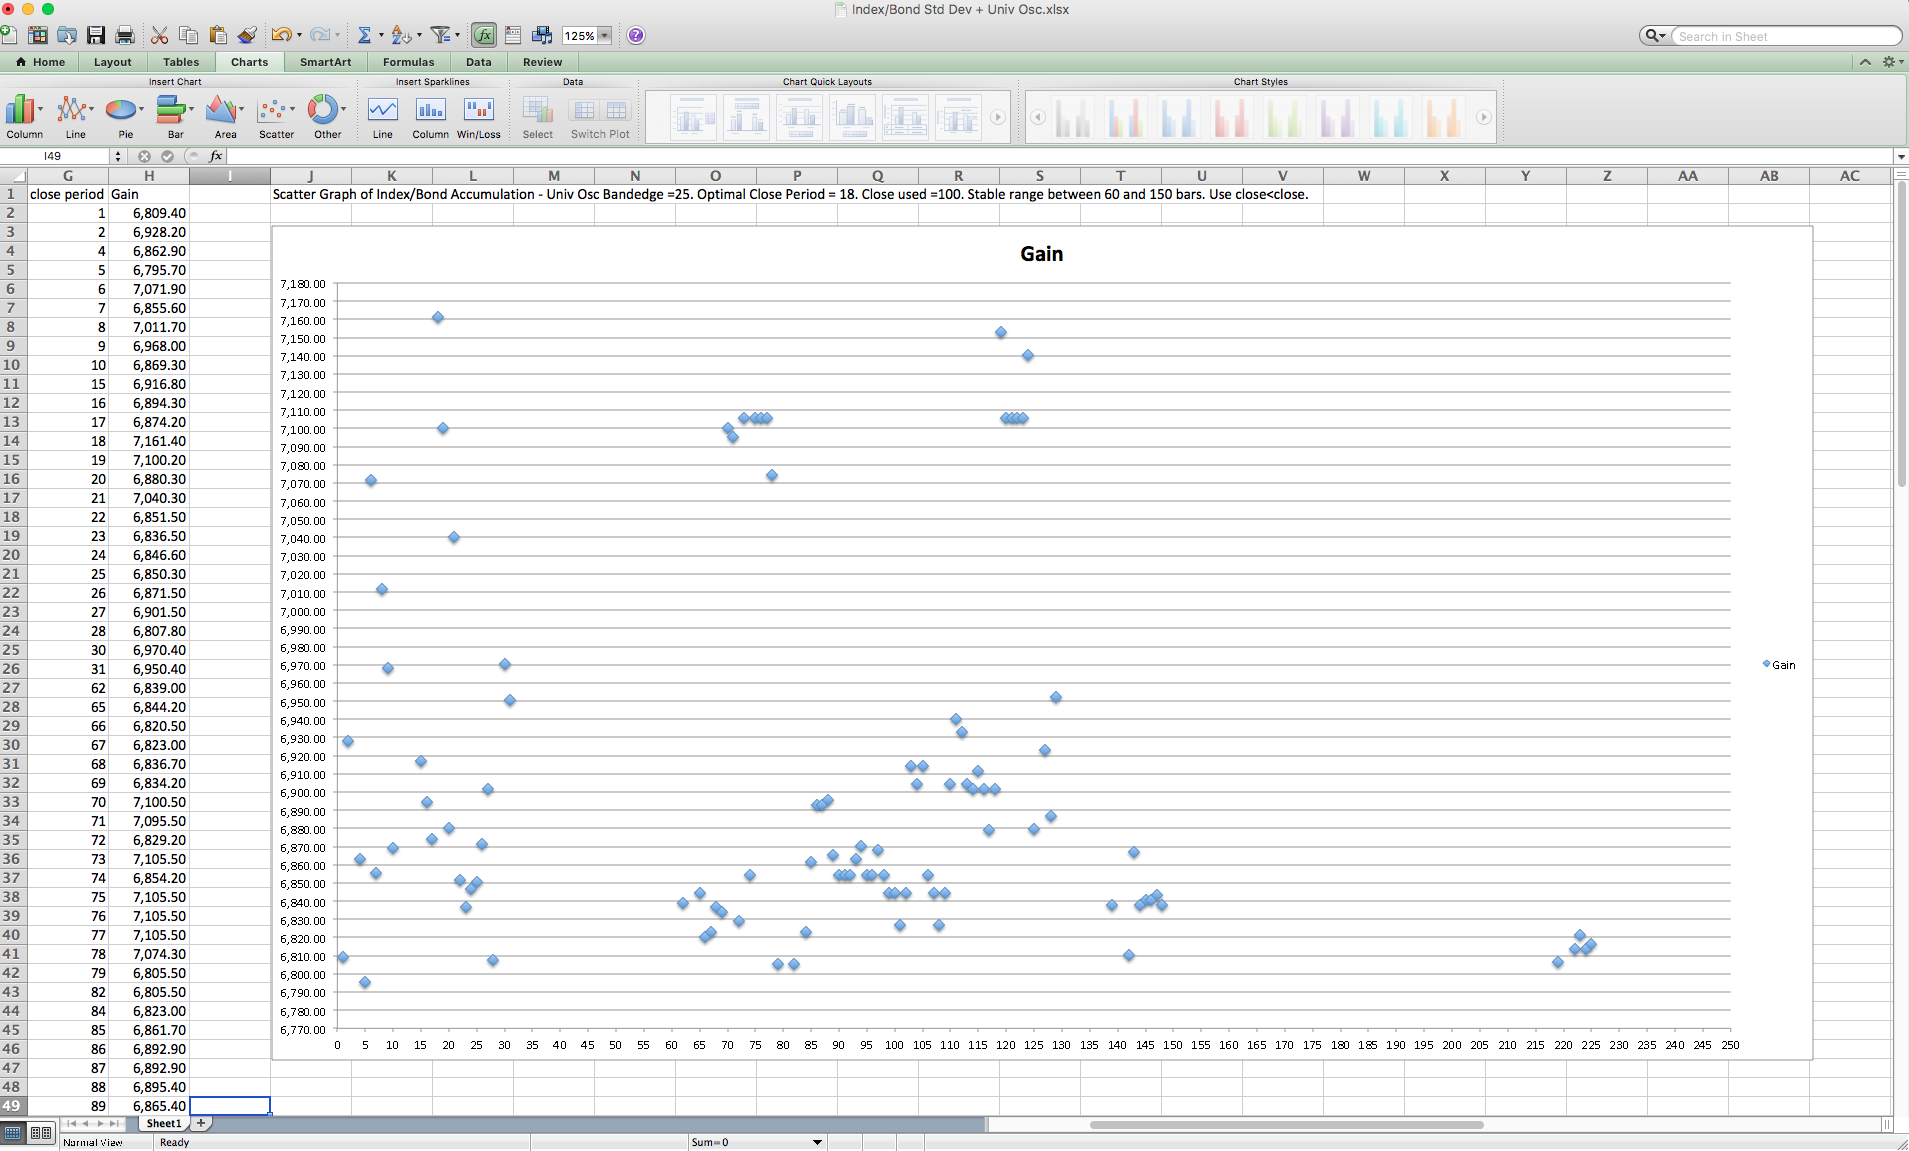
Close>Close[1]
Changed to Close<Close[100]. I’ve included an Excel screen of the Period close optimisation to show that there is a stable range b/n 60 bars and 150.
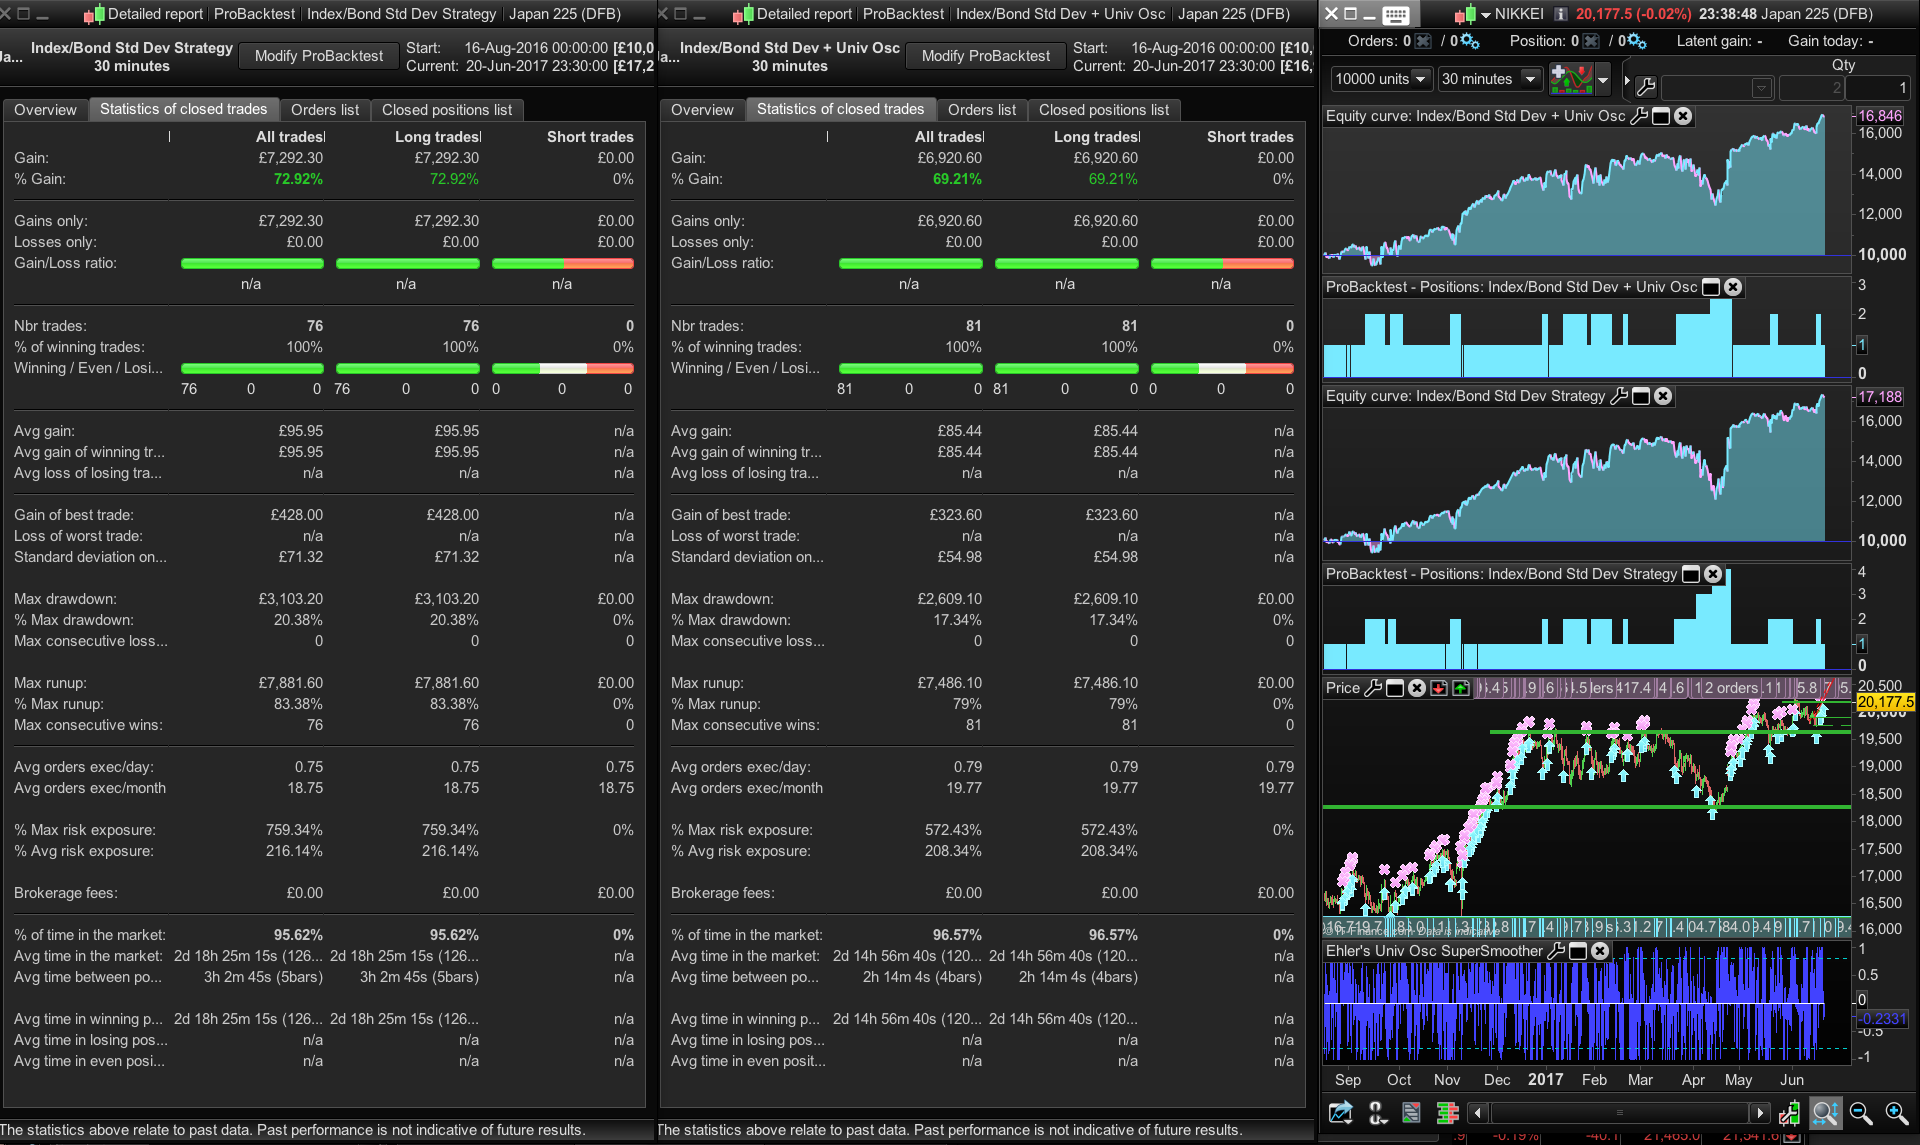
Testing on the Nikkei 30 mins charts there is only marginal improvement in drawdown and not a particularly stable relationship between profit and the period of the chart 1, 2 hrs chosen – i.e. longer timeframes fail.
Btw what was the bug you mentioned that you found in v.1.0?
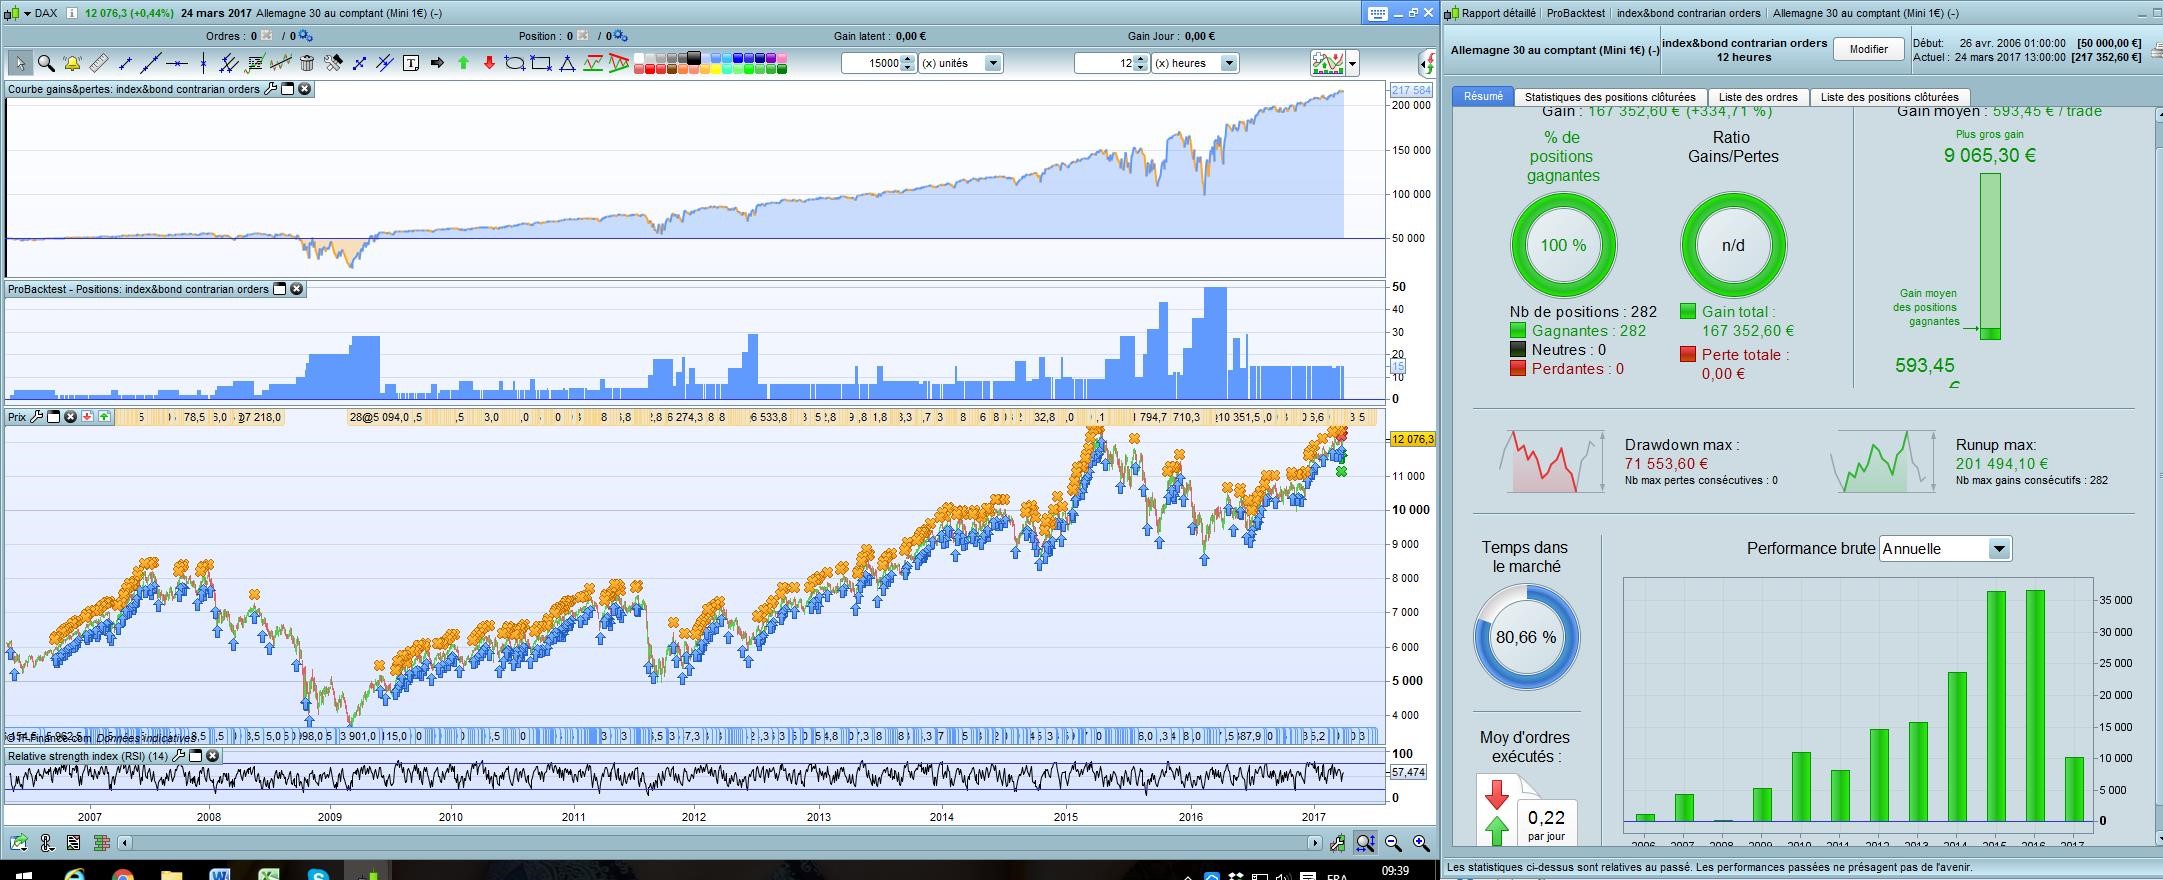
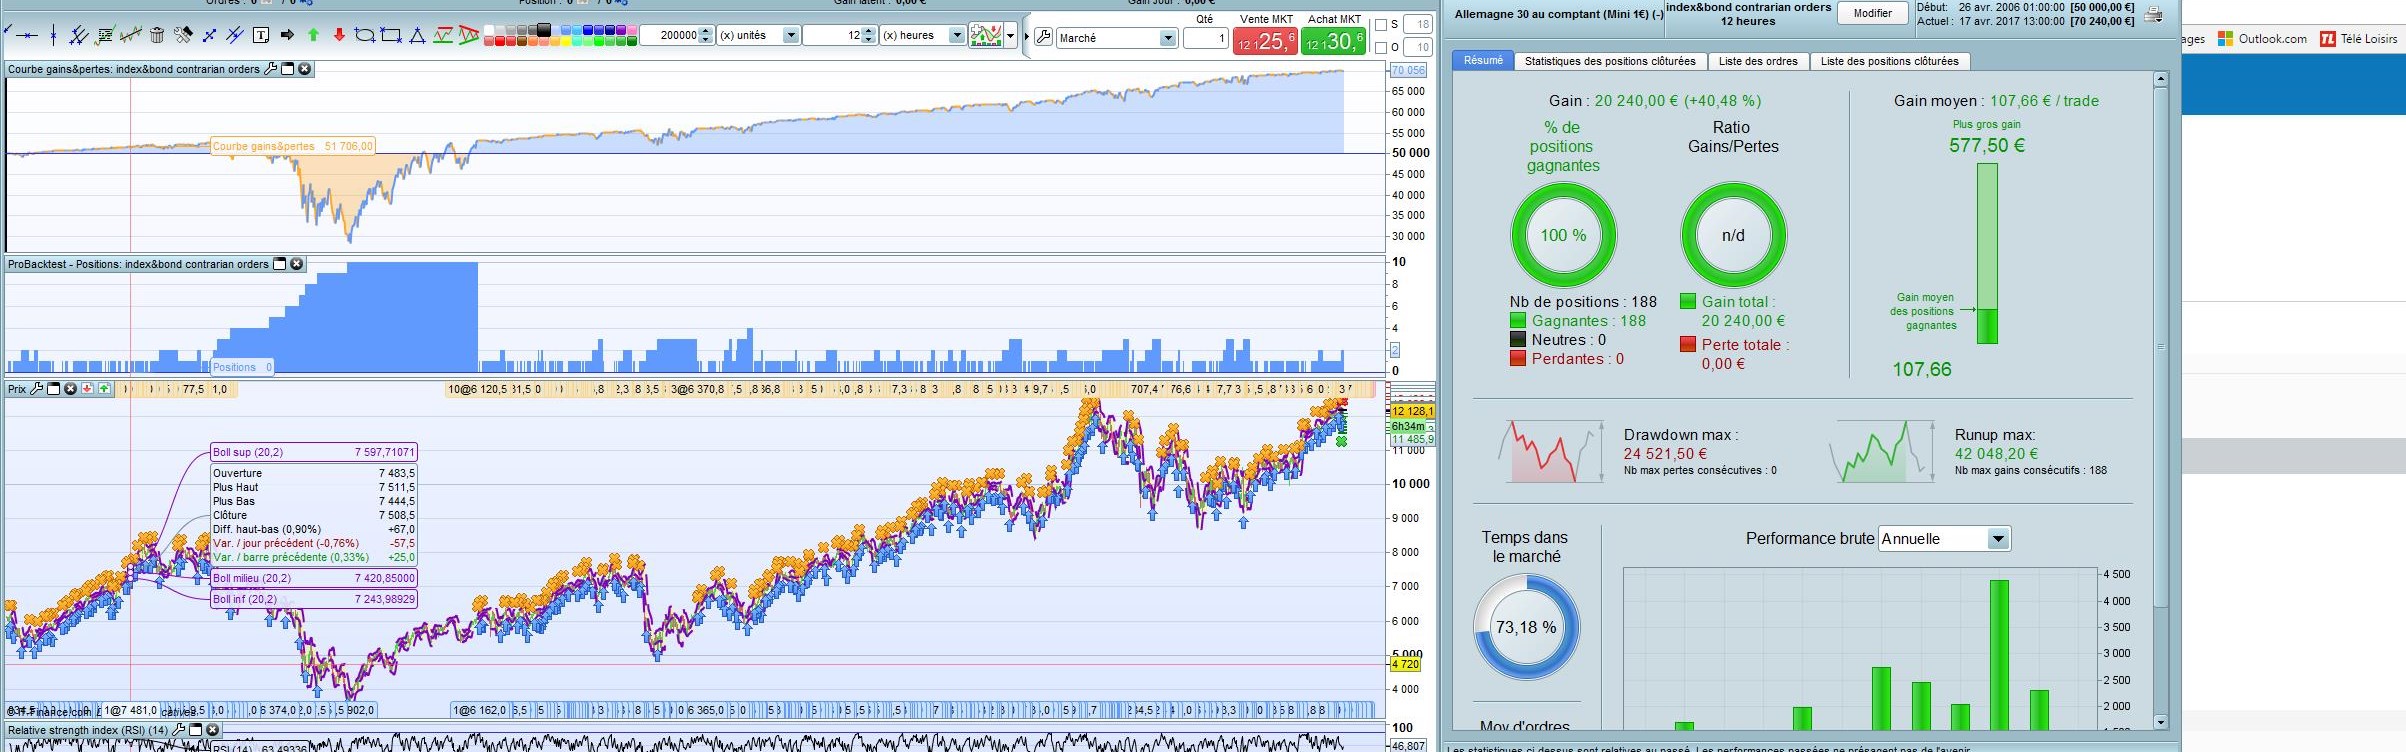
I tested this new strategy V.2.0 above today, on the S&P 500 and Dax, but I’m not sure (due to limited testing) if it is performing better than V.1.0 that you posted 3 months ago. I haven’t quite figured it all out yet.
Nice work Deio,
Cheers
Bard