I noticed an inconsistency before and wrote something relating to it, but I have now figured out specifically what it is and I would appreciate any input on this problem I’m dealing with.
When I backtest, I want to compare the entries and exits between my ProOrder code and the Indicator to make sure everything works as planned. However, I’ve noticed that some of these transactions occur when it shouldn’t have happened at all according to the indicator!
It seems that this is a problem between the counting of bars and specific commands.
When counting BarIndex in the Indicator, it starts with 0 (zero)
When counting BarIndex in ProOrder (for instance by using GRAPH command) it starts with 1!
This has a direct impact on for instance ATR and TR commands. TR won’t calculate on Bar 0 in Indicator, but will do so on Bar 1 in ProOrder – I have used DEFPARAM Preloadbars=0 !
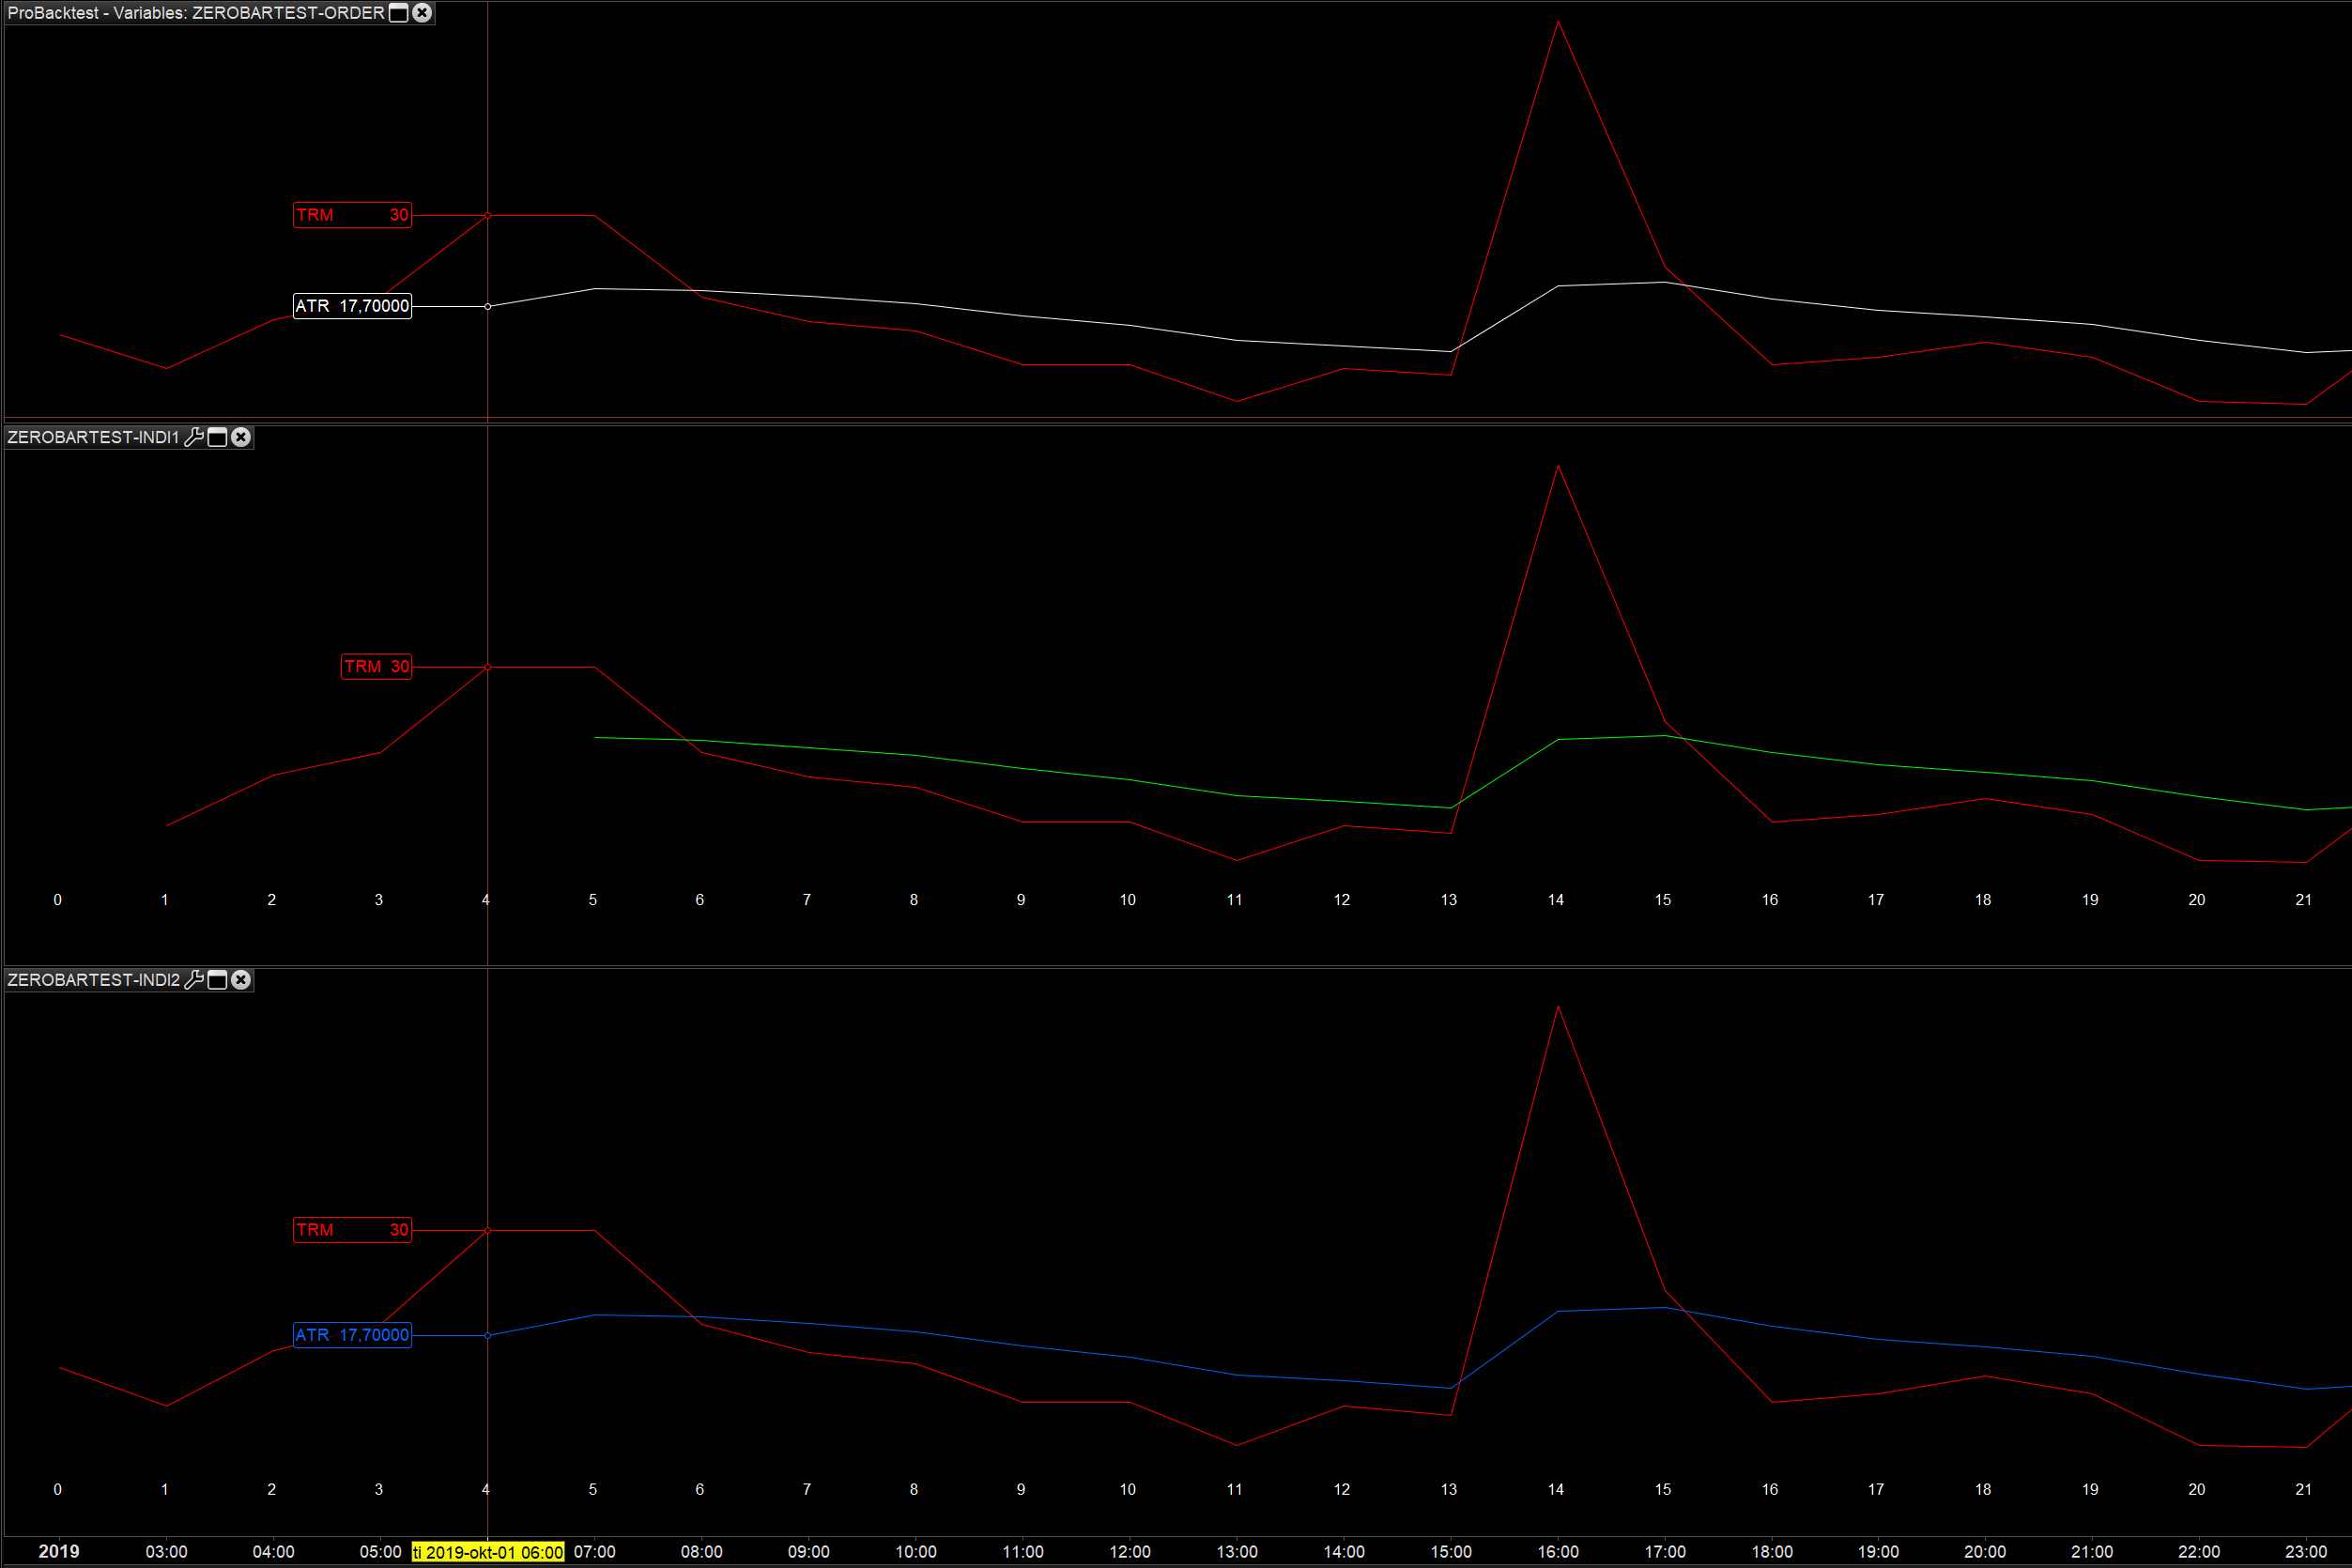
Please see the picture enclosed.
The picture has 3 graphs. The red in the picture is the TR
1) Backtest – ATR is White
2) Normal result on Indicator – ATR is green
3) Modified coding for Indicator – ATR is blue
Please note how the TR (RED), and ATR green forms one bar later in the normal Indicator output.
How do you guys deal with such inconsistencies? This may be very specific for certain functions, but causes a huge difference for specific indicators in the beginning of the calculation.
Please note, in order to understand what was going on, I have used the true formula (with simplification) of calculating TR and ATR, and not the proprietary one. However, both 1) BackTest and 2) Indicator show exact same results using the default one.
ProOrder Code
//Setting this to 0 to have same startup condition as Indicator
DEFPARAM PRELOADBARS = 0

//Simplified Mathematical formula. Similar to TR function in PRC

TRM = MAX(HIGH,CLOSE[1]) - MIN(LOW,CLOSE[1])

//Mathematical formula. Similar to AverageTrueRange function in PRC
ATR = AVERAGE[5,3](TRM)

GRAPH TRM COLOURED(255,0,0) AS "TRM"
GRAPH ATR COLOURED(255,255,255) AS "ATR"

//EVERYTHING BELOW IS MOCK TO INITIATE BACKTESTING
BARCOUNT = BarIndex

IF NOT LongOnMarket AND BarCount > 100000 THEN
BUY 1 CONTRACTS AT MARKET
ENDIF

If LongOnMarket AND Barcount > 200000 THEN
SELL AT MARKET
ENDIF
Indicator – Normal output
//Simplified Mathematical formula. Similar to TR function in PRC
TRM = MAX(HIGH,CLOSE[1]) - MIN(LOW,CLOSE[1])

//Mathematical formula. Similar to AverageTrueRange function in PRC
ATR = AVERAGE[5,3](TRM) //Manual

// To display BarIndex value on each bar
BARCOUNT = BarIndex
DRAWTEXT ("#BARCOUNT#", BarIndex, 0, dialog, standard, 16)

RETURN TRM COLOURED(255,0,0) AS "TRM", ATR COLOURED(0,255,0) AS "ATR"
Modified Indicator
//Simplified Mathematical formula. Similar to TR function in PRC

IF BARindex = 0 THEN
TRM = HIGH-LOW
ELSE
TRM = MAX(HIGH,CLOSE[1]) - MIN(LOW,CLOSE[1])
ENDIF

//Mathematical formula. Similar to AverageTrueRange function in PRC
ATR = AVERAGE[5,3](TRM) //Manual

// To display BarIndex value on each bar
BARCOUNT = BarIndex
DRAWTEXT ("#BARCOUNT#", BarIndex, 0, dialog, standard, 16)

RETURN TRM COLOURED(255,0,0) AS "TRM", ATR COLOURED(0,100,255) AS "ATR"