Surised to see when I opened PRT today, 15 Dec that I’m on Ver.11 ! Automatically.
I’m sure in the background there are changes/improvements but the GUI part is frustrating to me.
Some things missing that was there and now not. Like at the top all the “tools” one could use like draw line etc is no more. It only appears on the main PRT Menu and not on any other Instrument.
Colours are different and not the same as what I had in my other Templates.
Guess it will take some time getting used to.
Will test some strategies which I could not et to work on Ver 10.
Andre.
is no more
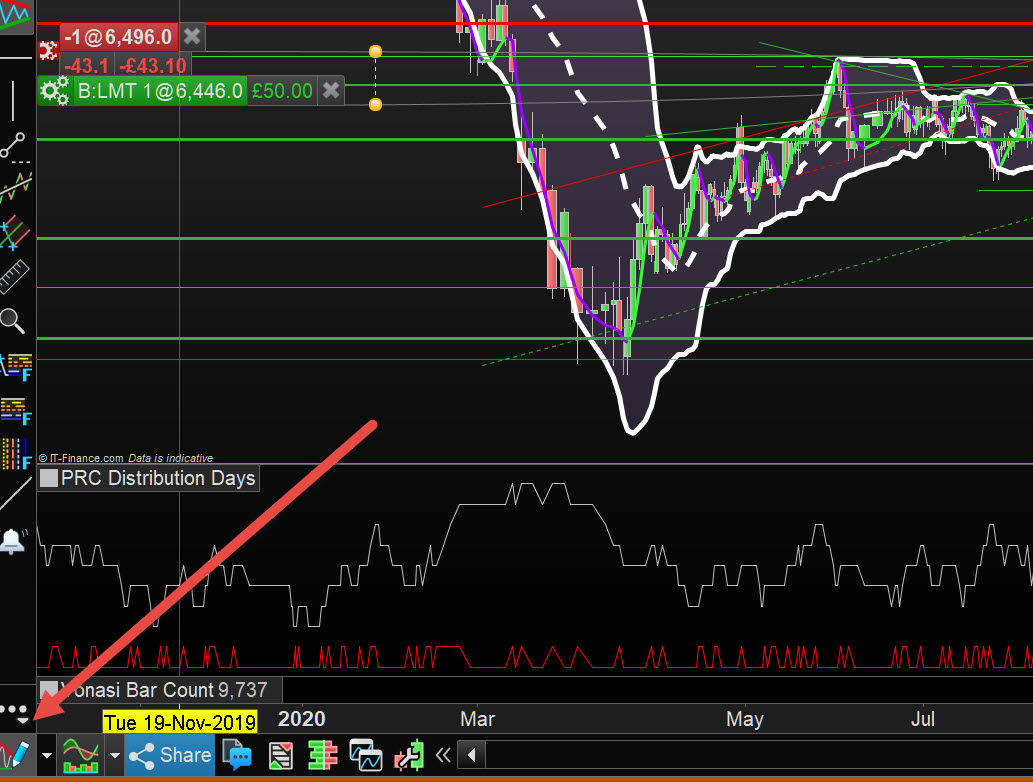
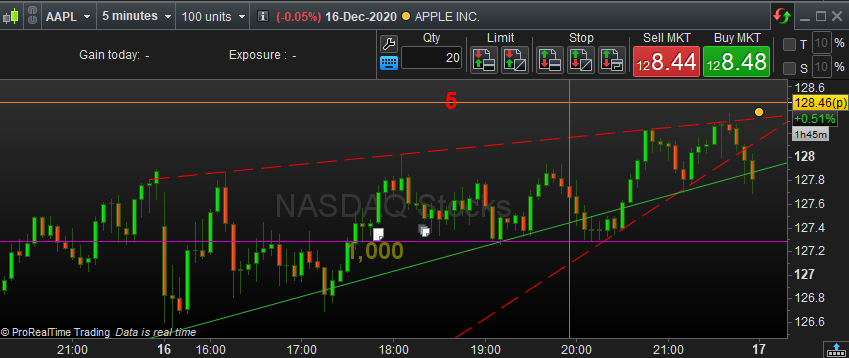
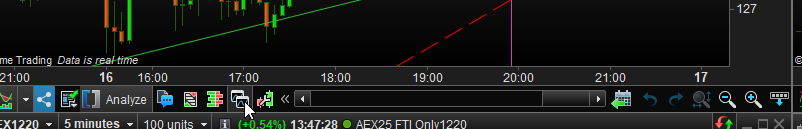
I sympathise .. it is easy to miss in v11 whereas in v10.3 drawing objects had a prominent position.
See the red arrowhead on attached
I have to confess that when I first trialed v11 I hated it. Way too many options and settings and some stuff that felt natural in v10.3 changed for stuff that just felt plain awkward in v11. Moderators had slightly earlier access to v11 than other users but I actually gave up on testing it quite early on and returned to v10.3. However before I gave up I coded some great indicators (great in my opinion!) much more easily than I could ever have done in v10.3 and also some indicators that were totally impossible in v10.3 thanks to all the new instructions and functions – mainly arrays and new graphic instructions.
Now that IG have finally got onboard with live data I have returned to v11 and I still find the mass of options and settings really annoying – just stuff I don’t need but perhaps someone once asked for. I guess it is a race to stay on top – other platforms have it so we must have it and more! There are however some very nice features for strategy testing such as 2D graphs and 3D graphs (but still nothing as powerful as my SEB testing!) I’m sure that with time the UI will feel more natural – so I’ll take the benefits and put up with the fact that I currently still find the UI rather frustrating!
v11 is a triumph in what it is possible to create and the programmers must be congratulated for that but it is perhaps not necessarily a triumph in what most people actually need or want…. it tries to make everyone happy and in the process provides at least something that everyone can find frustrating….. but once Frankenstein has been created it is damned near impossible to go back so I guess we all just have to learn to live with it and learn to love it. 🙂
Hi All,
I am using V11 for 18 months or so (maybe a bit less) and I don’t recall at all that I found it messy. But it may depend on what “your” objective is. Mine was : the less unnecessary icons and stuff in a chart, the more charts can be shown on my screen(s). So, back at the times this was announced as a “feature” and I set down for that and when V11 was there this really worked out and I was a happy camper.
What happened meanwhile is that features kept on being added, and honestly there are still days that I find new things. And over the at least past year the new things have been added regularly. So it is relatively hard to keep up with it.
Mind you, I try to envision how you all encounter it.
In the end (and throughout) I have no problems at all. I plainly love everything. But as implied above, I was able to get used to it more slowly.
Net you all should have the prospectus of not wanting to go back. Promise !
Regards,
Peter
PS: OK, the thing I find lacking compared to 10.3 is some (quite important) settings you could apply to a chart, and let that work upon all your charts (certain “template” things – I forgot which because I got used to it).
work upon all your charts
Above is what I’m finding timewasting and irritating … setting up for example a Fib Retrace with 78.6% and 88.6% levels …
I’ve configured aboves 3 or 4 times already, but there does not seem to be even a ‘Set as Default’ button anymore??
There are loads of similar irritants and because there are so many options re settings I am never quite sure if I am missing a setting etc … when all I want to do is (try) to make money!
I shut my mind to it all for over 2 years on v10.3 as I knew we would get v11, but we all need to get typing and send ‘Suggestions for Improvement’ direct to PRT.
Using the Form below is the best way to get improvements logged onto the PRT Roadmap.
https://www.prorealtime.com/en/contact?suggestion=1
does not seem to be even a ‘Set as Default’ button anymore?
Well NO there isn’t, but we can save a configuration as a named setting.
I’ll make sure File > ‘Start on this Computer with this Workspace’ is ticked and hope (after Exit > Save and Log back in) my GH Pref settings appear when I next draw a Fib Retrace.
Not complaining, but
Well NO there isn’t, but we can save a configuration as a named setting.
I never got that to work satisfactory. So *this* is a typical feature that I deem too complicated;
Maybe by now I forgot – maybe it has changed by now, but what I recall of it, is that each “element” in the graph can be dedicated such a configuration. So how would this help really ?
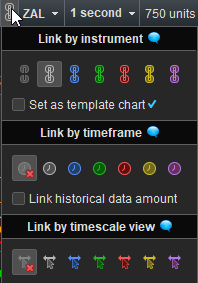
It is my hunch that the “linked charts” can bring us further (see attachment). This is enormously powerful, not really obvious, and when you start using it you won’t understand for ages how to deal with it. But that will be your own fault. Hahaha.
But seriously, will that help you ?
All with the same link colour will open similar with saved settings in them. Notice, however, that a similar function existed in V10.3 just the same.
Also see next post.
This one I find very very useful, and is in the context of the issues of this topic.
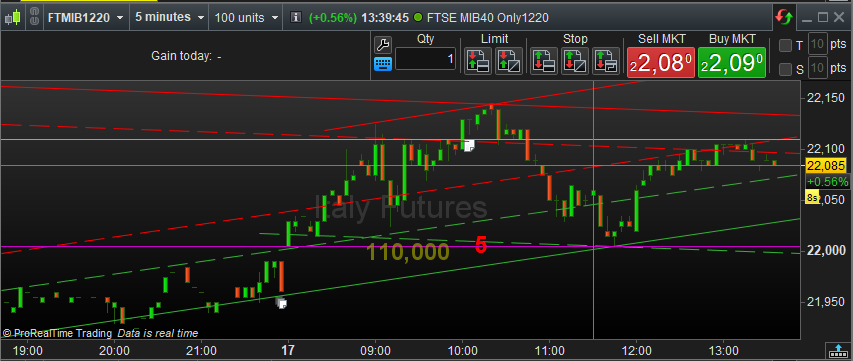
See first attachment. Just some chart. But, with various dedicated settings.
See second attachment for what I drop down.
The third attachment shows that I now loaded a new chart with the same settings as the “base” one. This is now not related to “linked” (as described in the other post).
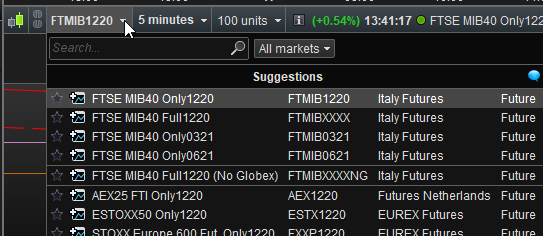
The fourth attachment shows how you’d actually start this for a new chart, assumed you want the existing one to remain on screen.
So that makes a copy of your “base” chart, and is ready for what I described above.
Maybe this helps a little ?
Do you remember that video I made last year? I was discovering the new version, so it is not the last updated one, but still you might discover hidden things:
[youtube]https://youtu.be/bz4pn2XDSJ4[/youtube]