Hi,
I’m struggling to write the logic to use when skipping trades for N days if last trade was stopped out. This is to avoid consecutive bad days in poor market conditions.
once varhardSL = 70

// Determine when to skip:
// If low of today's bar is below today's SL level (close last bar minus stop loss level), it determines the stop was hit.
skipTrade = 0 // Start by assuming not hit every bar
if Low[0] <= (Close[1] - (varhardSL)) then
skipTrade = 1
endif
graphOnPrice (Close[1] - (varhardSL))
graph skipTrade

// Enter trade
c1 = 1
c2 = 1
buyCriteria = c1 and c2 and skipTrade < 1
if buyCriteria then
BUY possize SHARES AT MARKET
Set stop $loss varhardSL
set target $profit 140
endif
Trying this on Usa500 daily 00:00-00:00 hours
It will skip the third down day but still enter on the second which I’d want to avoid.
Any ideas?
Br
You could try something like this:
once varhardSL = 70

// Determine when to skip:
// If low of today's bar is below today's SL level (close last bar minus stop loss level), it determines the stop was hit.
if Low[0] <= (Close[1] - (varhardSL)) then
skipTrade = 4
endif

skiptrade = skiptrade - 1

// Enter trade
c1 = 1
c2 = 1
buyCriteria = c1 and c2 and skipTrade < 1

if buyCriteria then
BUY possize SHARES AT MARKET
Set stop $loss varhardSL
set target $profit 140
endif
I’m guessing that you are trading daily candles?
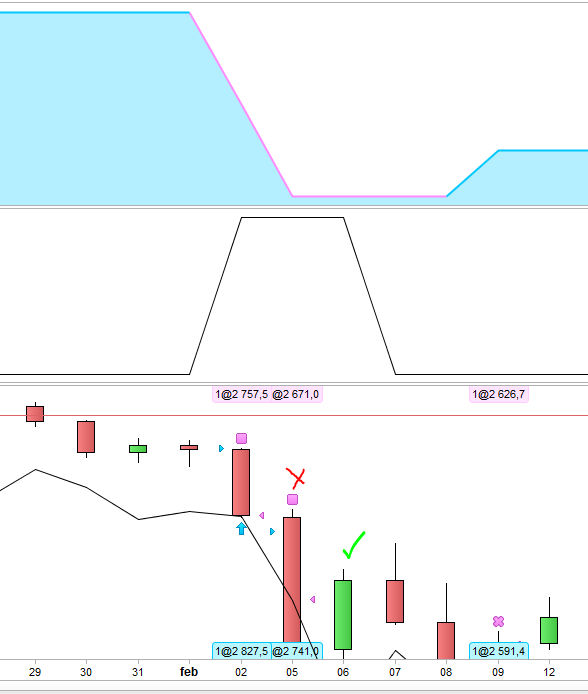
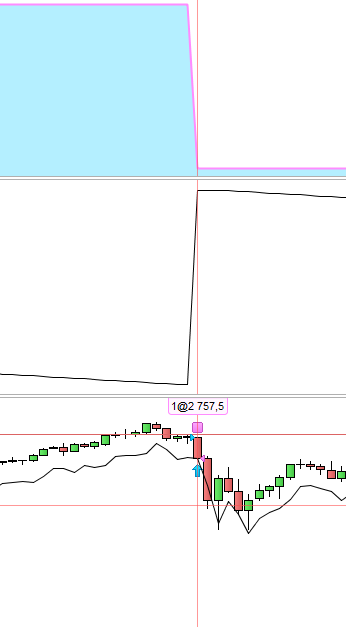
Thank you, Vonasi! However that seems to work at one “SL streak” but at another one it persists? skipTrade is for some reason not propely set
See attachments where I graph the skipTrade under the equity curve window
Yes daily bars.
It is difficult to understand what you think is not working from your description and images. I cannot see what time frame you are on or what the values of the candles are.
The code as written will stay out of the market any time that the current candles low is less than the previous candles close minus 70. It does not know whether you were on the market with a trade or not.
I just adjusted the code you provided to do what you wanted!
I understand. I’ve attached the full strategy code if you’d like to test. On Usa500 (ES) 1eur contract daily bars 00:00-00:00 hours. Spread 1.6.
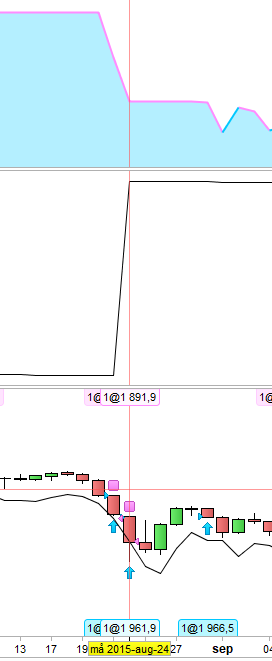
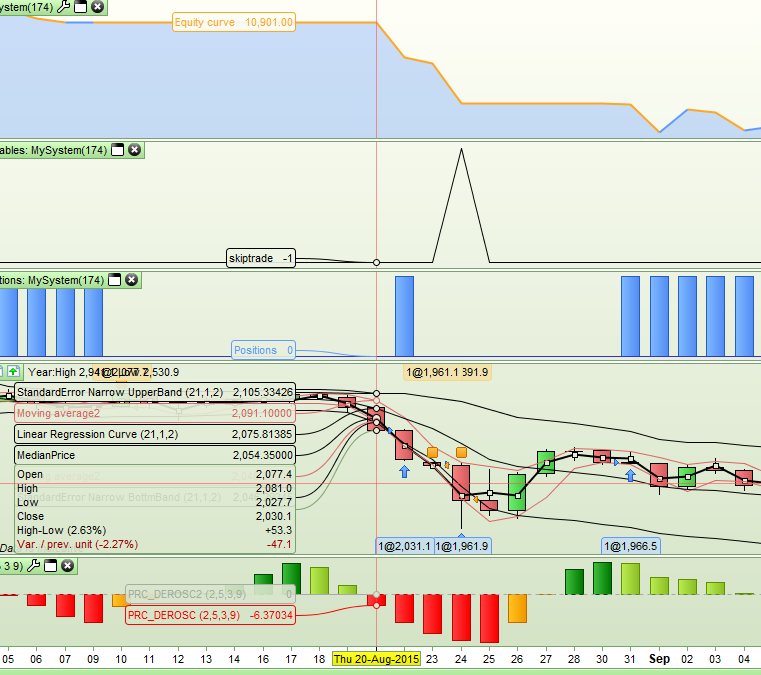
As can be seen there are sharp drops in the equity curve at August 24 2015 and February 2 2018, which I was thinking could be avoided if not allowing consecutive trades around stop loss reached days.
DEFPARAM CumulateOrders = False

once varMaxHoldTime = 6
once varSellAtProfitablecloses = 1
once varNumProfitableClose = 0
once varAvoidDay = 3
once varhardSL = 70

//  Entry
once skipTrade = 0
if Low[0] <= (Close[1] - (varhardSL)) then
skipTrade = 4
endif

skiptrade = skiptrade - 1

graphOnPrice (Close[1] - (varhardSL))
graph skipTrade

c1 = dayofweek <> varAvoidDay
c2 = ((high + low + close)/3)[0] <= ((high + low + close)/3)[1]
c3 = open[6] <= close[7] and high[1] <= high[8]

buyConditions = c1 and c2 and c3 and skipTrade < 1
if buyConditions then
BUY 1 SHARES AT MARKET
Set Stop $Loss varhardSL
endif

if onmarket[0] = 0 and onmarket[1] = 1 then
varNumProfitableClose = 0
endif

// +1 profitable close
if LongOnMarket and Close[0] >= TradePrice then
varNumProfitableClose = varNumProfitableClose + 1
endif

//  Exit: Profitable close
if varNumProfitableClose >= varSellAtProfitablecloses then
Sell at Market
ENDIF

//  Exit: Max hold time reached
if LongOnMarket and barindex - tradeindex >= varMaxHoldTime - 1 then
sell at Market
endif
As far as I can see the reason for the poor equity curve at those times is because your entry criteria was met. 70 pips on the SP500 is a big drop and on the day of Aug 20 that condition was not met so a trade was entered at the open of the next day. On the Aug 23 the conditions were also met and another losing trade entered. On Aug 24 your 70 pip drop condition was met and no trade entered.
[attachment file=82519]
Your code has a lot of unnecessary stuff in it so I edited it to make it more readable. Here is my ‘light’ version:
DEFPARAM CumulateOrders = False

varMaxHoldTime = 6
varSellAtProfitablecloses = 1
varAvoidDay = 3
varhardSL = 70

//  Entry
skipTrade = 0
if Low <= (Close[1] - (varhardSL)) then
skipTrade = 4
endif

skiptrade = skiptrade - 1

c1 = dayofweek <> varAvoidDay
c2 = ((high + low + close)/3) <= ((high + low + close)/3)[1]
c3 = open[6] <= close[7] and high[1] <= high[8]

buyConditions = c1 and c2 and c3 and skipTrade < 1

if buyConditions then
BUY 1 SHARES AT MARKET
Set Stop $Loss varhardSL
endif

if not onmarket and onmarket[1] then
varNumProfitableClose = 0
endif

// +1 profitable close
if LongOnMarket and Close >= TradePrice then
varNumProfitableClose = varNumProfitableClose + 1
endif

//  Exit: Profitable close
if varNumProfitableClose >= varSellAtProfitablecloses then
Sell at Market
ENDIF

//  Exit: Max hold time reached
if LongOnMarket and barindex - tradeindex >= varMaxHoldTime - 1 then
sell at Market
endif

graph skiptrade