How to show profits and losses in the chart without backtesting

Viewing 1 post (of 1 total)

  • Author
    Posts
  • #107063 quote
    MalendMalend
    Participant
    Average

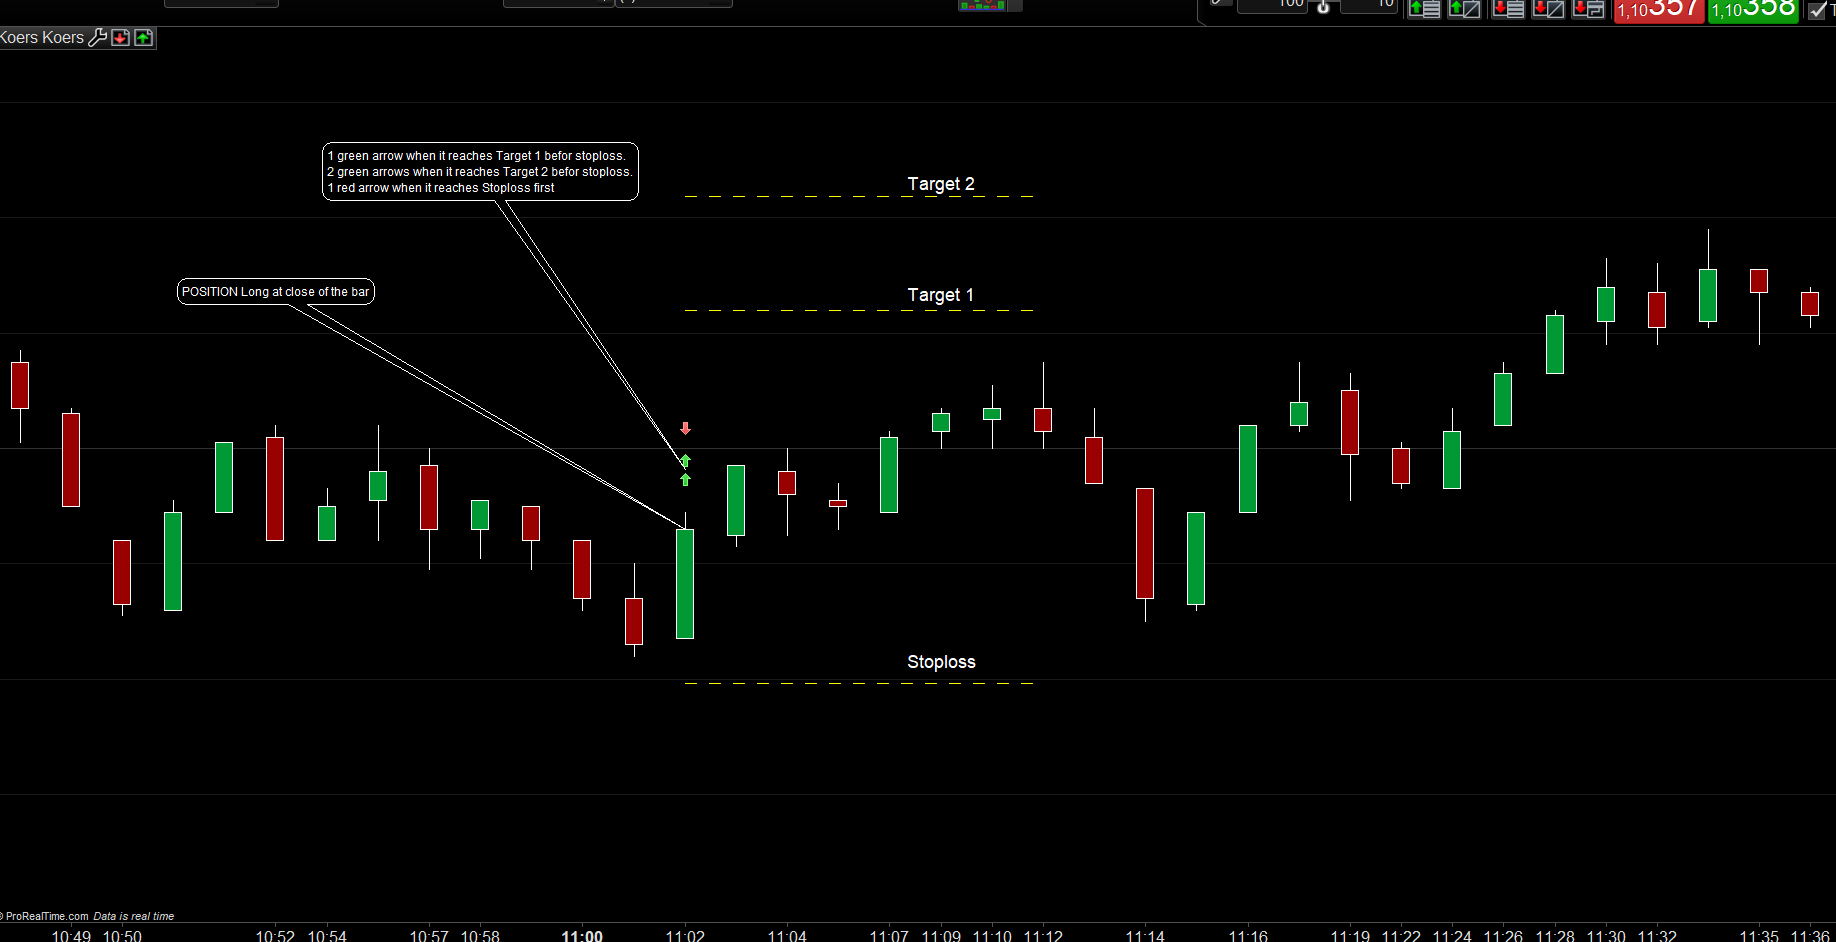
    I am looking for a way to see if a possible postion based on one or more indicators  reaches a Target1 or even a Target2 befor it reaches StopLoss or the other way around. See the attached image.

    When it reaches Target 1 before Stoploss I want a green arrow up above the candle where I took position,
    When it reaches even Target 2 befor Stoploss. I want another green arrow abow the green arrow from Target 1.

    When it reaches Stoploss first I get a red arrow above te candle where I took postion.

    I tried this only with one Target of 10 and a SL of 5, but…..I missed something.

    Any ideas?

    if Target1 < close + 10 and SL > close - 5 then // start cycle
    inposition = 1
    endif
    if Target1 => close + 10 or SL =< close - 5 then
    inposition = 0
    endif
     
    if inposition then
    c1 = close => target1
    c2 = close =< SL
     
    if c1 then
    drawarrowup(barindex,low)coloured(0,250,0)
    endif
    if c2 then
    drawarrowdown(barindex,low)coloured(250,0,0)
    endif
    endif
    return
    TASL.jpg TASL.jpg
Viewing 1 post (of 1 total)
  • You must be logged in to reply to this topic.

ProRealAI ProRealAI New

Stuck on this ProBuilder code?

Describe what this topic is trying to build, in plain English, and ProRealAI writes the ProRealTime™ indicator, screener or system for you.

Available in 7 languages
Try ProRealAI

How to show profits and losses in the chart without backtesting


ProBuilder: Indicators & Custom Tools

New Reply
Author
author-avatar
Malend @malend Participant
Summary

This topic contains 1 voice and has 0 replies.

Topic Details
Forum: ProBuilder: Indicators & Custom Tools
Language: English
Started: 09/10/2019
Status: Active
Attachments: 1 files
ProRealCode ProRealCode
Loading...