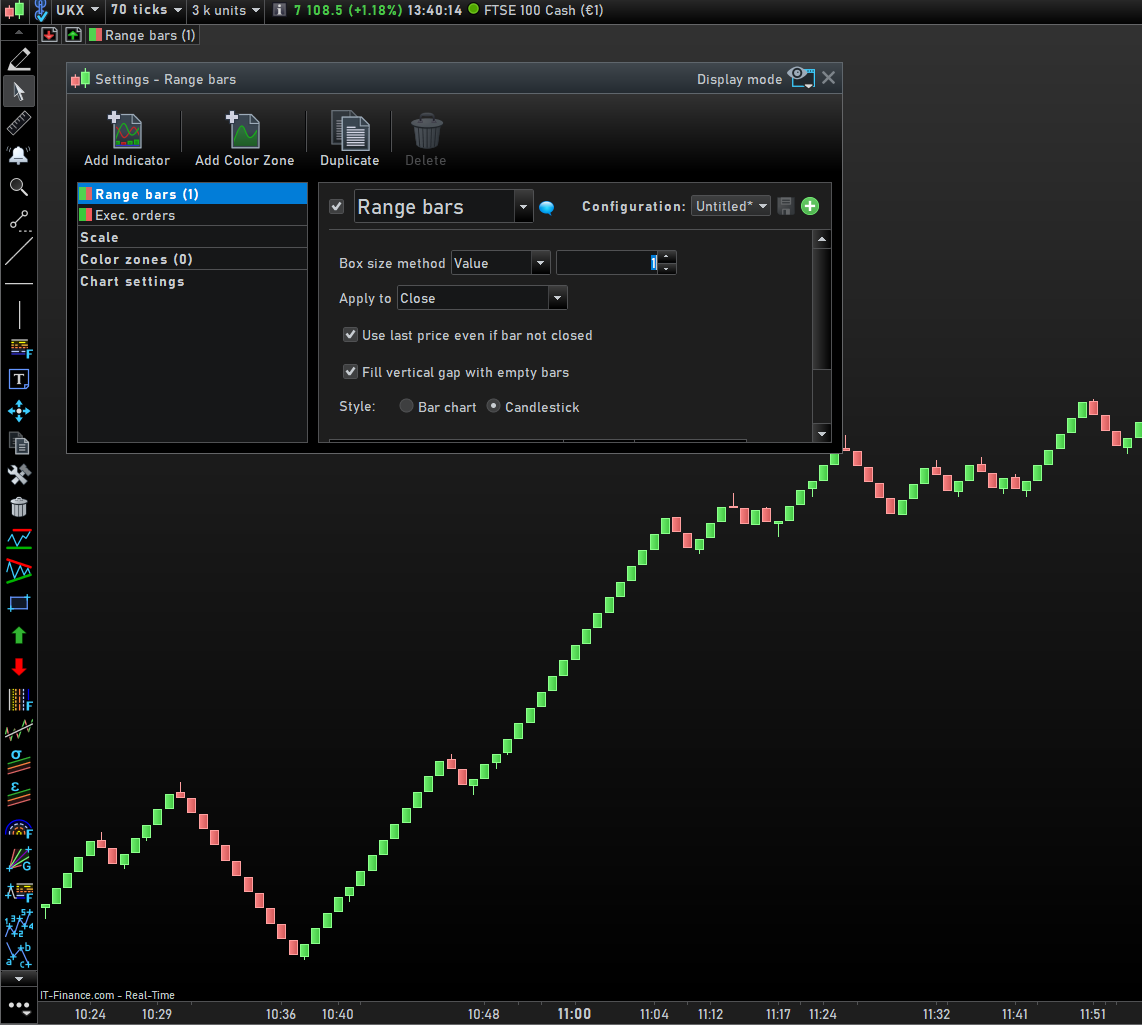
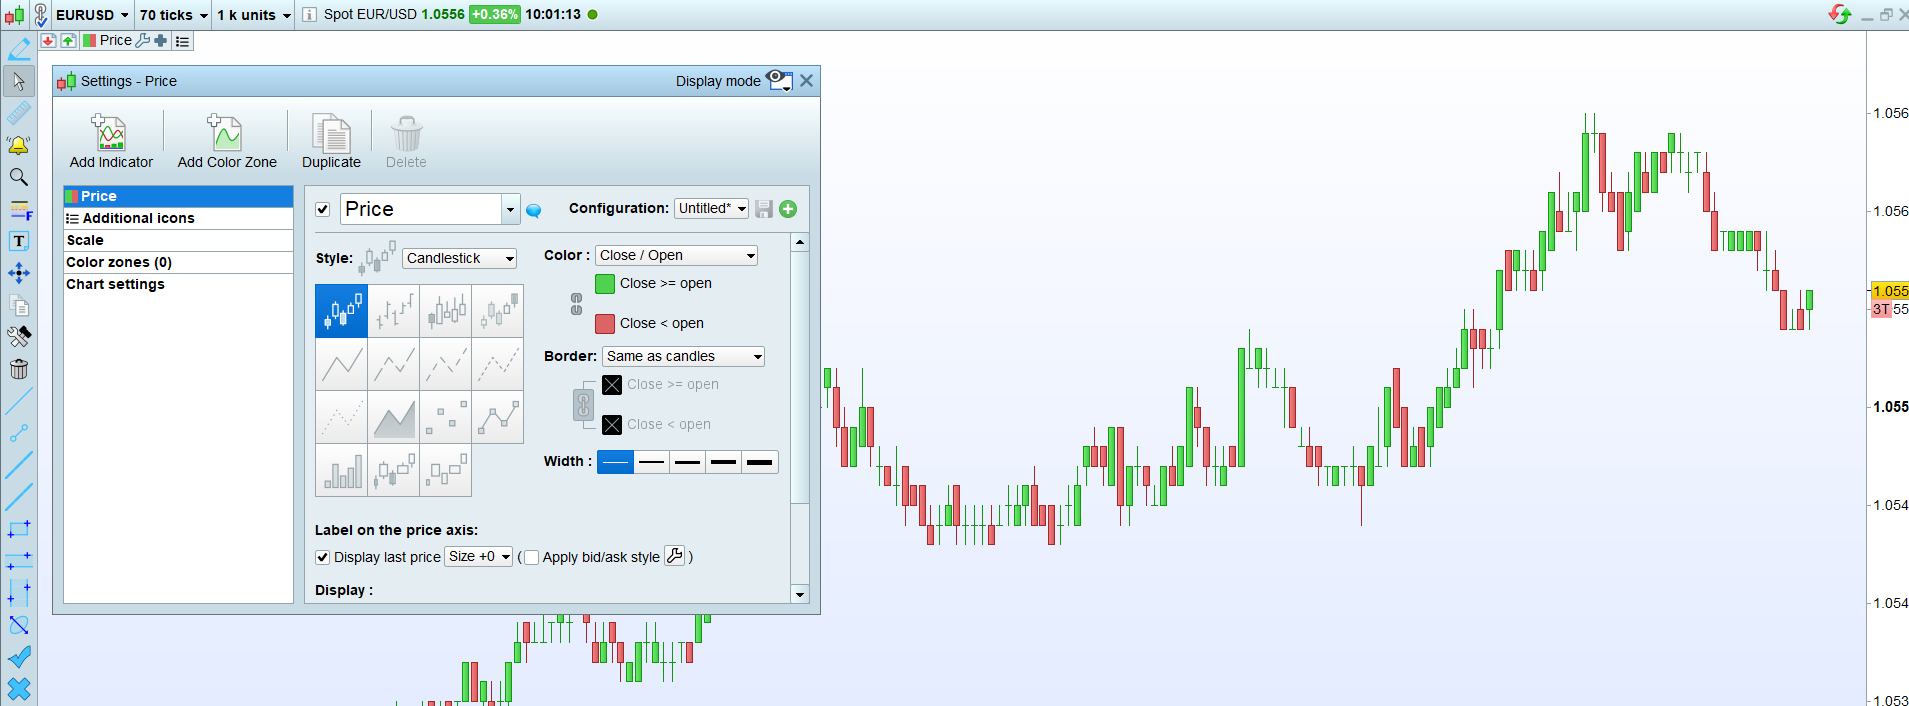
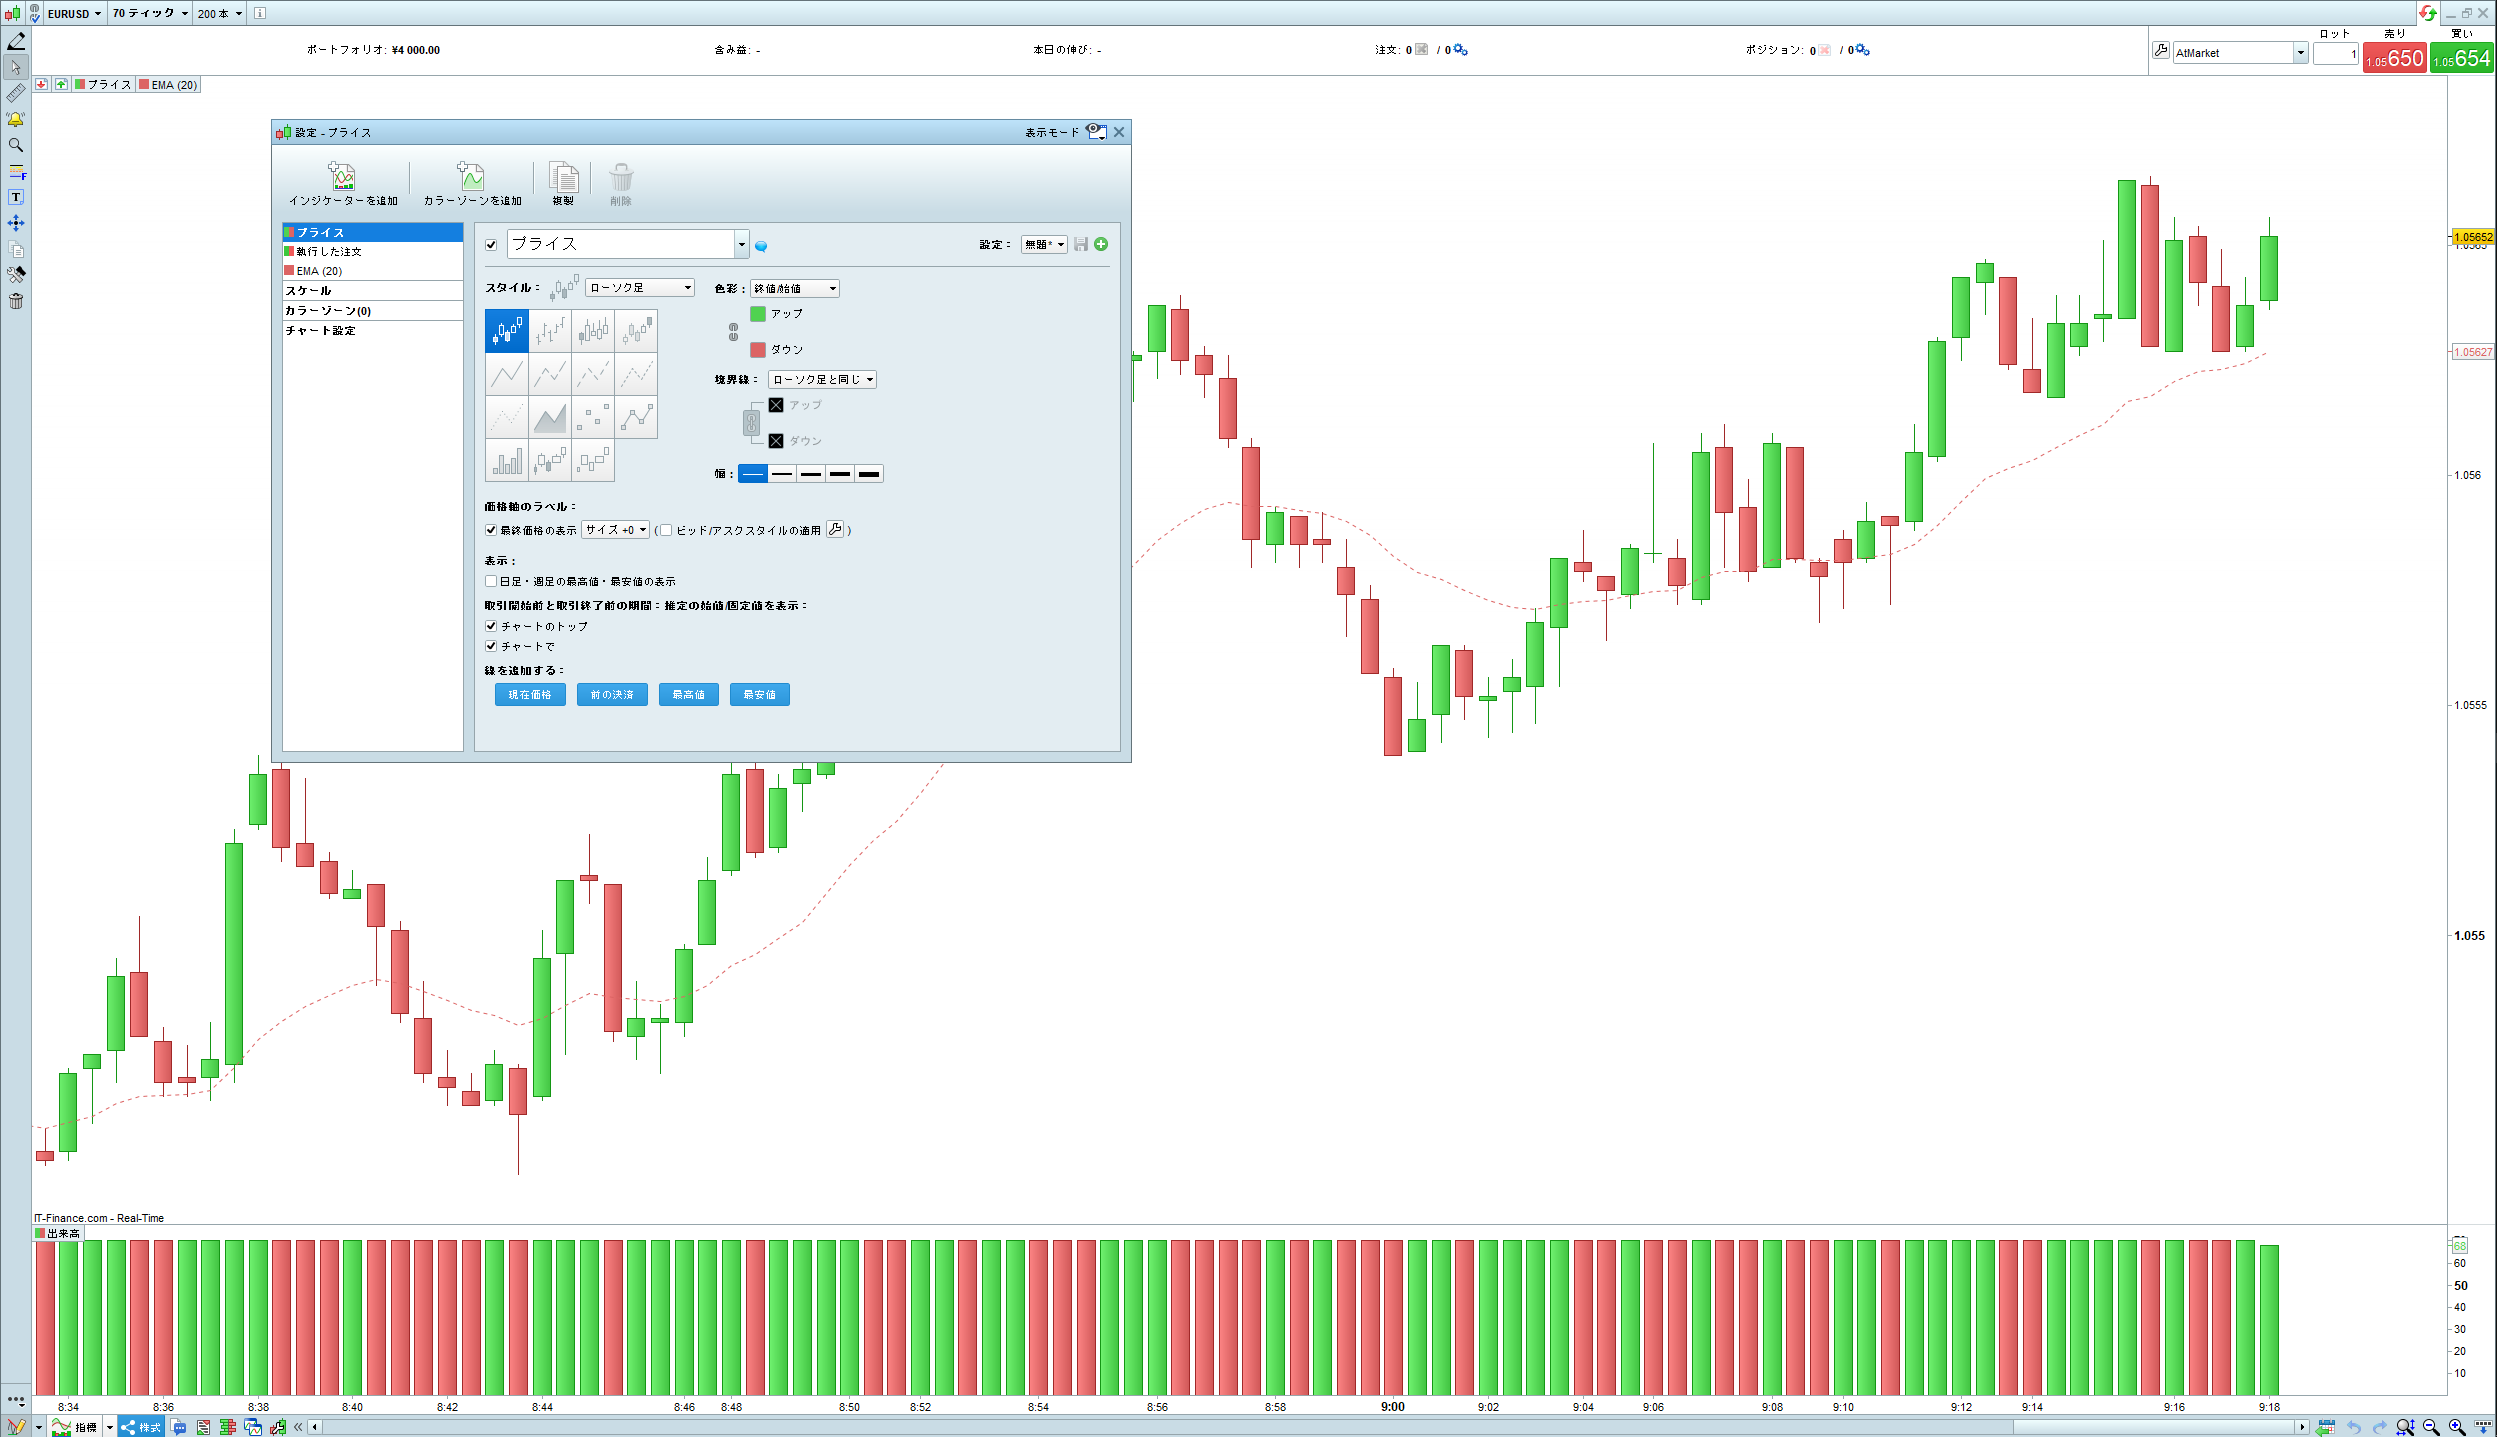
I cannot figure out how to set the candlestick height in 1 pips increments.
I tried with ProRealTime 10.3 and 11.1 but could not figure it out.
I want to display the chart the same as the 70 tick chart in Bob Volman’s book.
You should post the formula (definition).
Or a picture of how it looks as I can’t find anything related on the internet, thanks!
Thank you all.
It looks like it would be easier to create it in MT4, as there doesn’t seem to be a setup provided.
I don’t think so, you can’t create candlestick of a defined height, on the fly with MT4, and without huge code work 😆
Please find below examples of 70-tick charts of 1 point candlestick value, created within a few seconds, without custom coding, in ProRealTime.
I am not sure that what Nicolas showed is the intention of Bob Volman. I am also not sure whether my example is (this is just standard PRT charting). Anyway, my bars are 70 ticks fixed height. You can see in the top of the chart what I set to make it look like it does. One thing : the 70 ticks must be added as a unit. See second attachment. After that has been added, select it for the chart.
I cannot figure out how to set the candlestick height in 1 pips increments.
That will lack in my “solution” for sure. Additionally I don’t see how 1 pip increments can exist ? However :
It could be about organising the chart such that you have one pip difference (thus vertically) in view only. But that can’t work because 1 pip occurs easily within the 70 tick candle. I read something about 4 pips ? That would be possible but also goes “automatically” when you select the 70 tick bar size (like I did).
Btw, Bob Volman uses PRT himself.
Bars with fixed height in points are renko or range bars, this is what I have shown. But as long as we do not have further explanation, I believe we can’t help more 🙂
Bars with fixed height in points are renko or range bars, this is what I have shown.
Haha Yes. So this is certainly what was asked for (ehm, in my interpretation – hight in points = pips). But this is not what the Bob Volman method seems to be about. That would be about 70 tick size candles (??).
Now we have two methods without knowing what to do with them.
And oh, I already headed for the first book about this by Bob Volman. I think it could be interesting. Especially when PRT would allow for Autotrading on tick charts. 😉
Thanks for everything.
https://www.dropbox.com/sh/1amxmi9af0fk6ej/AABQgqfrdxqb3Pb_rN3EWA68a?dl=0
I wanted the minimum vertical length of the bar (Start, End, Min, Max) to be drawn in units of 1 Pips (=10 Pipettes) instead of 1 Pipette.
(The indicator for said requirement in MT4 can be bought for $200)
Those charts in your dropbox files are from PRT, with a 70 ticks chart, no more, no less, with classic candlesticks or range bars (set to 10 pipettes as you said).
Ok, that’s what I said, 70 ticks charts with classic candlesticks (see attached) on Spot EUR/USD.
I am doing something wrong.
But I don’t know what’s wrong.
arakawa, can you tell us what you think is wrong ?
The difference I see from what Nicolas showed is that he uses 1K units in his chart and you use 200 units. Technically this does not make a difference, but for psychology it does make a difference because the chart now looks different.
Notice that you can use the scroll-wheel to show more or less in the chart (I think this is important for you) and that you can reset it with the button you see below under the mouse pointer.